. 2022 Jul 16;127(13):e2022JD036733.
doi: 10.1029/2022JD036733. Epub 2022 Jul 12.

Insect Herbivory Caused Plant Stress Emissions Increases the Negative Radiative Forcing of Aerosols

Affiliations

Insect Herbivory Caused Plant Stress Emissions Increases the Negative Radiative Forcing of Aerosols

E Holopainen et al. J Geophys Res Atmos. .

Abstract

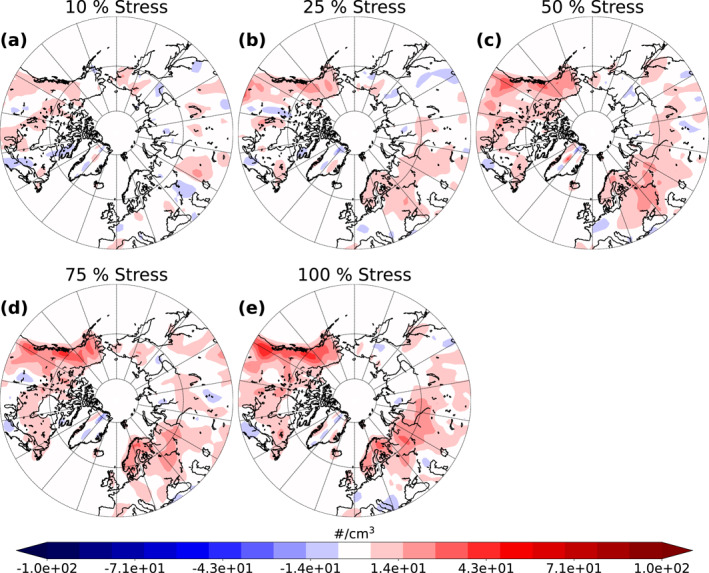
Plant stress in a changing climate is predicted to increase plant volatile organic compound (VOC) emissions and thus can affect the formed secondary organic aerosol (SOA) concentrations, which in turn affect the radiative properties of clouds and aerosol. However, global aerosol-climate models do not usually consider plant stress induced VOCs in their emission schemes. In this study, we modified the monoterpene emission factors in biogenic emission model to simulate biotic stress caused by insect herbivory on needleleaf evergreen boreal and broadleaf deciduous boreal trees and studied the consequent effects on SOA formation, aerosol-cloud interactions as well as direct radiative effects of formed SOA. Simulations were done altering the fraction of stressed and healthy trees in the latest version of ECHAM-HAMMOZ (ECHAM6.3-HAM2.3-MOZ1.0) global aerosol-climate model. Our simulations showed that increasing the extent of stress to the aforementioned tree types, substantially increased the SOA burden especially over the areas where these trees are located. This indicates that increased VOC emissions due to increasing stress enhance the SOA formation via oxidation of VOCs to low VOCs. In addition, cloud droplet number concentration at the cloud top increased with increasing extent of biotic stress. This indicates that as SOA formation increases, it further enhances the number of particles acting as cloud condensation nuclei. The increase in SOA formation also decreased both all-sky and clear-sky radiative forcing. This was due to a shift in particle size distributions that enhanced aerosol reflecting and scattering of incoming solar radiation.

Keywords: aerosol‐cloud interactions; global modeling; plant stress; radiative forcing; secondary organic aerosol; volatile organic compound.


Figures

Figure 1
Figure 1
Needleleaf evergreen boreal (a) and broadleaf deciduous boreal (b) tree plant functional types from MEGAN. The percentage is a representation from the total land cover of the Earth. The red dots represent the locations of the field measurements, which were used to determine the average of healthy and stressed emission factors of these trees.
Figure 2
Figure 2
Seasonal average total monoterpene emission from years 2000 to 2009 simulated with the base simulation with the average global and boreal area sums for winter (December, January, and February) (a), spring (March, April, and May) (b), summer (June, July, and August) (c) and fall (September, October, and November) (d).
Figure 3
Figure 3
Wilcoxon signed‐rank test of secondary organic aerosol (SOA) burden from summer from 10‐year period between the upper bound and base simulations.
Figure 4
Figure 4
Absolute mean value of the base simulation (a) and absolute difference between the base simulation and the different stressed simulations (10 % (b), 25 % (c), 50 % (d), 75 % (e) and 100 % (f)) of mean secondary organic aerosol (SOA) burden, over land areas, from summer over 10‐year period.
Figure 5
Figure 5
Absolute difference between the base simulation and the different stressed simulations (10 % (a), 25 % (b), 50 % (c), 75 % (d) and 100 % (e)) of mean land area cloud top cloud droplet number concentration (CDNC) weighted with cloud time from summer over 10‐year period.
Figure 6
Figure 6
Mean land area clear‐sky top of the atmosphere (TOA) shortwave radiative forcing (RF) (aerosols) between the base simulation and the different stressed simulations (10% (a), 25% (b), 50% (c), 75% (d) and 100 % (e)) from June to August from 10‐year period.
Figure 7
Figure 7
Mean land area all‐sky top of the atmosphere (TOA) shortwave radiative forcing (RF) (aerosols) between the base simulation and the different stressed simulations (10% (a), 25% (b), 50% (c), 75% (d) and 100 % (e)) from June to August from 10‐year period.
Figure 8
Figure 8
Box plots of field mean land area secondary organic aerosol (SOA) burden (a), cloud top cloud droplet number concentration (CDNC) weighted with cloud time (b) and clear‐sky (c) and all‐sky (d) top of the atmosphere (TOA) shortwave radiative forcing (RF) from 40 to 90° latitude region for summer from 10‐year period for all of the simulations. The boxes represent the interquartile range (IQR) which shows the middle of 50% of the values (lower end of the box represents the 25th percentile and upper end 75th percentile). Black whiskers outside the boxes represent the values outside the middle 50% and the tips represent the minimum and maximum values (excluding outliers). Black vertical lines and dashed lines represent the median values. Green crosses and dashed lines represent the mean values and the green whiskers around the mean values represent the error in mean calculations. The black diamonds represent the outliers in the data.

Similar articles

Cited by

References

    1. Achotegui‐Castells, A. , Llusiá, J. , Hódar, J. A. , & Peñuelas, J. (2013). Needle terpene concentrations and emissions of two coexisting subspecies of Scots pine attacked by the pine processionary moth (thaumetopoea pityocampa). Acta Physiologiae Plantarum, 35(10), 3047–3058. 10.1007/s11738-013-1337-3 - DOI
    1. Albrecht, B. A. (1989). Aerosols, cloud microphysics, and fractional cloudiness. Science, 245(4923), 1227–1230. 10.1126/science.245.4923.1227 - DOI - PubMed
    1. Baldwin, I. T. , Kessler, A. , & Halitschke, R. (2002). Volatile signaling in plant–plant–herbivore interactions: What is real? Current Opinion in Plant Biology, 5(4), 351–354. 10.1016/S1369-5266(02)00263-7 - DOI - PubMed
    1. Barsanti, K. C. , Carlton, A. G. , & Chung, S. H. (2013). Analyzing experimental data and model parameters: Implications for predictions of SOA using chemical transport models. Atmospheric Chemistry and Physics, 13(23), 12073–12088. 10.5194/acp-13-12073-2013 - DOI
    1. Blande, J. D. , Korjus, M. , & Holopainen, J. K. (2010). Foliar methyl salicylate emissions indicate prolonged aphid infestation on silver birch and black alder. Tree Physiology, 30(3), 404–416. 10.1093/treephys/tpp124 - DOI - PubMed

LinkOut - more resources