

Recognition of driver genes with potential prognostic implications in lung adenocarcinoma based on H3K79me2
- PMID: 36249560
- PMCID: PMC9556929
- DOI: 10.1016/j.csbj.2022.10.004
Recognition of driver genes with potential prognostic implications in lung adenocarcinoma based on H3K79me2
Abstract
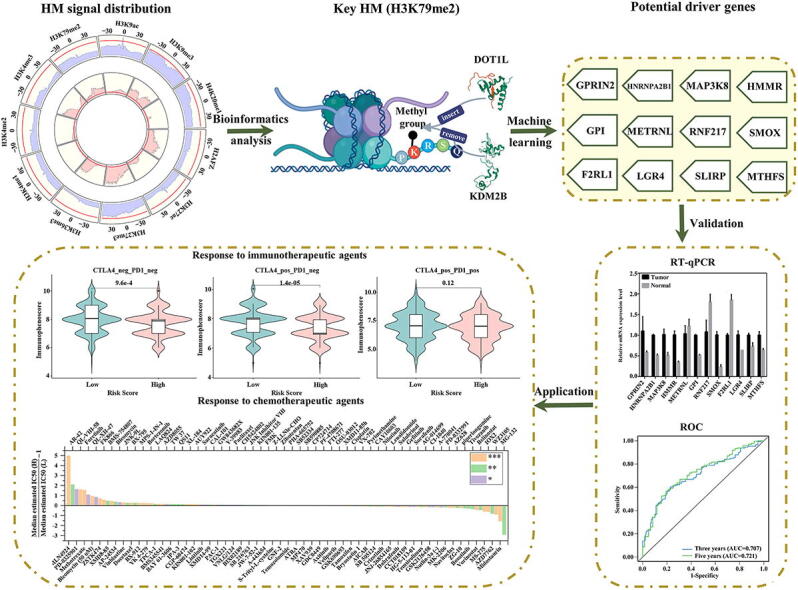
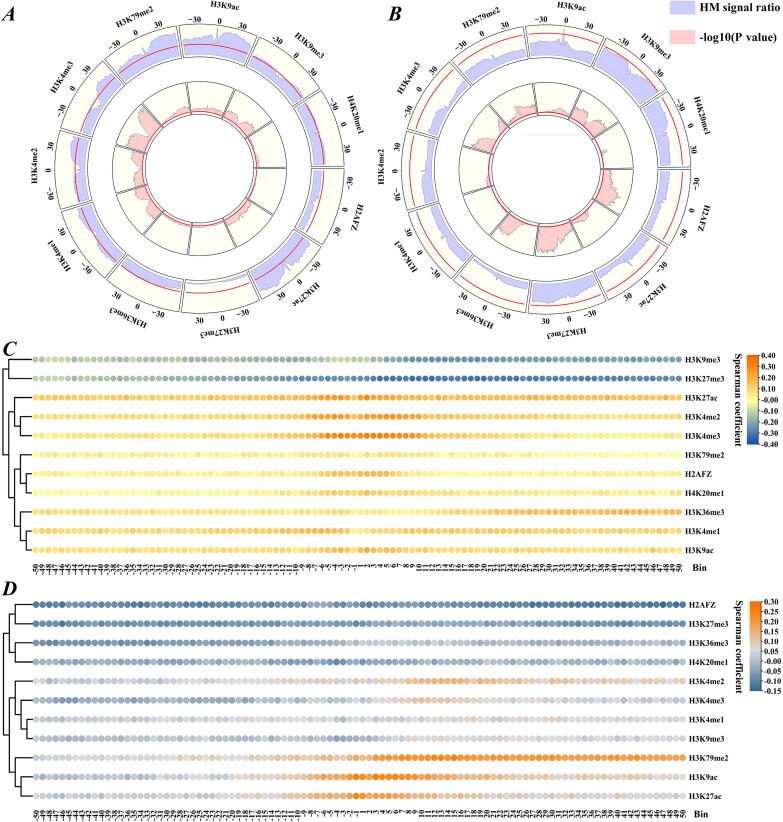
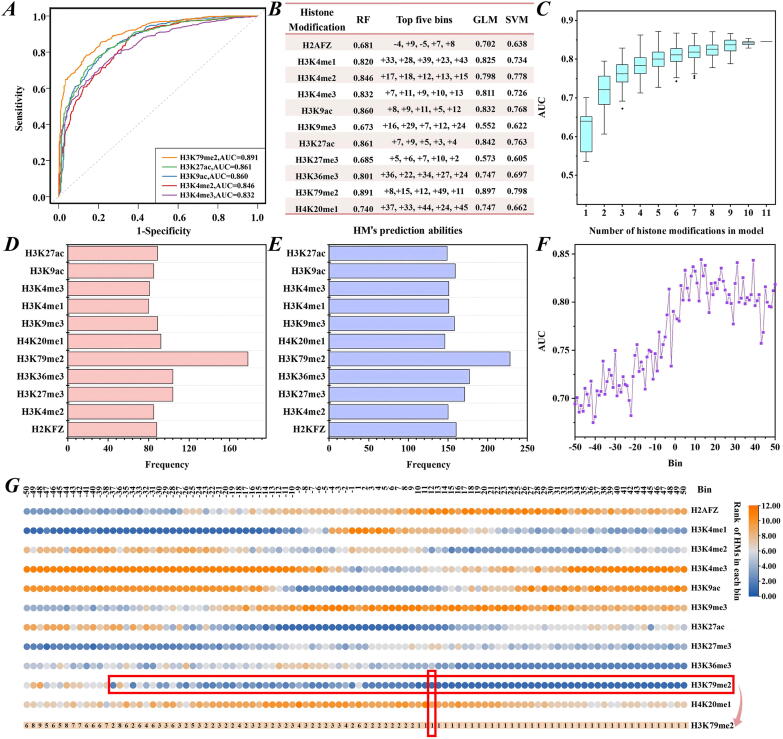
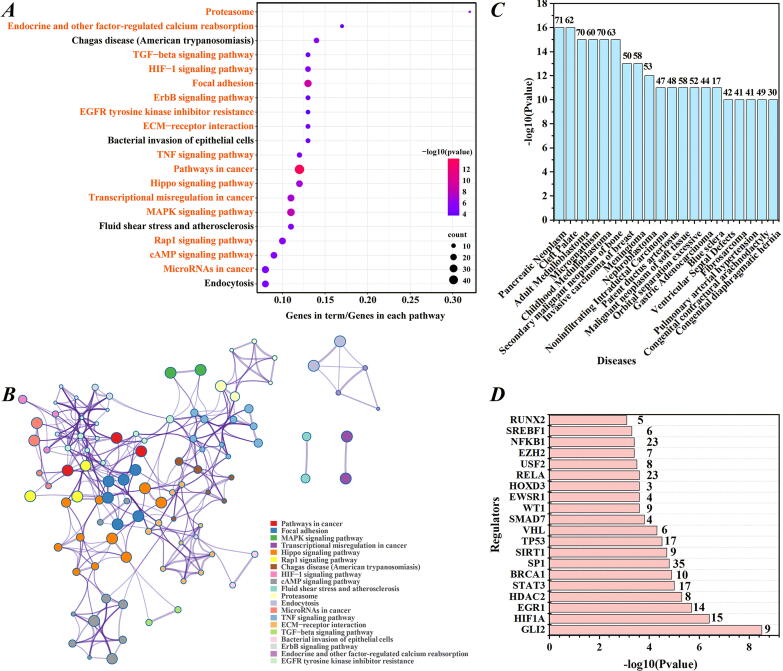
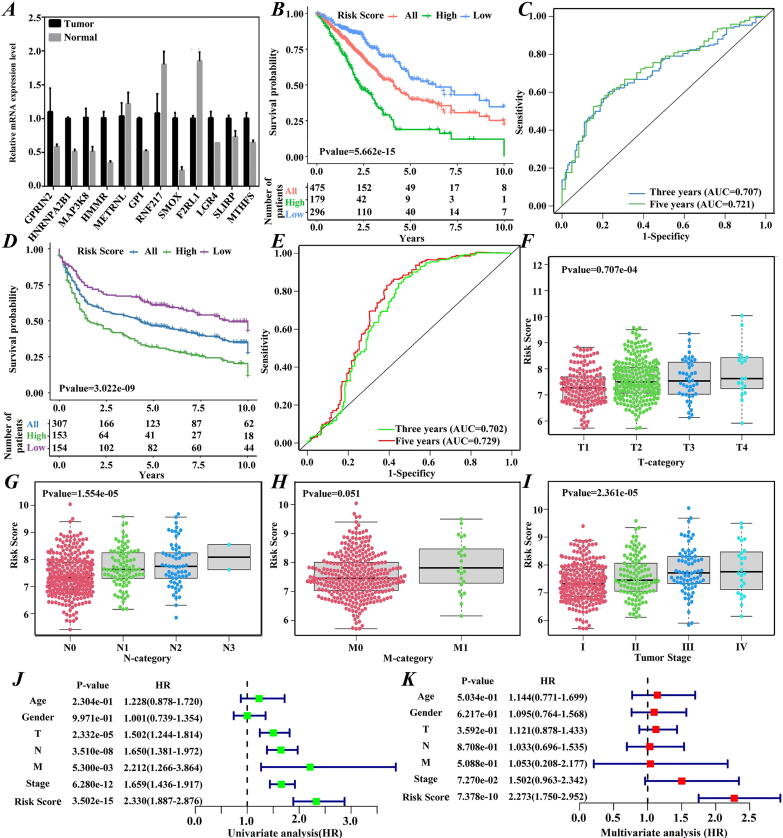
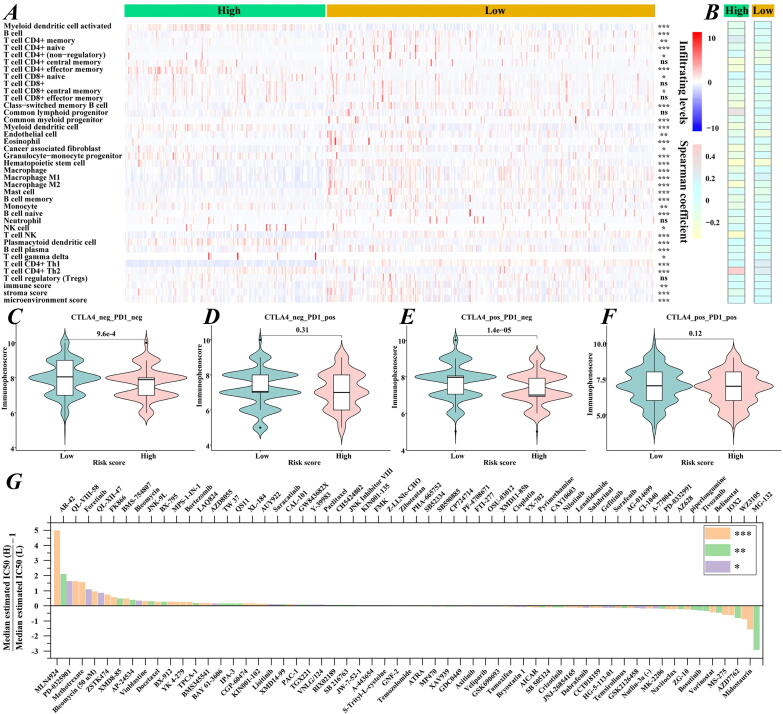
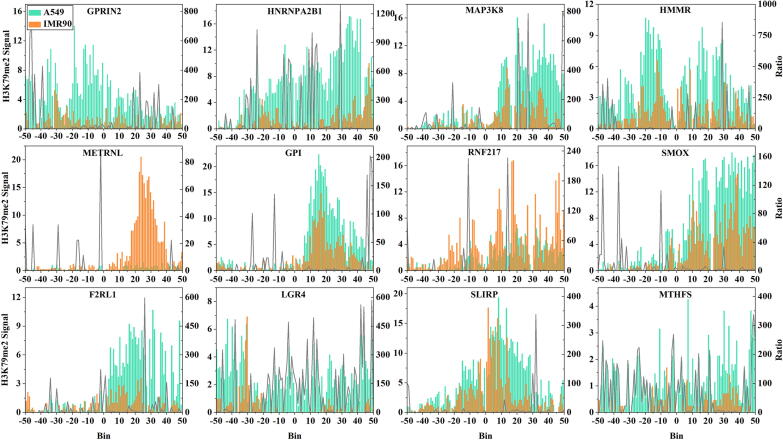
Lung adenocarcinoma is a malignancy with a low overall survival and a poor prognosis. Studies have shown that lung adenocarcinoma progression relates to locus-specific/global changes in histone modifications. To explore the relationship between histone modification and gene expression changes, we focused on 11 histone modifications and quantitatively analyzed their influences on gene expression. We found that, among the studied histone modifications, H3K79me2 displayed the greatest impact on gene expression regulation. Based on the Shannon entropy, 867 genes with differential H3K79me2 levels during tumorigenesis were identified. Enrichment analyses showed that these genes were involved in 16 common cancer pathways and 11 tumors and were target-regulated by trans-regulatory elements, such as Tp53 and WT1. Then, an open-source computational framework was presented (https://github.com/zlq-imu/Identification-of-potential-LUND-driver-genes). Twelve potential driver genes were extracted from the genes with differential H3K79me2 levels during tumorigenesis. The expression levels of these potential driver genes were significantly increased/decreased in tumor cells, as assayed by RT-qPCR. A risk score model comprising these driver genes was further constructed, and this model was strongly negatively associated with the overall survival of patients in different datasets. The proportional hazards assumption and outlier test indicated that this model could robustly distinguish patients with different survival rates. Immune analyses and responses to immunotherapeutic and chemotherapeutic agents showed that patients in the high and low-risk groups may have distinct tendencies for clinical selection. Finally, the regions with clear H3K79me2 signal changes on these driver genes were accurately identified. Our research may offer potential molecular biomarkers for lung adenocarcinoma treatment.
Keywords: Driver genes; Gene expression; H3K79me2; Lung adenocarcinoma.
© 2022 The Author(s).
Conflict of interest statement
The authors declare that they have no known competing financial interests or personal relationships that could have appeared to influence the work reported in this paper.
Figures
Similar articles
-
The risk model construction of the genes regulated by H3K36me3 and H3K79me2 in breast cancer.Biophys Rep. 2023 Feb 28;9(1):45-56. doi: 10.52601/bpr.2023.220022. Biophys Rep. 2023. PMID: 37426199 Free PMC article.
-
Mitotic accumulation of dimethylated lysine 79 of histone H3 is important for maintaining genome integrity during mitosis in human cells.Genetics. 2015 Feb;199(2):423-33. doi: 10.1534/genetics.114.172874. Epub 2014 Dec 22. Genetics. 2015. PMID: 25533199 Free PMC article.
-
Histone modification mapping in human brain reveals aberrant expression of histone H3 lysine 79 dimethylation in neural tube defects.Neurobiol Dis. 2013 Jun;54:404-13. doi: 10.1016/j.nbd.2013.01.014. Epub 2013 Jan 29. Neurobiol Dis. 2013. PMID: 23376398
-
The cancer driver genes IDH1/2, JARID1C/ KDM5C, and UTX/ KDM6A: crosstalk between histone demethylation and hypoxic reprogramming in cancer metabolism.Exp Mol Med. 2019 Jun 20;51(6):1-17. doi: 10.1038/s12276-019-0230-6. Exp Mol Med. 2019. PMID: 31221981 Free PMC article. Review.
-
Histone modifications in cancer biology and prognosis.Prog Drug Res. 2011;67:91-106. doi: 10.1007/978-3-7643-8989-5_5. Prog Drug Res. 2011. PMID: 21141726 Review.
Cited by
-
CancerMHL: the database of integrating key DNA methylation, histone modifications and lncRNAs in cancer.Database (Oxford). 2024 Apr 12;2024:baae029. doi: 10.1093/database/baae029. Database (Oxford). 2024. PMID: 38613826 Free PMC article.
-
The risk model construction of the genes regulated by H3K36me3 and H3K79me2 in breast cancer.Biophys Rep. 2023 Feb 28;9(1):45-56. doi: 10.52601/bpr.2023.220022. Biophys Rep. 2023. PMID: 37426199 Free PMC article.
References
-
- Qiu M.T., Xia W.J., Chen R., Wang S.W., Xu Y.T., et al. The circular RNA circPRKCI promotes tumor growth in lung adenocarcinoma. Cancer Res. 2018;78(1):2839–2851. - PubMed
-
- Chen W.Q., Zheng R.S., Baade P.D., Zhang S.W., Zeng H.M., et al. Cancer statistics in China, 2015. Ca-Cancer J Clin. 2016;66:115–132. - PubMed
-
- Wu J., Li L., Zhang H.B., Zhao Y.Q., Zhang H.H., et al. A risk model developed based on tumor microenvironment predicts overall survival and associates with tumor immunity of patients with lung adenocarcinoma. Oncogene. 2021;40:4413–4424. - PubMed
-
- Wang Y.Y., Zheng D.F., Chen T.X., Zhang J., Yao F., et al. Survival prediction and adjuvant chemotherapy based on tumor marker for stage IB lung adenocarcinoma. Ann Thorac Surg. 2020;109:927–937. - PubMed
LinkOut - more resources
Full Text Sources
Research Materials
Miscellaneous