. 2022 Sep 28:20:5466-5476.
doi: 10.1016/j.csbj.2022.09.040. eCollection 2022.

Examining the diversity of structural motifs in fungal glycome

Affiliations

Examining the diversity of structural motifs in fungal glycome

Philip V Toukach et al. Comput Struct Biotechnol J. .

Abstract

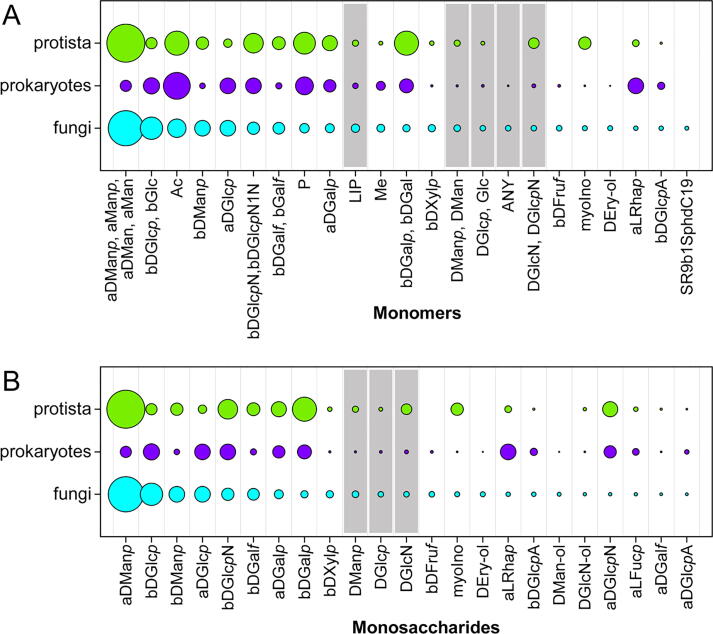
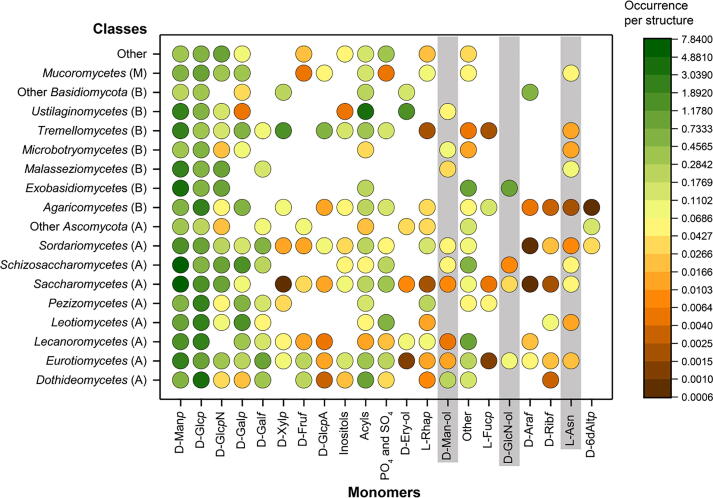
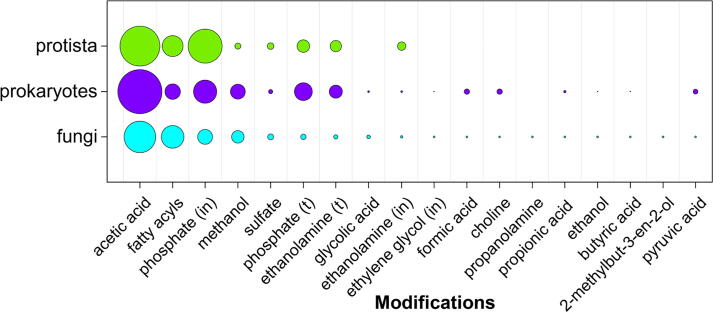
In this paper, we present the results of a systematic statistical analysis of the fungal glycome in comparison with the prokaryotic and protistal glycomes as described in the scientific literature and presented in the Carbohydrate Structure Database (CSDB). The monomeric and dimeric compositions of glycans, their non-carbohydrate modifications, glycosidic linkages, sizes of structures, branching degree and net charge are assessed. The obtained information can help elucidating carbohydrate molecular markers for various fungal classes which, in its turn, can be demanded for the development of diagnostic tools and carbohydrate-based vaccines against pathogenic fungi. It can also be useful for revealing specific glycosyltransferases active in a particular fungal species.

Keywords: Bacteria; CSDB; Carbohydrate; Diversity; Fungi; Glycan; Glycome; Protista.


Conflict of interest statement

The authors declare that they have no known competing financial interests or personal relationships that could have appeared to influence the work reported in this paper.

Figures

None
Graphical abstract
Fig. 1
Fig. 1
Absolute abundance of fungal carbohydrate structures in CSDB per taxonomic class. The affiliation of the classes with the corresponding phyla is color-coded. See Supplementary Table S1b for the source data.
Fig. 2
Fig. 2
Distribution of all monomeric residues (A) and monosaccharides/alditols (B) in glycans from fungi, bacteria and protista (including unicellular algae). Only the residues found in more than 200 (A) or 100 (B) fungal structures are shown. Underdetermined entities, for which some configurations or the exact residue identity are not reported, are highlighted in grey. The bubble area is an average occurrence of a given residue per structure. See Supplementary Table S2a and S2b for the source data.
Fig. 3
Fig. 3
Distribution of monomeric residues in fungal classes. The color of the bubbles corresponds to the occurrence of a given residue per structure in a given taxonomic class (see the logarithmic color scale on the right). Probable analytical or notation artifacts are highlighted in grey. Phyla for the classes are indicated in parentheses: (A), Ascomycota, (B), Basidiomycota, and (M), Mucoromycota. See Supplementary Table S3 for the source data.
Fig. 4
Fig. 4
Distribution of monomeric residues unique for fungi among all biota present in CSDB, per class. The color of the bubbles corresponds to the occurrence of a given residue per structure in a given taxonomic class (see the logarithmic color scale on the right). Phyla for the classes are indicated in parentheses: (A), Ascomycota, (B), Basidiomycota, and (M), Mucoromycota. 9-methyl-4,8-sphingadienine-C18 = (2S,3R,4E,8E)-9-methyl-4,8-sphingadienine-C18; nonamethyltrihydroxyicosatrienoic acid = 2,4,6,8,10,12,14,16,18-nonamethyl-5,9,13-trihydroxy-2E,6E,10E-icosatrienoic acid. See Supplementary Table S4 for the source data.
Fig. 5
Fig. 5
Distribution of monosaccharides unique for fungi. The height of the bars corresponds to the occurrence of a given monosaccharide per structure in a given taxonomic class and, cumulatively, in fungi. Phyla for the classes are indicated in parentheses: (A), Ascomycota, (B), Basidiomycota, and (M), Mucoromycota. The monosaccharides are sorted by total absolute abundance in fungal glycans (from 43 to 3 instances). See Supplementary Table S5 for the source data.
Fig. 6
Fig. 6
Distribution of disaccharides unique for fungi. The height of the bars corresponds to the occurrence of a given disaccharide per structure in a given taxonomic class, and cumulatively, in fungi (a logarithmic scale is used for clarity). Phyla for the classes are indicated in parentheses: (A), Ascomycota, (B), Basidiomycota, and (M), Mucoromycota. The disaccharides are sorted by total absolute abundance in fungal glycans (from 299 to 8 instances). See Supplementary Table S6 for the source data.
Fig. 7
Fig. 7
Distribution of non-carbohydrate modifications in glycans from fungi, prokaryotes, and protista. Only the modification with greater than 10 occurrences in the fungal glycans are considered (including the “fatty acyls” superclass containing aliphatic acids, each with greater than 10 occurrences in fungi). (in) stands for inline location in a saccharide backbone; (t) stands for terminal location. The bubble area is an average occurrence of residues per structure. See Supplementary Table S7 for the source data.
Fig. 8
Fig. 8
Distribution of glycosidic linkages in fungal carbohydrates and derivatives. The area of the circles corresponds to the occurrence of a given linkage per structure. The anomericity and position of the bond is color-coded. “Exo” means all positions above 4, assuming a linkage to an exocyclic tail. The acceptors d-Man-ol and d-GlcN-ol are probably analytical artifacts. Amino sugars include both N-acetylated and non-N-acetylated occurrences. The circle centers are slightly shifted to avoid overlaps. See Supplementary Table S8 for the source data.
Fig. 9
Fig. 9
Distribution of glycosidic linkages in bacterial and archaean carbohydrates and derivatives. The area of the circles corresponds to the occurrence of a given linkage per structure. The anomericity and position of the bond is color-coded. “Exo” means all positions above 4, assuming a linkage to an exocyclic tail. The acceptors d-Man-ol and d-GlcN-ol are probably analytical artifacts. Amino sugars include both N-acetylated and non-N-acetylated occurrences. ?-Gro (acceptor) stands for a residue of glycerol with an unknown absolute configuration (or unknown substitution position (1 or 3) in the case of d-glycerol); the data for d-Gro are not cumulated in this row (it occupies the 25th row in the sorted acceptor list). The circle centers are slightly shifted to avoid overlaps. See Supplementary Table S9 for the source data (the larger figure with 15 donor/acceptor residues is also provided).
Fig. 10
Fig. 10
Distribution of glycosidic linkages in protistal carbohydrates and derivatives. The area of the circles corresponds to the occurrence of a given linkage per structure. The anomericity and position of the bond is color-coded. “Exo” means all positions above 4, assuming a linkage to an exocyclic tail. Amino sugars include both N-acetylated and non-N-acetylated occurrencies. The acceptor d-GlcN-ol is probably an analytical artifact. The circle centers are slightly shifted to avoid overlaps. See Supplementary Table S10 for the source data.
Fig. 11
Fig. 11
Distribution of structure sizes. The x-axis shows the number of residues per structure. Oligomers and regular repeating units are shown separately in the top and bottom plots, respectively (as oligo and poly). Logarithmic scales are used for better presentation. All residues are counted, including monovalent modifications. See Supplementary Table S11 for the source data.
Fig. 12
Fig. 12
Distribution of structure sizes. The x-axis shows the number of monosaccharides and alditols per structure. Oligomers and repeating units are shown separately in the top and bottom plots, respectively (as oligo and poly). Logarithmic scales are used for better presentation. See Supplementary Table S12 for the source data.
Fig. 13
Fig. 13
Distribution of antennarity (branching degree) in carbohydrate structures of fungi, prokaryotes and protista (including unicellular algae). See Supplementary Table S13 for the source data.
Fig. 14
Fig. 14
Net charge distribution in carbohydrate structures of fungi (A), prokaryotes (B) and protista (including unicellular algae) (C). Every bar corresponds to a range of net charges with a width of 0.2, including the lower (left) limit and excluding the upper (right) limit. Diamonds indicate the part of neutral structures in a given domain. See Supplementary Table S14 for the source data.

Similar articles

References

    1. Naranjo-Ortiz M.A., Gabaldón T. Biol Rev Cambridge Philos Soc. 2019;94:2101. - PMC - PubMed
    1. Lücking R., Aime M.C., Robbertse B., Miller A.N., Aoki T., Ariyawansa H.A., et al. Nat Microbiol. 2021;6:540. - PMC - PubMed
    1. Newbound M., McCarthy M.A., Lebel T. Landscape Urban Plann. 2010;96:138.
    1. Lücking R., Aime M.C., Robbertse B., Miller A.N., Ariyawansa H.A., Aoki T., et al. IMA Fungus. 2020;11:14. - PMC - PubMed
    1. Latgé J.-P., Beauvais A. Curr Opin Microbiol. 2014;20:111. - PubMed

LinkOut - more resources