

The Status of Newborn Hearing Screening in Japan: Past, Present, and the Future
- PMID: 36249620
- PMCID: PMC9549257
- DOI: 10.7759/cureus.28858
The Status of Newborn Hearing Screening in Japan: Past, Present, and the Future
Abstract
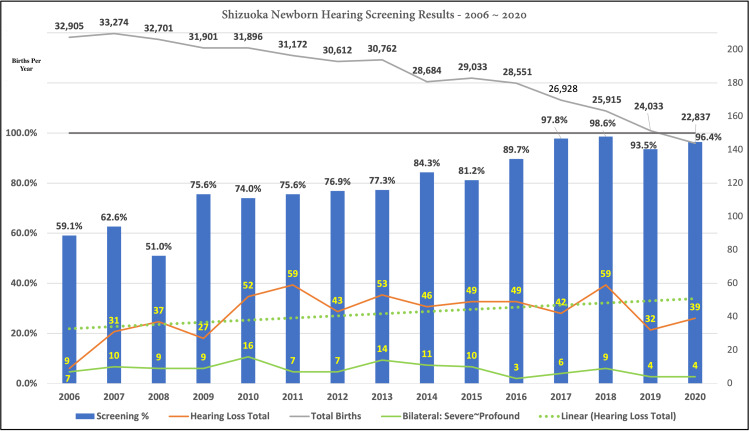
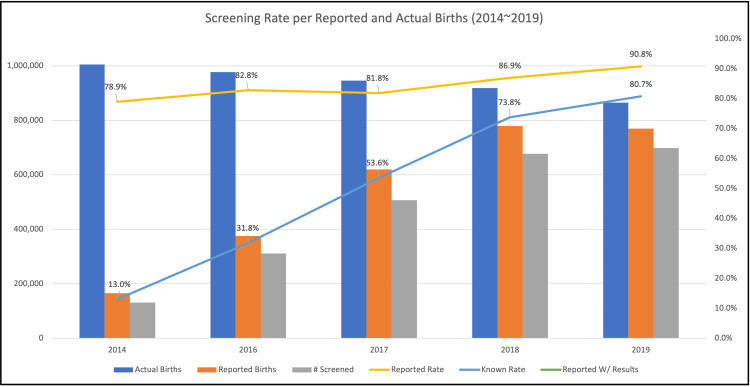
This review article summarizes the chronological history of newborn hearing screening (NHS) implementation in Japan. Beginning with experimental pilot programs implemented in the early 2000s, efforts have been made to establish NHS throughout the country. The results of and responses to these pilot programs are introduced, analyzed, and discussed. Data reported annually, from 2014, by the Japanese Ministry of Health, Labour, and Welfare (MHLW), introduce the overall progress achieved in NHS throughout the country. The most recently published MHLW report, from 2019, cites a screening rate of 90.8%. Analysis of the data from these reports, however, suggests that while clear progress has been achieved, "known-screening" rates are lower than the "surveyed" rates cited. Published NHS program data from three pilot programs as well as publicly available data from one prefecture and unpublished data from an additional prefecture are analyzed and compared to the national figures. Hearing impairment occurrence frequency for newborns in Japan, calculated from two large data sets, reveals an average occurrence rate of 0.14% or one per every 1,400 births. Progress is observed in terms of an expanding coverage rate for NHS in Japan. Work remains, however, to achieve a screening rate of 95% or higher. Additionally, a protocol for ensuring quality standards for NHS is recommended. Data collected and analyzed for this review may inform planned efforts to introduce more efficient digitized NHS program management systems in Japan as well as in other countries where NHS program improvement efforts continue. Such systems may serve to enable effective monitoring of pre-determined screening program protocols and thus may make a shift from a 1-3-6 to 1-2-3 protocol more feasible.
Keywords: early intervention; follow-up testing; hearing impairment; newborn hearing screening; screening; tracking.
Copyright © 2022, Hollowell et al.
Conflict of interest statement
The authors have declared that no competing interests exist.
Figures
References
-
- World Health Organization: World Health Organization Forty-Eighth World Health Assembly. [ May; 1995 ]. 1995. https://apps.who.int/iris/bitstream/handle/10665/178296/WHA48_1995-REC-1... https://apps.who.int/iris/bitstream/handle/10665/178296/WHA48_1995-REC-1...
-
- World Health Organization: Future Programme Developments For Prevention of Deafness And Hearing Impairment. [ Nov; 2000 ]. 2000. https://apps.who.int/iris/bitstream/handle/10665/67888/WHO_PDH_02.1.pdf?... https://apps.who.int/iris/bitstream/handle/10665/67888/WHO_PDH_02.1.pdf?...
-
- Language of early- and later-identified children with hearing loss. Yoshinaga-Itano C, Sedey AL, Coulter DK, Mehl AL. Pediatrics. 1998;102:1161–1171. - PubMed
-
- Universal screening for infant hearing impairment: simple, beneficial, and presently justified. White KR, Maxon AB. Int J Pediatric Otorhinolaryngol. 1995;32:201–210. - PubMed
-
- The newborn with hearing loss: detection in the nursery. Finitzo T, Albright K, O'Neal J. Pediatrics. 1998;102:1452–1460. - PubMed
Publication types
LinkOut - more resources
Full Text Sources
Miscellaneous