. 2022 Jan 30;2(2):100121.
doi: 10.1016/j.xops.2022.100121. eCollection 2022 Jun.

Improved Uveal Melanoma Copy Number Subtypes Including an Ultra-High-Risk Group

Affiliations

Improved Uveal Melanoma Copy Number Subtypes Including an Ultra-High-Risk Group

Emilie Lalonde et al. Ophthalmol Sci. .

Abstract

Purpose: To evaluate the clinical relevance of low-frequency copy number aberrations (CNAs) in uveal melanoma (UM) and to discern residual genomic and clinical heterogeneity within established molecular subtypes based on genome-wide CNA profiling of 921 primary tumors.

Design: Retrospective single-center case series.

Participants: Patients with primary UM referred for genetic testing between 2008 and 2016 (n = 921). The Cancer Genome Atlas cohort with clinical outcome data available (n = 70) was used to validate findings.

Methods: Genome-wide CNAs were generated for primary tumors from 921 patients and for 19 metastatic UM (mUM) in the liver. Of the 921 patients, metastatic outcome was known for 678 patients with a median time to metastasis of 4.5 years. The primary tumors were processed on the Affymetrix arrays SNP-5.0 (n = 140), SNP-6.0 (n = 359), or CytoScanHD (n = 422), and the metastatic tumors on the CytoScanHD array (n = 19). Recurrent CNAs were identified, and the prognostic effect of individual CNAs and multiple CNA clustering strategies, including more specific molecular subgroups with rare CNAs, were evaluated.

Main outcome measures: CNA recurrence, and effect of CNAs and derived molecular subtypes on metastatic-free survival.

Results: Genomic profiling revealed CNAs associated with risk of metastasis and demonstrated a strong association between chromosomal instability and patient prognosis. Using standard prognostic CNAs, 6 clusters were detected, and inclusion of chromosome 16q deletion revealed an additional cluster. Of these 7 genomic clusters, 5 patient groups showed distinct rates of metastasis, indicating that different genomic patterns can have similar patient outcomes. A small group of patients with a significantly higher rate of metastasis was characterized by monosomy 3, 8q amplification, and deletion of 1p or 16q. Although this ultra-high-risk group accounts for only 7% of this cohort, 88% demonstrated metastasis within 4 years, compared with 45% in the second-highest risk group.

Conclusions: These results suggest that 1p and 16q deletion should be incorporated in clinical assays to assess prognosis at diagnosis and to guide enrollment in clinical trials for adjuvant therapies.

Keywords: 16q deletion; CNA, copy number aberration; Copy number profile; FNAB, fine-needle aspiration biopsy; HR, hazard ratio; Molecular risk groups; Prognosis; TCGA, The Cancer Genome Atlas; UM, uveal melanoma; Uveal melanoma; mUM, metastatic uveal melanoma.


Figures

Figure 1
Figure 1
Genome-wide copy number alteration profile of 921 primary uveal melanoma tumors. A, Copy number profile in each primary tumor. Each column represents a gene sorted according to chromosomal location (x-axis), and each row represents a patient. Regions in blue and red indicate copy number deletions and gains, respectively, in the corresponding gene and patient combination. Pertinent clinical variables are shown on the right. Patients are clustered according to schema shown in Figure 3B, based on known uveal melanoma-associated copy number aberrations (CNAs; deletion 1p, monosomy 3, gain of 6p, loss of 6q, loss of 8p, gain of 8q) and 16q. B, Graph showing the frequency of genome-wide CNAs across the cohort. C, Bar graph showing the percent of genome altered (PGA) distribution in the cohort. The median (3.45%) is depicted with the red line. D, Prognostic impact of PGA. Patients are grouped into 5 equally sized bins with PGA thresholds of 0% to 0.0047% (group 1), 0.0047% to 1.98% (group 2), 1.98% to 6.92% (group 3), 6.92% to 12.7% (group 4), and 12.7% to 40.9% (group 5). The log-rank P value is shown.
Figure 2
Figure 2
Prognosis of individual copy number aberrations (CNAs). A, Forest plot demonstrating the significant CNAs detected in the cohort. The CNAs with Benjamini-Hochberg false-discovery rate-corrected P values of < 0.05 are shown. Chromosome 6p is also shown, although it was not found to be significant in this cohort. B, Kaplan-Meier curves for metastasis-free survival based on the 4 most prognostic CNAs, deletion 16q, gain of chr4p, gain or amplification of chr8q, and monosomy 3. The patient groups refer to copy number status (0, disomy; –1, loss; 1, gain; and 2, amplification). The log-rank P value is shown.
Figure 3
Figure 3
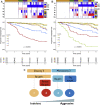
Recurrent copy number aberrations (CNAs) defining molecular subtypes. A, Patient grouping and prognosis based on known uveal melanoma (UM)-associated CNAs, namely deletion 1p, monosomy 3, gain of 6p, loss of 6q, loss of 8p, and gain of 8q. B, Patient grouping and prognosis based on known UM-associated CNAs (see (A)) and deletion of 16q. C, Previously published The Cancer Genome Atlas CNA-based classification. Figure adapted based on manuscript by Robertson et al.D, Proposed Genetic Diagnostic Laboratory CNA-based risk group classification scheme for prognostication of UM. E, Kaplan-Meier curve for metastasis-free survival based on the Genetic Diagnostic Laboratory risk group classification scheme shown in (D). The log-rank P value is shown. amplif. = amplification.
Figure 3
Figure 3
Recurrent copy number aberrations (CNAs) defining molecular subtypes. A, Patient grouping and prognosis based on known uveal melanoma (UM)-associated CNAs, namely deletion 1p, monosomy 3, gain of 6p, loss of 6q, loss of 8p, and gain of 8q. B, Patient grouping and prognosis based on known UM-associated CNAs (see (A)) and deletion of 16q. C, Previously published The Cancer Genome Atlas CNA-based classification. Figure adapted based on manuscript by Robertson et al.D, Proposed Genetic Diagnostic Laboratory CNA-based risk group classification scheme for prognostication of UM. E, Kaplan-Meier curve for metastasis-free survival based on the Genetic Diagnostic Laboratory risk group classification scheme shown in (D). The log-rank P value is shown. amplif. = amplification.
Figure 4
Figure 4
Copy number profile of metastatic versus primary uveal melanoma tumors. All samples were processed on the Affymetrix CytoScan HD platform. A, Frequency of genome-wide copy number aberrations (CNAs) in 19 liver metastases. B, Frequency of genome-wide CNAs in 422 primary tumors. C, Frequency of genome-wide CNAs in 70 primary tumors of patients who later demonstrated metastasis. D, Frequency of genome-wide CNAs in 121 primary tumors of patients who did not demonstrate metastasis 3 years after diagnosis.

References

    1. Nichols E.E., Richmond A., Daniels A.B. Tumor characteristics, genetics, management, and the risk of metastasis in uveal melanoma. Semin Ophthalmol. 2016;31:304–309. - PMC - PubMed
    1. Bastian B.C. The molecular pathology of melanoma: an integrated taxonomy of melanocytic neoplasia. Annu Rev Pathol. 2014;9:239–271. - PMC - PubMed
    1. Kujala E., Mäkitie T., Kivelä T. Very long-term prognosis of patients with malignant uveal melanoma. Invest Ophthalmol Vis Sci. 2003;44:4651–4659. - PubMed
    1. Kath R., Hayungs J., Bornfeld N., et al. Prognosis and treatment of disseminated uveal melanoma. Cancer. 1993;72:2219–2223. - PubMed
    1. Shields C.L., Ganguly A., Bianciotto C.G., et al. Prognosis of uveal melanoma in 500 cases using genetic testing of fine-needle aspiration biopsy specimens. Ophthalmology. 2011;118:396–401. - PubMed

LinkOut - more resources