. 2022 Sep 29:9:1016090.
doi: 10.3389/fmolb.2022.1016090. eCollection 2022.

GPI-anchored glutathione S-transferase as marker allows affinity sorting of transfection-positive cells

Affiliations

GPI-anchored glutathione S-transferase as marker allows affinity sorting of transfection-positive cells

Shumin Ma et al. Front Mol Biosci. .

Abstract

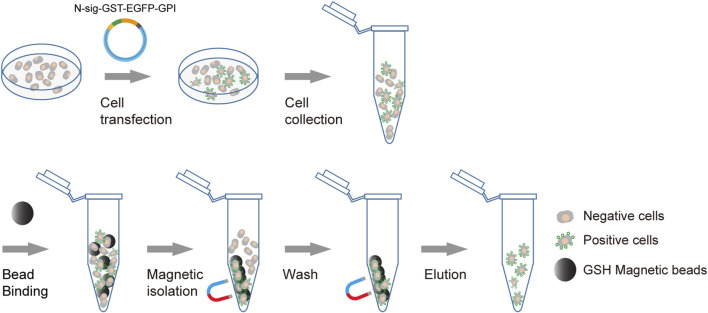
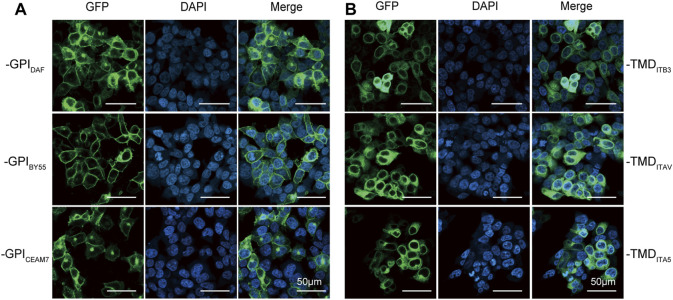
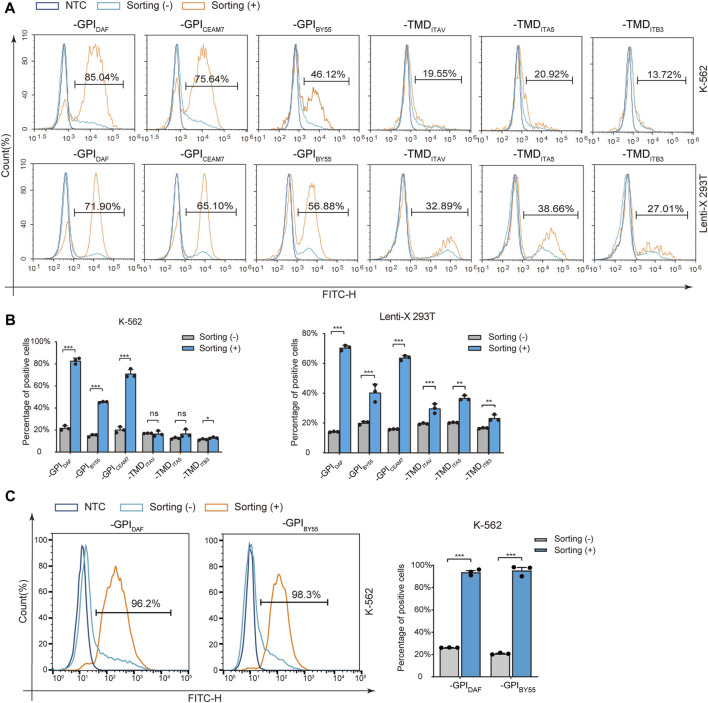
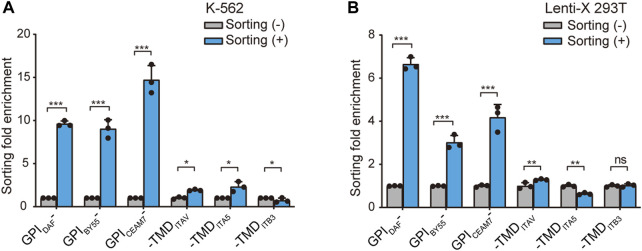
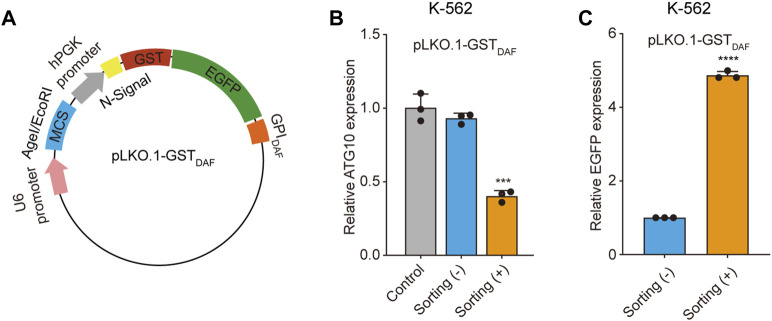
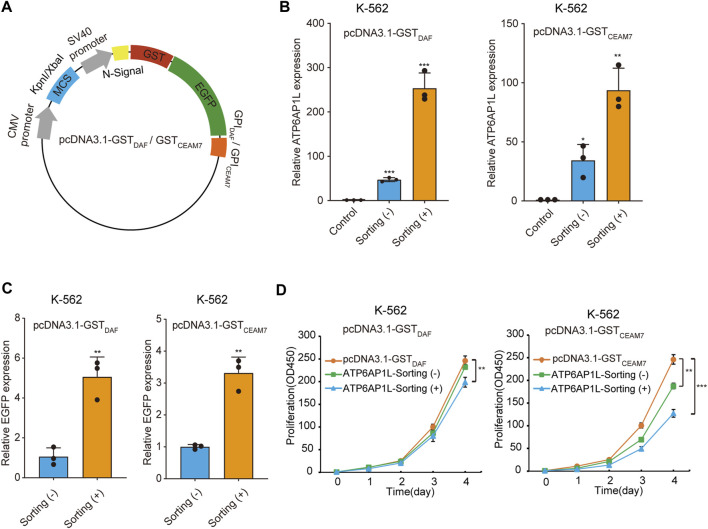
Cell transfection efficiency is still a limiting factor in gene function research. A method that allows isolation and enrichment of the transfection-positive cells is an effective solution. Here, we report a transfection-positive cell sorting system that utilizes GPI-anchored GST (Glutathione S-transferase) as a plasmid marker. The Glutathione S-transferase fusion protein will be expressed and displayed on the cell surface through GPI anchor, and hence permits the positive cells to be isolated using Glutathione (GSH) Magnetic Beads. We prove that the system works efficiently in both the adherent Lenti-X 293T cells and the suspension K-562 cells. The affinity cell sorting procedure efficiently enriched positive cells from 20% to 98% in K-562 cells. The applications in gene knockdown and overexpression experiments in K-562 cells dramatically enhanced the extent of gene alteration, with the gene knockdown efficiency increasing from 7% to 60% and the gene overexpression level rising from 47 to 253 times. This Glutathione S-transferase affinity transfection-positive cell sorting method is simple and fast to operate, large-instrument free, low cost, and hence possesses great potential in gene function study in vitro.

Keywords: GPI; cell sorting; cell transfection; glutathione; glutathione S-transferase.


Conflict of interest statement

The authors declare that the research was conducted in the absence of any commercial or financial relationships that could be construed as a potential conflict of interest.

Figures

FIGURE 1
FIGURE 1
Schematic diagram of affinity cell sorting. The plasmids encoding the membrane-anchored GST-EGFP tag will be transfected into target cells. The positive cells will express the GST-EGFP tag on the cell surface and hence can be enriched through affinity cell sorting using GSH magnetic beads. The separation of the bead/cell complex can be performed by staying on a magnetic stand or by free settling. The transfection-positive cells are highlighted with green markers on the cell surface.
FIGURE 2
FIGURE 2
Membrane translocating of six GST-EGFP variants. Confocal fluorescence microscopy analysis of Lenti-X 293T cells transfected with plasmids encoding the GPI-type variants pEGFP-GST-GPIDAF, pEGFP-GST-GPIBY55, and pEGFP-GST-GPICEAM7 (A) and TMD-type variants pEGFP-GST-TMDITB3, pEGFP-GST-TMDITA5 and pEGFP-GST-TMDITAV (B). The nucleus was stained with DAPI (4′,6-diamidino-2-phenylindole). Cells were observed at ×200 magnification, and the scale bar represents 50 µm.
FIGURE 3
FIGURE 3
Positive-cell enrichment fold assay with Flow cytometry. (A) Representative flow cytometry histograms of K-562 and Lenti-X 293T cells transfected with six sorting tag plasmids, with or without cell sorting. The dark blue layer represents NTC cells without transfection, and the light blue layer and the orange layer represent transfected cells without (−) or with cell sorting (+). The value in the region gate represents the percentage of positive cells in the enriched cells. (B) The bar chart shows the positive cell percentage value from the above flow cytometry analysis. (C) Flow cytometry analysis of K-562 cells transfected with plasmids expressing GST-EGFP-GPIDAF and GST-EGFP-GPIBY55 correspondingly and enriched through affinity cell sorting of free settling strategy. The layers represent cells without sorting (-) (light blue), sorted (+) (orange), and negative control (NTC, dark blue). The bar chart on the right is the quantitative positive percentage value from the left flow cytometry analysis. Values are from three biological replicates. Means ± SD, ns stands for no significance, *p < 0.05, **p < 0.01, ***p < 0.001, two-tailed Student’s t-test.
FIGURE 4
FIGURE 4
Positive-cell enrichment fold assay through GST RNA level. The bar chart shows the cell sorting fold enrichment of the six sorting tags in K-562 (A) and Lenti-X 293T cells (B), determined by RT-qPCR analysis of GST RNA expression level. The affinity cell sorting was performed 30 h post-transfection. RNA was extracted, and the GST mRNA level relative to β-actin was determined. Values are from three biological replicates. Means ± SD, *p < 0.05, **p < 0.01, ***p < 0.001, two-tailed Student’s t-test.
FIGURE 5
FIGURE 5
Sorted cells exhibit increased shRNA knockdown efficiency. (A) Schematic diagram of the plasmid encoding the GST-EGFP-GPIDAF sorting tag. (B) The bar chart shows the relative ATG10 gene expression level in K-562 cells transfected with the blank pLKO.1-GSTDAF vector (control), or vector expressing ATG10 shRNA, with or without cell sorting. (C)The relative EGFP expression level in the above K-562 cells as determined by RT-qPCR analysis. The EGFP expression level was normalized with β-actin level. Values are three technical replicates. Means ± SD, *p < 0.05, **p < 0.01, ***p < 0.001, two-tailed Student’s t-test.
FIGURE 6
FIGURE 6
Sorted cells allow dramatically increased ectopic gene expression. (A) Schematic diagram of plasmids expressing GST-EGFP-GPIDAF or GST-EGFP-GPICEAM7 sorting tag. (B) The bar chart represents the ATPAP1L mRNA expression level in K-562 cells transfected with the blank vector (control) or the corresponding overexpression plasmid, determined by RT-qPCR. (C) The relative EGFP expression level in the above K-562 cells as determined by RT-qPCR analysis. The EGFP expression level was normalized with the β-actin level. (D) CCK-8 cell proliferation assay of K-562 cells transfected with ATP6AP1L expression plasmid, with or without affinity cell sorting. Cells transfected with the blank pcDNA3.1-GSTDAF or pcDNA3.1-GSTCEAM7 plasmid were used as the negative control. Values are from three biological replicate wells. Means ± SD, *p < 0.05, **p < 0.01, ***p < 0.001, two-tailed Student’s t-test.

Similar articles

Cited by

References

    1. Arnold L. W., Lannigan J. (2010). Practical issues in high-speed cell sorting. Curr. Protoc. Cytom. Chapter 1, Unit 1 24 1–30. 10.1002/0471142956.cy0124s51 - DOI - PubMed
    1. Bernard F., Jaleco S., Dardalhon V., Steinberg M., Yssel H., Noraz N., et al. (2002). Ex vivo isolation protocols differentially affect the phenotype of human CD4+ T cells. J. Immunol. Methods 271, 99–106. 10.1016/s0022-1759(02)00412-x - DOI - PubMed
    1. Chen R., Greene E. L., Collinsworth G., Grewal J. S., Houghton O., Zeng H., et al. (1999). Enrichment of transiently transfected mesangial cells by cell sorting after cotransfection with GFP. Am. J. Physiol. 276, F777–F785. 10.1152/ajprenal.1999.276.5.F777 - DOI - PubMed
    1. Dainiak M. B., Kumar A., Galaev I. Y., Mattiasson B. (2007). Methods in cell separations. Adv. Biochem. Eng. Biotechnol. 106, 1–18. 10.1007/10_2007_069 - DOI - PubMed
    1. Du P., Li B., Liu X., Yang L., Ren N., Li Y., et al. (2022). Enhanced Taq variant enables efficient genome editing testing and mutation detection. CRISPR J. 5, 131–145. 10.1089/crispr.2021.0105 - DOI - PubMed