

Immunological imprint on peripheral blood in kidney transplant recipients after two doses of SARS-CoV-2 mRNA vaccination in Japan
- PMID: 36250073
- PMCID: PMC9553995
- DOI: 10.3389/fmed.2022.999374
Immunological imprint on peripheral blood in kidney transplant recipients after two doses of SARS-CoV-2 mRNA vaccination in Japan
Abstract
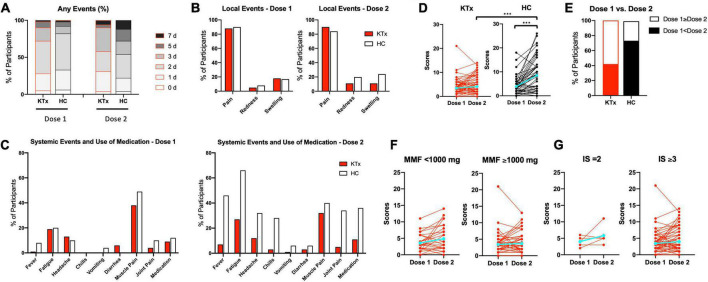
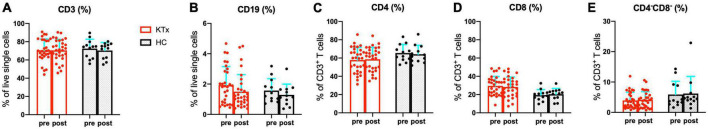
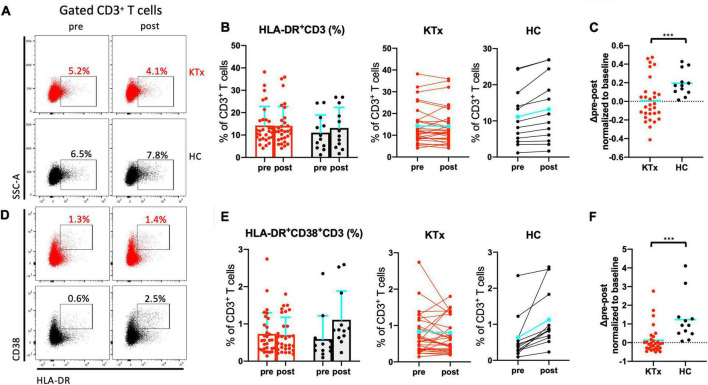
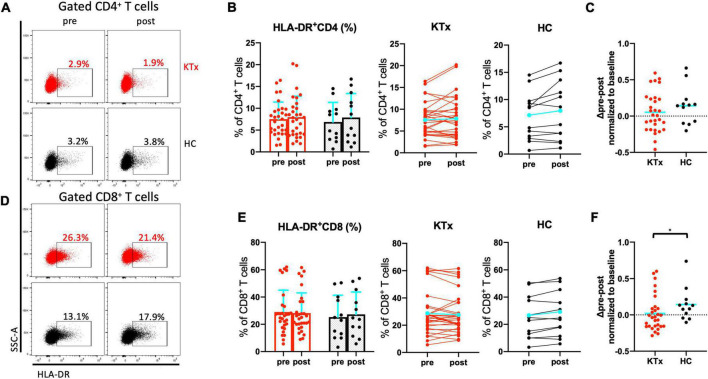
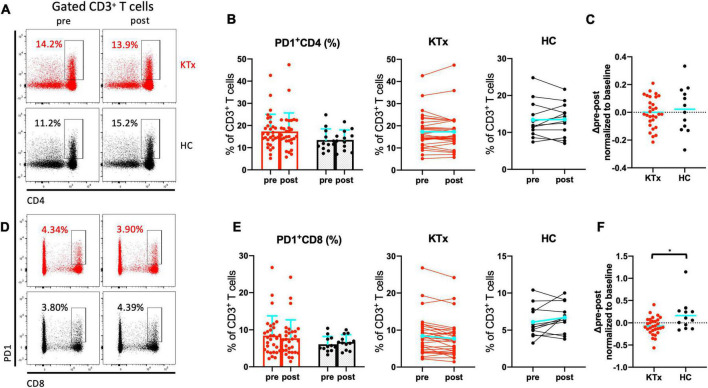
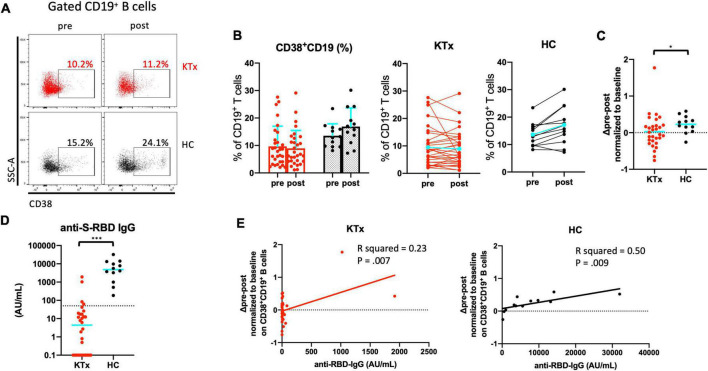
The immunological imprint after two doses of severe acute respiratory syndrome-coronavirus 2 (SARS-CoV-2) mRNA vaccination for patients after kidney transplantation (KTx) remain unclear. This study included KTx recipients and volunteer healthy controls (HCs) who received two doses of SARS-CoV-2 mRNA vaccine (Pfizer BioNTech) from January 2021 to December 2021. We analyzed safety within 21 days after each vaccination dose and compared the immune response in peripheral blood mononuclear cells (PBMCs) between the two groups. No graft rejection was observed throughout this study. Adverse events were generally observed within 5 days. The KTx group exhibited a significantly lower degree of symptoms between doses 1 and 2 (P < 0.001). Increases in activated subsets of T and B cells expressing human leukocyte antigen (HLA)-DR and/or CD38 were observed in the HC group after dose 2 (both P < 0.001), with the greatest increases in HLA-DR+CD8+ T cells and CD38+CD19+ B cells (P = 0.042 and P = 0.031, respectively). In addition, PD1+CD8+ T cells-but not PD1+CD4+ T cells-increased significantly in the HC group (P = 0.027). In the KTx group, however, activated HLA-DR+, CD38+, and PD1+ cells remained at baseline levels. Immunoglobulin (Ig)G against SARS-CoV-2 was detected in only four KTx recipients (13.3%) after dose 2 (P < 0.001). Multivariate logistic regression analyses revealed that ΔHLA-DR+CD8+ T cells and ΔCD38+CD19+ B cells were significantly associated with IgG formation (both P = 0.02). SARS-CoV-2 mRNA vaccine generates impaired cellular and humoral immunity for KTx recipients. Results indicate the need for modified vaccination strategies in immunocompromised KTx recipients.
Keywords: SARS-CoV-2 mRNA vaccination; cellular and humoral immune responses; immunological imprint; kidney transplantation; safety.
Copyright © 2022 Takiguchi, Tomita, Uehara, Tateishi, Yamamoto and Nakamura.
Conflict of interest statement
The authors declare that the research was conducted in the absence of any commercial or financial relationships that could be construed as a potential conflict of interest.
Figures
Similar articles
-
Evaluation of the Correlation Between Responders and Non-Responders to the Second Coronavirus Disease Vaccination In Kidney Transplant Recipients: A Retrospective Single-Center Cohort Study.Transplant Proc. 2022 Jul-Aug;54(6):1483-1488. doi: 10.1016/j.transproceed.2022.05.002. Epub 2022 May 31. Transplant Proc. 2022. PMID: 35868872 Free PMC article.
-
Immune Responses to SARS-CoV-2 Infection and Vaccination in Dialysis Patients and Kidney Transplant Recipients.Microorganisms. 2021 Dec 21;10(1):4. doi: 10.3390/microorganisms10010004. Microorganisms. 2021. PMID: 35056453 Free PMC article.
-
Impaired Humoral Response in Renal Transplant Recipients to SARS-CoV-2 Vaccination with BNT162b2 (Pfizer-BioNTech).Viruses. 2021 Apr 25;13(5):756. doi: 10.3390/v13050756. Viruses. 2021. PMID: 33923063 Free PMC article.
-
The Cellular and Humoral Immune Response to SARS-CoV-2 Messenger RNA Vaccines Is Significantly Better in Liver Transplant Patients Compared with Kidney Transplant Patients.Pathogens. 2023 Jul 5;12(7):910. doi: 10.3390/pathogens12070910. Pathogens. 2023. PMID: 37513757 Free PMC article.
-
Effects of age, sex, serostatus, and underlying comorbidities on humoral response post-SARS-CoV-2 Pfizer-BioNTech mRNA vaccination: a systematic review.Crit Rev Clin Lab Sci. 2022 Sep;59(6):373-390. doi: 10.1080/10408363.2022.2038539. Epub 2022 Feb 28. Crit Rev Clin Lab Sci. 2022. PMID: 35220860 Free PMC article.
Cited by
-
Impaired SARS-CoV-2-specific responses via activated T follicular helper cells in immunocompromised kidney transplant recipients.Sci Rep. 2024 Oct 19;14(1):24571. doi: 10.1038/s41598-024-76251-x. Sci Rep. 2024. PMID: 39427014 Free PMC article.
-
Effects of anti-SARS-CoV-2 vaccination in living kidney transplant recipients prior to transplantation.Clin Exp Nephrol. 2024 Dec;28(12):1332-1333. doi: 10.1007/s10157-024-02535-1. Epub 2024 Jul 6. Clin Exp Nephrol. 2024. PMID: 38969932 No abstract available.
-
Innate and Adaptive Immunity during SARS-CoV-2 Infection: Biomolecular Cellular Markers and Mechanisms.Vaccines (Basel). 2023 Feb 10;11(2):408. doi: 10.3390/vaccines11020408. Vaccines (Basel). 2023. PMID: 36851285 Free PMC article. Review.
References
-
- Folegatti PM, Ewer KJ, Aley PK, Angus B, Becker S, Belij-Rammerstorfer S, et al. Safety and immunogenicity of the ChAdOx1 nCoV-19 vaccine against SARS-CoV-2: a preliminary report of a phase 1/2, single-blind, randomised controlled trial. Lancet. (2020) 396:467–78. 10.1016/S0140-6736(20)31604-4 - DOI - PMC - PubMed
LinkOut - more resources
Full Text Sources
Research Materials
Miscellaneous