. 2023 Jan 9;13(1):132-145.
doi: 10.1158/2159-8290.CD-22-1074.

Creating MHC-Restricted Neoantigens with Covalent Inhibitors That Can Be Targeted by Immune Therapy

Affiliations

Creating MHC-Restricted Neoantigens with Covalent Inhibitors That Can Be Targeted by Immune Therapy

Takamitsu Hattori et al. Cancer Discov. .

Erratum in

Abstract

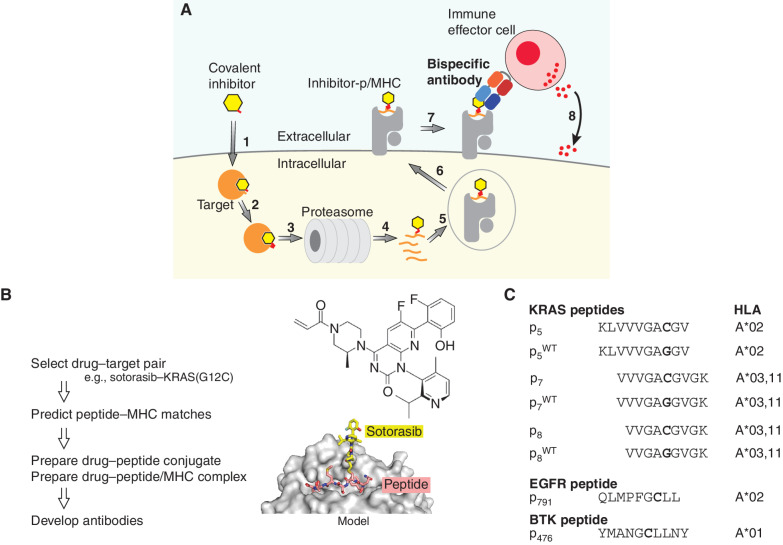
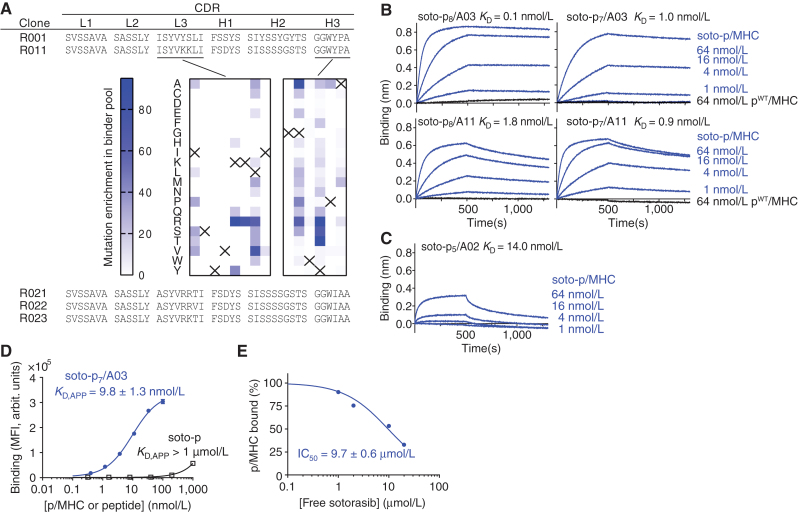
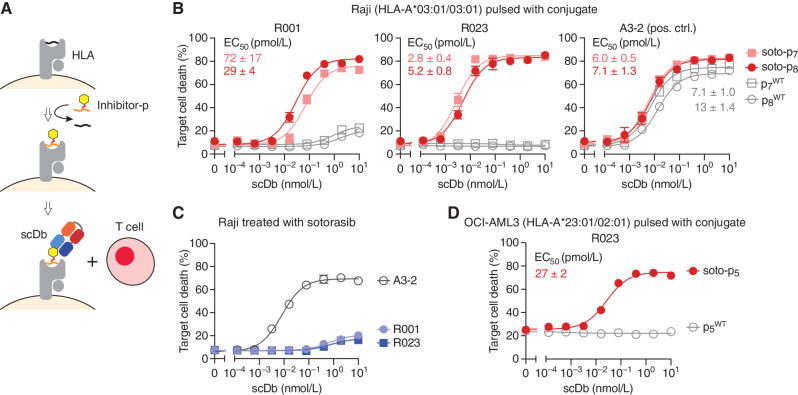
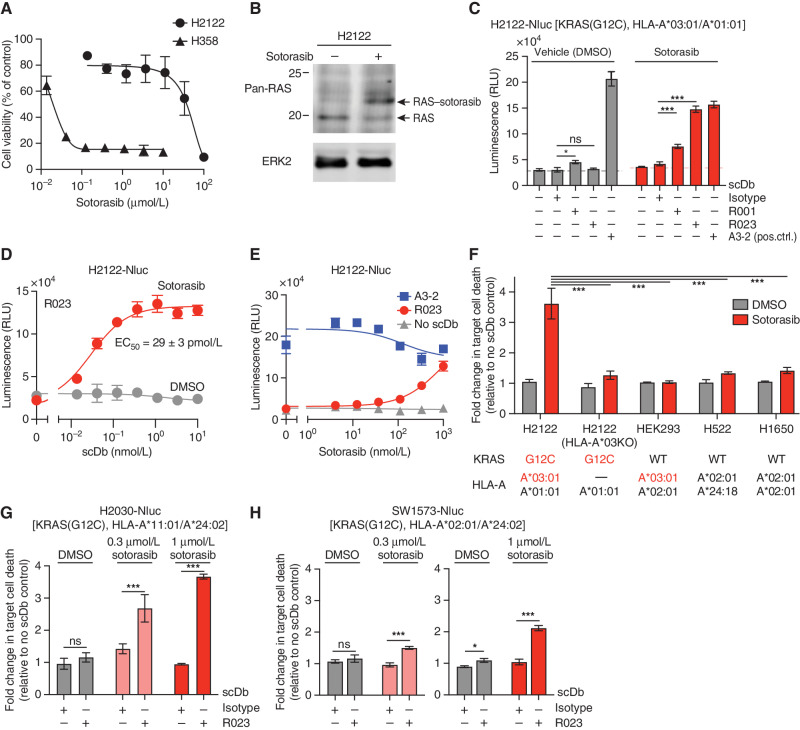
Intracellular oncoproteins can be inhibited with targeted therapy, but responses are not durable. Immune therapies can be curative, but most oncogene-driven tumors are unresponsive to these agents. Fragments of intracellular oncoproteins can act as neoantigens presented by the major histocompatibility complex (MHC), but recognizing minimal differences between oncoproteins and their normal counterparts is challenging. We have established a platform technology that exploits hapten-peptide conjugates generated by covalent inhibitors to create distinct neoantigens that selectively mark cancer cells. Using the FDA-approved covalent inhibitors sotorasib and osimertinib, we developed "HapImmune" antibodies that bind to drug-peptide conjugate/MHC complexes but not to the free drugs. A HapImmune-based bispecific T-cell engager selectively and potently kills sotorasib-resistant lung cancer cells upon sotorasib treatment. Notably, it is effective against KRASG12C-mutant cells with different HLA supertypes, HLA-A*02 and A*03/11, suggesting loosening of MHC restriction. Our strategy creates targetable neoantigens by design, unifying targeted and immune therapies.

Significance: Targeted therapies against oncoproteins often have dramatic initial efficacy but lack durability. Immunotherapies can be curative, yet most tumors fail to respond. We developed a generalizable technology platform that exploits hapten-peptides generated by covalent inhibitors as neoantigens presented on MHC to enable engineered antibodies to selectively kill drug-resistant cancer cells. See related commentary by Cox et al., p. 19. This article is highlighted in the In This Issue feature, p. 1.


Figures

Figure 1. The HapImmune concept. A, A covalent inhibitor enters the cell (step 1) and binds and forms a covalent bond with its target (step 2). As a part of natural protein turnover, the target–drug conjugate is degraded, and peptides with the conjugated drug are produced (steps 3 and 4). A drug–peptide conjugate is incorporated into a compatible MHC molecule (step 5). The drug–peptide/MHC complex translocates to the cell surface (step 6). A HapImmune antibody binds the complex (step 7) and recruits an immune effector cell, which initiates cell killing (step 8). Alternatively, the HapImmune antibody can serve as the recognition element for antibody conjugates or cellular therapies. B, Overview of antibody development strategy. The molecular model was based on Protein Data Bank ID 3RL1 (67). C, Peptides used in this study and their predicted HLA matches.
Figure 1.
The HapImmune concept. A, A covalent inhibitor enters the cell (step 1) and binds and forms a covalent bond with its target (step 2). As a part of natural protein turnover, the target–drug conjugate is degraded, and peptides with the conjugated drug are produced (steps 3 and 4). A drug–peptide conjugate is incorporated into a compatible MHC molecule (step 5). The drug–peptide/MHC complex translocates to the cell surface (step 6). A HapImmune antibody binds the complex (step 7) and recruits an immune effector cell, which initiates cell killing (step 8). Alternatively, the HapImmune antibody can serve as the recognition element for antibody conjugates or cellular therapies. B, Overview of antibody development strategy. The molecular model was based on Protein Data Bank ID 3RL1 (67). C, Peptides used in this study and their predicted HLA matches.
Figure 2. Development and binding properties of the R023 antibody. A, CDR sequences of R023 and its precursors and related clones. The middle images show the results of DMS of clone R011. The numbers indicate the total numbers of sequencing reads for each mutation, divided by the total number of reads for all mutations at the position, multiplied by 1000. The crosses show the wild-type residue. B, BLI sensorgrams of the interaction between R023 Fab and the indicated MHC complexes. Biotinylated R023 Fab was immobilized, and binding of soluble p/MHC samples was measured. KD values from global fitting are shown. C, BLI sensorgrams of the interaction between R023 Fab and the soto-p5/A02 complex. D, Binding titration of scFv R023 displayed on the yeast cell surface to soto-p7/03 (blue) and the soto-p7 conjugate in the absence of an MHC (open squares). E, Inhibition by free sotorasib of the interaction between soto-p7/A03 (10 nmol/L) and scFv R023 displayed on the yeast cell surface. The binding signal intensity was normalized using the value without sotorasib (100%) and in the absence of soto-p7/A03 (0%). IC50 values are reported ± standard error. In B and C, each data point shows the mean (n = 3; technical replicates) of the median fluorescence intensity. Error bars represent the standard deviation.
Figure 2.
Development and binding properties of the R023 antibody. A, CDR sequences of R023 and its precursors and related clones. The middle images show the results of DMS of clone R011. The numbers indicate the total numbers of sequencing reads for each mutation, divided by the total number of reads for all mutations at the position, multiplied by 1,000. The crosses show the wild-type residue. B, BLI sensorgrams of the interaction between R023 Fab and the indicated MHC complexes. Biotinylated R023 Fab was immobilized, and binding of soluble p/MHC samples was measured. KD values from global fitting are shown. C, BLI sensorgrams of the interaction between R023 Fab and the soto-p5/A02 complex. D, Binding titration of scFv R023 displayed on the yeast cell surface to soto-p7/A03 (blue) and the soto-p7 conjugate in the absence of an MHC (open squares). arbit., arbitrary; MFI, median fluorescence intensity. E, Inhibition by free sotorasib of the interaction between soto-p7/A03 (10 nmol/L) and scFv R023 displayed on the yeast cell surface. The binding signal intensity was normalized using the value without sotorasib (100%) and in the absence of soto-p7/A03 (0%). IC50 values are reported ± standard error. In B and C, each data point shows the mean (n = 3; technical replicates) of the median fluorescence intensity. Error bars represent the standard deviation.
Figure 3. Cytotoxic effects of R023 scDb on cells pulsed with a sotorasib–KRAS(G12C) conjugate. A, Schematic representation of the assay. Cells are pulsed with a conjugate or a negative control peptide, and then cocultured with T cells in the presence of scDb. B, Cytotoxic effects of scDbs on Raji cells pulsed with soto-p7, soto-p8, p7WT, or p8WT. C, Cytotoxic effects of the R001 and R023 scDbs on sotorasib-treated Raji cells, which do not possess KRAS(G12C). D, Cytotoxic effects of R023 on OCI-AML3 cells pulsed with soto-p5 and p5WT. Data are from triplicate measurements, and calculated EC50 values are shown. A3-2 is a positive-control antibody that binds to HLA-A3 irrespective of the bound peptide. Data shown are representative of ≥2 equivalent measurements.
Figure 3.
Cytotoxic effects of the R023 scDb on cells pulsed with a sotorasib–KRAS(G12C) conjugate. A, Schematic representation of the assay. Cells are pulsed with a conjugate or a negative control peptide, and then cocultured with T cells in the presence of scDb. B, Cytotoxic effects of scDbs on Raji cells pulsed with soto-p7, soto-p8, p7WT, or p8WT. C, Cytotoxic effects of the R001 and R023 scDbs on sotorasib-treated Raji cells, which do not possess KRAS(G12C). D, Cytotoxic effects of R023 on OCI-AML3 cells pulsed with soto-p5 and p5WT. Data are from triplicate measurements, and calculated EC50 values are shown. A3-2 is a positive control (pos. ctrl.) antibody that binds to HLA-A3 irrespective of the bound peptide. Data shown are representative of ≥2 equivalent measurements.
Figure 4. Cytotoxic effect of R023 scDb on sotorasib-treated tumor cells. A, Dose–response curves of the viability of H358 and H2122 cells following exposure to sotorasib for 72 hours. B, Analysis of sotorasib conjugation to KRAS(G12C) in H2122 cells by Western blot. H2122 cells were incubated with 100 nmol/L sotorasib for 24 hours. The arrow indicates KRAS(G12C) conjugated to sotorasib. Note that the anti–pan-RAS antibody detects KRAS, HRAS, and NRAS, so a complete shift of the original band is not expected. C, Cytotoxic effects of the indicated scDbs on H2122-Nluc cells treated with 1 μmol/L sotorasib. The scDb concentration was 10 nmol/L except for the A3-2 scDb (1 nmol/L). D, Cell killing titration curve of the R023 scDb on H2122-Nluc cells treated with 1 μmol/L sotorasib. E, Dependence of cell killing on sotorasib concentration with the indicated scDbs at 1 nmol/L. F, HLA dependence of cell killing by R023 scDb. The normalized luminescence intensity (see Supplementary Fig. S5A for the procedure) is shown for cell lines treated with 0.3 μmol/L sotorasib and cocultured with T cells in the presence of 1 nmol/L scDbs and 0.3 μmol/L sotorasib. KRAS mutation state and HLA alleles for the cell lines are shown. G–H, Cytotoxic effects of the R023 scDb (1 nmol/L) on H2030-Nluc (G) and SW1573-Nluc (H) cells treated with sotorasib. Data shown are from technical quadruplicate measurements, representative of ≥2 equivalent measurements. Data represent mean ± SD; one-way ANOVA with Tukey multiple comparison test; *, P < 0.05; **, P < 0.01; ***, P < 0.001. See Supplementary Fig. S5 for raw data for F–H.
Figure 4.
Cytotoxic effect of the R023 scDb on sotorasib-treated tumor cells. A, Dose–response curves of the viability of H358 and H2122 cells following exposure to sotorasib for 72 hours. B, Analysis of sotorasib conjugation to KRAS(G12C) in H2122 cells by Western blot. H2122 cells were incubated with 100 nmol/L sotorasib for 24 hours. The arrow indicates KRAS(G12C) conjugated to sotorasib. Note that the anti–pan-RAS antibody detects KRAS, HRAS, and NRAS, so a complete shift of the original band is not expected. C, Cytotoxic effects of the indicated scDbs on H2122-Nluc cells treated with 1 μmol/L sotorasib. The scDb concentration was 10 nmol/L except for the A3-2 scDb (1 nmol/L). pos. ctrl., positive control; RLU, relative light units. D, Cell killing titration curve of the R023 scDb on H2122-Nluc cells treated with 1 μmol/L sotorasib. E, Dependence of cell killing on sotorasib concentration with the indicated scDbs at 1 nmol/L. F, HLA dependence of cell killing by R023 scDb. The normalized luminescence intensity (see Supplementary Fig. S5A for the procedure) is shown for cell lines treated with 0.3 μmol/L sotorasib and cocultured with T cells in the presence of 1 nmol/L scDb and 0.3 μmol/L sotorasib. KRAS mutation state and HLA alleles for the cell lines are shown. KO, knockout; WT, wild-type. G and H, Cytotoxic effects of the R023 scDb (1 nmol/L) on H2030-Nluc (G) and SW1573-Nluc (H) cells treated with sotorasib. Data shown are from technical quadruplicate measurements, representative of ≥2 equivalent measurements. Data represent mean ± SD; one-way ANOVA with Tukey multiple comparison test; *, P < 0.05; ***, P < 0.001; ns, not significant. See Supplementary Fig. S5 for raw data for F–H.
Figure 5. Binding and cell killing analyses of HapImmune antibody E021 against osimertinib–EGFR peptide conjugate in complex with HLA-A*02. A, CDR sequences of clones E001 and E021. Middle, the enrichment profiles of amino acid substitutions deduced from DMS of CDR-L3 and -H3 positions. Data are presented as in Fig. 2A. B, Binding analysis of E021 using yeast display. C, Effect of free osimertinib on binding of E021 to osim-p791/A02. Binding signals were normalized to that in the absence of osimertinib. The IC50 value is the mean ± SD (n = 3, technical replicates). D, Cytotoxic effect of the E021 scDb on OCI-AML3 cells pulsed with osim-P791 or P791. Note that the E021 scDb showed potent cytotoxic effect on cells pulsed with the osimertinib–EGFR conjugate but not with the control peptide. E, Cytotoxic effects of E021 scDb on osimertinib-treated OCI-AML3 cells, negative control cells that do not possess activating EGFR mutants. Data are from triplicate measurements, and calculated EC50 values are shown (mean ± SD; n = 3, technical replicates). BB7.2 is a positive control that binds to HLA-A2 irrespective of the bound peptide. Data shown are representative of ≥2 equivalent measurements.
Figure 5.
Binding and cell killing analyses of HapImmune antibody E021 against osimertinib–EGFR peptide conjugate in complex with HLA-A*02. A, CDR sequences of clones E001 and E021. Middle, the enrichment profiles of amino acid substitutions deduced from DMS of CDR-L3 and CDR-H3 positions. Data are presented as in Fig. 2A. B, Binding analysis of E021 using yeast display. arbit., arbitrary; MFI, median fluorescence intensity. C, Effect of free osimertinib on binding of E021 to osim-p791/A02. Binding signals were normalized to that in the absence of osimertinib. The IC50 value is the mean ± SD (n = 3, technical replicates). D, Cytotoxic effect of the E021 scDb on OCI-AML3 cells pulsed with osim-p791 or p791. Note that the E021 scDb showed potent cytotoxic effect on cells pulsed with the osimertinib–EGFR conjugate but not with the control peptide. E, Cytotoxic effects of E021 scDb on osimertinib-treated OCI-AML3 cells, negative control cells that do not possess activating EGFR mutants. Data are from triplicate measurements, and calculated EC50 values are shown (mean ± SD; n = 3, technical replicates). BB7.2 is a positive control that binds to HLA-A2 irrespective of the bound peptide. Data shown are representative of ≥2 equivalent measurements.

Comment in

References

    1. Ahronian LG, Corcoran RB. Strategies for monitoring and combating resistance to combination kinase inhibitors for cancer therapy. Genome Med 2017;9:37. - PMC - PubMed
    1. Konieczkowski DJ, Johannessen CM, Garraway LA. A convergence-based framework for cancer drug resistance. Cancer Cell 2018;33:801–15. - PMC - PubMed
    1. Ostrem JM, Peters U, Sos ML, Wells JA, Shokat KM. K-Ras(G12C) inhibitors allosterically control GTP affinity and effector interactions. Nature 2013;503:548–51. - PMC - PubMed
    1. Canon J, Rex K, Saiki AY, Mohr C, Cooke K, Bagal D, et al. . The clinical KRAS(G12C) inhibitor AMG 510 drives anti-tumour immunity. Nature 2019;575:217–23. - PubMed
    1. Hong DS, Fakih MG, Strickler JH, Desai J, Durm GA, Shapiro GI, et al. . KRAS(G12C) inhibition with sotorasib in advanced solid tumors. N Engl J Med 2020;383:1207–17. - PMC - PubMed

Publication types