. 2022 Nov;36(11):e22612.
doi: 10.1096/fj.202200468RR.

Evidence for a fragile X messenger ribonucleoprotein 1 (FMR1) mRNA gain-of-function toxicity mechanism contributing to the pathogenesis of fragile X-associated premature ovarian insufficiency

Affiliations

Evidence for a fragile X messenger ribonucleoprotein 1 (FMR1) mRNA gain-of-function toxicity mechanism contributing to the pathogenesis of fragile X-associated premature ovarian insufficiency

Roseanne Rosario et al. FASEB J. 2022 Nov.

Abstract

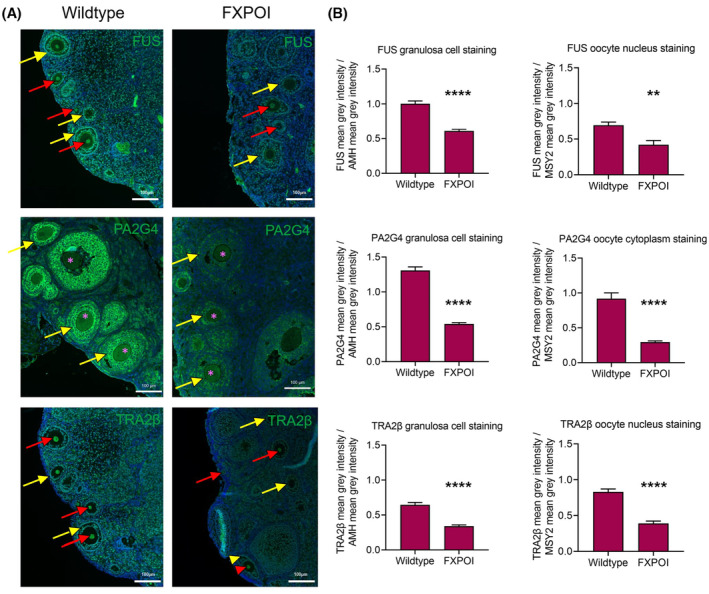
Fragile X-associated premature ovarian insufficiency (FXPOI) is among a family of disorders caused by expansion of a CGG trinucleotide repeat sequence located in the 5' untranslated region (UTR) of the fragile X messenger ribonucleoprotein 1 (FMR1) gene on the X chromosome. Women with FXPOI have a depleted ovarian follicle population, resulting in amenorrhea, hypoestrogenism, and loss of fertility before the age of 40. FXPOI is caused by expansions of the CGG sequence to lengths between 55 and 200 repeats, known as a FMRI premutation, however the mechanism by which the premutation drives disease pathogenesis remains unclear. Two main hypotheses exist, which describe an mRNA toxic gain-of-function mechanism or a protein-based mechanism, where repeat-associated non-AUG (RAN) translation results in the production of an abnormal protein, called FMRpolyG. Here, we have developed an in vitro granulosa cell model of the FMR1 premutation by ectopically expressing CGG-repeat RNA and FMRpolyG protein. We show that expanded CGG-repeat RNA accumulated in intranuclear RNA structures, and these aggregates were able to cause significant granulosa cell death independent of FMRpolyG expression. Using an innovative RNA pulldown, mass spectrometry-based approach we have identified proteins that are specifically sequestered by CGG RNA aggregates in granulosa cells in vitro, and thus may be deregulated as consequence of this interaction. Furthermore, we have demonstrated reduced expression of three proteins identified via our RNA pulldown (FUS, PA2G4 and TRA2β) in ovarian follicles in a FMR1 premutation mouse model. Collectively, these data provide evidence for the contribution of an mRNA gain-of-function mechanism to FXPOI disease biology.

Keywords: CGG trinucleotide repeats; FMRpolyG; FXPOI; mRNA gain-of-function.


Figures

FIGURE 1
FIGURE 1
Proposed models of FMR1 premutation toxicity. (A) RNA gain‐of‐function toxicity. FMR1 transcription increases to compensate for affected translation. Subsequently, premutation CGG repeat lengths form intranuclear aggregates that can sequester RNA binding proteins, inhibiting them from carrying out their normal roles, leading to cell dysfunction. (B) Repeat‐associated non‐AUG (RAN) translation mediated toxicity. Translation of FMR1 mRNA is initiated from a near cognate ACG start codon, resulting in the production of polyglycine and/or polyalanine‐containing proteins that interfere with normal cell function or might directly be toxic. Figure taken from Ref. [21].
FIGURE 2
FIGURE 2
Expanded CGG repeats within the FMR1 5′UTR form intranuclear RNA aggregates and FMRpolyG protein aggregates in granulosa cell lines. HGrC1 cells were transfected with a plasmid expressing either 100 CGG repeats within the FMR1 5′UTR or no CGG repeats (control) and analyzed 24 h after transfection by RNA FISH using a (CCG)8x‐Cy3 DNA probe counterstained with DAPI or fluorescence microscopy for the presence of CGG RNA aggregates (A) or FMRpolyG protein (B), respectively. (C) Western blotting using an FMRpolyG‐specific antibody following transfection of Δ5′UTR FMR1 (CGG)100x GFP and 5′UTR FMR1 (CGG)100x GFP plasmids confirms only the latter is capable of producing FMRpolyG protein, with a band (green) visible at ~37–40 kDA, corresponding to FMRpolyG itself and a GFP tag. ACTB (red) was used as a loading control. (D) HGrC1 cells were transfected with a plasmid expressing either 60x CGG repeats, 100 CGG repeats within the FMR1 5′UTR or no CGG repeats (control) and analyzed at 24, 48 and 72 h after transfection by RNA FISH. Whilst RNA aggregates formed following expression of 60x CGG repeats increased in size and number over time, RNA aggregates formed following expression of the 5′UTR FMR1 (CGG)100x GFP plasmid were stable in size and number. (E) Immunostaining for p62 expression in CGG‐RNA aggregate‐positive and FMRpolyG‐positive cells. Scale bars represent 10 μM.
FIGURE 3
FIGURE 3
Expanded CGG‐repeat mRNA is not efficiently translated into FMRpolyG protein in HGrC1 cells. HGrC1 were transfected with a plasmid expressing 100 CGG repeats within the FMR1 5′UTR and RNA FISH followed by GFP immunocytochemistry were used 48 h after transfection to identify the colocalisation of CGG RNA aggregates and FMRpolyG protein expression. A representative image is shown in (A). Scale bars represent 500 and 20 μM, respectively. Quantification of cells expressing either CGG RNA only, CGG RNA and FMRpolyG or FMRpolyG only in HGrC1 (B) Data are presented as the mean ± SEM of four individual experiments. Friedman test, **p = .0046.
FIGURE 4
FIGURE 4
HGrC1 cell viability following expression of CGG‐repeat RNA only or CGG‐repeat RNA and FMRpolyG. (A) HGrC1 cells were transfected with an empty plasmid, (CGG)60x plasmid, Δ5′UTR FMR1 (CGG)100x GFP plasmid, or 5′UTR FMR1 (CGG)100x GFP plasmid, and an MTT assay was carried out at 72 h post transfection to assess cell viability. (B) HGrC1 cells were transfected with an empty pEGFP plasmid, Δ5′UTR FMR1 (CGG)100x GFP_GFP or 5′UTR FMR1 (CGG)100x GFP and collected for analysis via flow cytometry at 72 h post transfection. A representative image of gating for GFP and DAPI positive single cells in shown in (B). Quantification of GFP and DAPI positive HGrC1 cells (C). Data are presented as the mean ± SEM of four individual experiments, Mann–Whitney test, **p < .004 *p < .028.
FIGURE 5
FIGURE 5
RP‐SMS identifies proteins that bind CGG RNA aggregates in HGrC1 cells. (A) A representative distribution of H/L ratios among proteins identified in the CGG30x RNA pulldown. Results reveal that most proteins identified bind specifically to CGG30x RNA as opposed to non‐specifically to beads, i.e., with 2‐fold or more enrichment. (B) Venn diagram depicting the overlap between proteins identified in four replicate RP‐SMS experiments, where two had ‘heavy’‐labeled RNA and two had ‘light’‐labeled RNA. 100 proteins are strong binders that are enriched 7‐fold or more in all four experiments. (C) Western blot investigating the specificity of FUS, PA2G4 and TRA2β binding to CGG30x RNA, with beads‐only and pre‐let‐7a‐1 RNA as controls.
FIGURE 6
FIGURE 6
Quantification of co‐localisation and overall expression of endogenous FUS, PA2G4 and TRA2β in CGG‐repeat RNA and FMRpolyG transfected HGrC1 cells. (A) HGrC1 cells were transfected with an empty plasmid or left untreated, and immunocytochemistry was used at 48 h post transfection to examine the cellular localisation of candidate proteins. Scale bars represent 20 μM. (B) HGrC1 cells were co‐transfected with a plasmid expressing 60x CGG repeats and RNA FISH followed by immunocytochemistry were used after 48 h to identify the colocalisation of CGG RNA aggregates and candidate proteins. Scale bars represent 10 μM. (C) Quantification of colocalisation from 40 individual cells over three separate experiments. Data are presented as the mean ± SEM. (D) Western blot for candidate protein expression following transfection of empty, Δ5′UTR FMR1 (CGG)100x GFP or 5′UTR FMR1 (CGG)100x GFP plasmids. Quantification of signal intensity is normalized to that of loading control ACTB or TUBA. Data are presented as the mean ± SEM of four individual experiments, Mann–Whitney test, *p < .05.
FIGURE 7
FIGURE 7
Expression of FUS, PA2G4 and TRA2β in 6 month old wildtype and FXPOI mice. (A) Representative images of FUS, PA2G4 and TRA2β expression in 6 month old wildtype and CAG LoxP 5′UTR FMR1 (CGG)99x GFP x CMV Cre bigenic mice (referred to as FXPOI mice). Oocyte nuclei and cytoplasm are denoted with a red arrow head and pink asterisks, respectively, and granulosa cells, with a yellow arrow head. Scale bars represent 100 μM. (B) Quantification of mean gray values for FUS, PA2G4 and TRA2β representative of staining intensity were normalized to mean gray values of AMH (for granulosa cell data) and MSY2 (for oocyte data). Data are presented as the mean ± SEM from three separate mice. Mann–Whitney test, ****p < .0001 **p = .002.

References

    1. Nolin SL, Brown WT, Glicksman A, et al. Expansion of the fragile X CGG repeat in females with premutation or intermediate alleles. Am J Hum Genet. 2003;72:454‐464. - PMC - PubMed
    1. Nolin SL, Lewis FA 3rd, Ye LL, et al. Familial transmission of the FMR1 CGG repeat. Am J Hum Genet. 1996;59:1252‐1261. - PMC - PubMed
    1. Kronquist KE, Sherman SL, Spector EB. Clinical significance of tri‐nucleotide repeats in Fragile X testing: a clarification of American College of Medical Genetics guidelines. Genet Med. 2008;10:845‐847. - PMC - PubMed
    1. Cronister A, Schreiner R, Wittenberger M, Amiri K, Harris K, Hagerman RJ. Heterozygous fragile X female: historical, physical, cognitive, and cytogenetic features. Am J Med Genet. 1991;38:269‐274. - PubMed
    1. Conway GS, Payne NN, Webb J, Murray A, Jacobs PA. Fragile X premutation screening in women with premature ovarian failure. Hum Reprod. 1998;13:1184‐1187. - PubMed

Publication types

MeSH terms