Clinical Trial
. 2022 Nov;11(11):1458-1471.
doi: 10.1002/psp4.12855. Epub 2022 Oct 17.

Population pharmacokinetics modeling and exposure-response analyses of cemiplimab in patients with recurrent or metastatic cervical cancer

Affiliations
Clinical Trial

Population pharmacokinetics modeling and exposure-response analyses of cemiplimab in patients with recurrent or metastatic cervical cancer

Jenny-Hoa Nguyen et al. CPT Pharmacometrics Syst Pharmacol. 2022 Nov.

Abstract

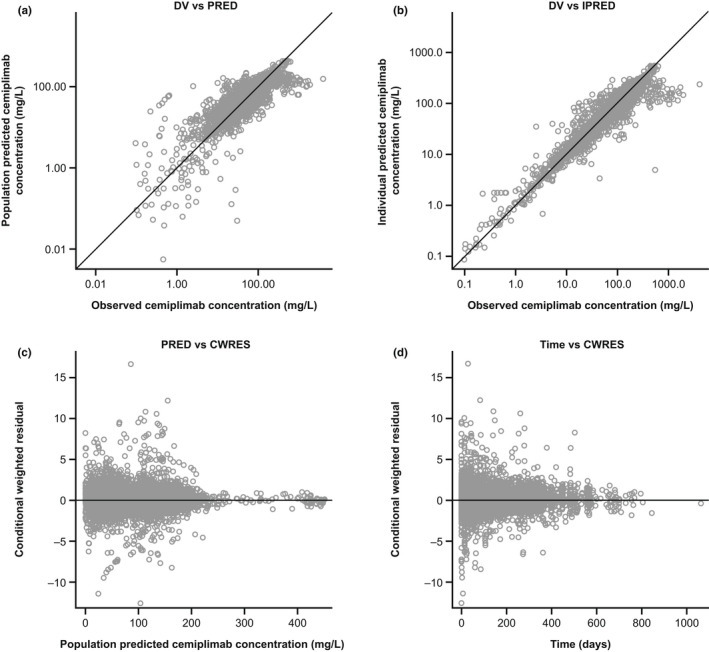
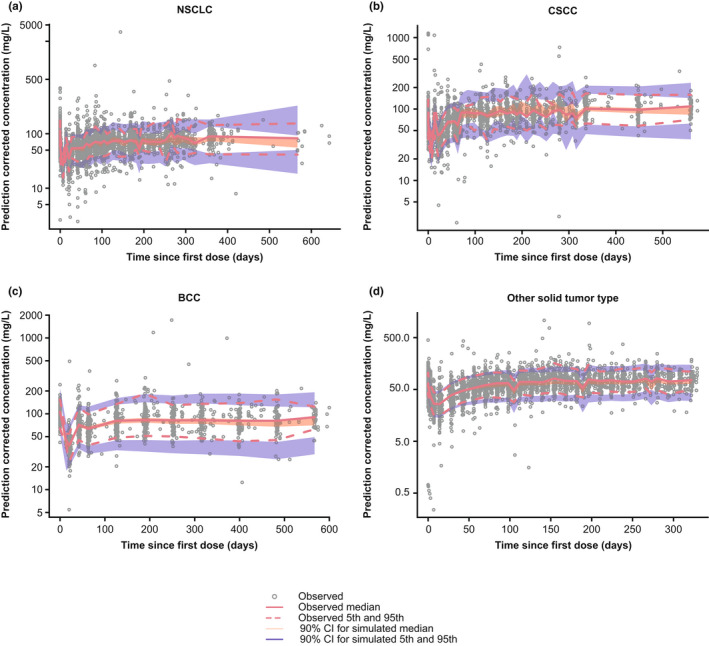
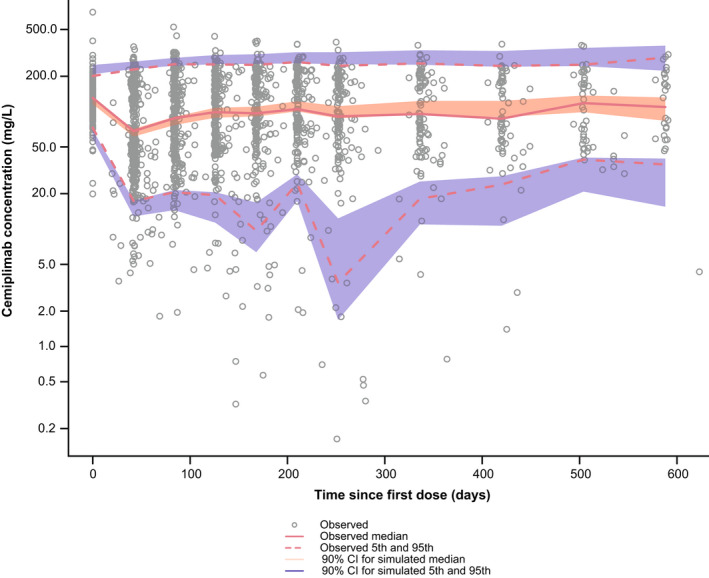
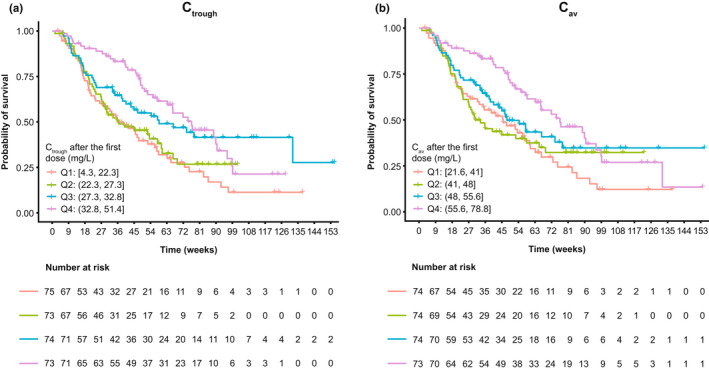
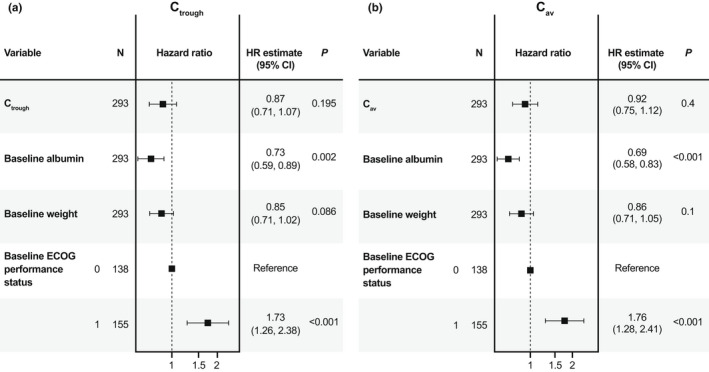
A population pharmacokinetic (PopPK) model was previously developed for cemiplimab in patients with solid tumors, including advanced cutaneous squamous cell carcinoma (CSCC). Here, we update the existing PopPK model and characterize exposure-response relationships using efficacy and safety data obtained in patients with recurrent or metastatic cervical cancer (R/M CC). To improve model stability and robustness of the existing PopPK model in 1062 patients, the random-effect error model was revised, and structural covariates were removed from the base model to be tested in the covariate analysis. The updated model was used for external validation of cemiplimab pharmacokinetics (PK) in patients with R/M CC on cemiplimab monotherapy (350 mg every 3 weeks intravenously) from a phase III study (NCT03257267). Exposure-response relationships for cemiplimab efficacy (overall survival [OS], progression-free survival [PFS], duration of response [DOR], objective response rate [ORR]), and safety (immune-related adverse events [irAEs]) were analyzed in 295 patients with R/M CC from the aforementioned study. The updated PopPK model showed improved stability with 94.8% successful bootstrap runs vs. 47.6% in the prior model. Cemiplimab exposure was similar across tumor types, including basal cell carcinoma, CSCC, and non-small cell lung cancer. External validation showed the updated model adequately described cemiplimab PK in patients with R/M CC. In exposure-response efficacy analyses, Cox proportional hazard modeling (CPHM) showed no trend between exposure and OS, Kaplan-Meier plots showed no trend between exposure and PFS or DOR, and logistic regression analyses conducted on ORR showed no exposure-response relationship. In exposure-response safety analyses, CPHM showed no trend between exposure and irAEs.


Conflict of interest statement

J.H.N., A.P., D.C., and J.D.D. are employees of and stockholders in Regeneron Pharmaceuticals, Inc. D.E., N.D., and N.A.‐H. are full‐time employees of the Ann Arbor Pharmacometrics Group (A2PG) and consultants for Regeneron Pharmaceuticals, Inc.

Figures

FIGURE 1
FIGURE 1
Diagnostic plots of the final covariate model. CWRES, conditional weighted residuals; DV, observed data; IPRED, individual predicted data; PK, pharmacokinetics; PRED, population predicted data.
FIGURE 2
FIGURE 2
Prediction‐corrected visual predictive check plots of the final PopPK model by tumor type. Gray solid circles represent individually observed concentrations. The red solid and dashed lines represent the observed median and the 5th and 95th percentiles, respectively. The shaded areas represent the 90% CIs for the median, 5th, and 95th percentiles of the simulated data. BCC, basal cell carcinoma; CI, confidence interval; CSCC, cutaneous squamous cell carcinoma; NSCLC, non‐small cell lung cancer.
FIGURE 3
FIGURE 3
External posterior predictive check of cemiplimab exposure for patients with R/M CC from EMPOWER‐Cervical 1/GOG‐3016/ENGOT‐cx9 using the final PopPK model. Gray open circles represent individually observed concentrations. The red solid and dashed lines represent the observed median and the 5th and 95th percentiles, respectively. The shaded areas represent the 90% CIs for the median, 5th, and 95th percentiles of the simulated data. CI, confidence interval; ENGOT, European Network of Gynecological Oncological Trial; GOG, Gynecologic Oncology Group; PopPK, population pharmacokinetic; R/M CC, recurrent or metastatic cervical cancer.
FIGURE 4
FIGURE 4
Kaplan–Meier curves of OS stratified by quartiles of individual predicted cemiplimab (a) Ctrough and (b) Cav after the first dose in patients with R/M CC from EMPOWER‐Cervical 1/GOG‐3016/ENGOT‐cx9. The vertical hatches through the Kaplan–Meier curves represent the last documented times that patients were observed to be alive. These censored patients may have dropped out of the study, or, because not all patients were enrolled in the study at the same time, they may have been censored at the time that the data cutoff occurred for this analysis. A drop in the Kaplan–Meier curve indicates the time of death due to any cause. The table provided underneath the Kaplan–Meier plot describes the number of patients alive in each quartile at each timepoint, which, for those patients, occurred before the data cutoff date. Ctrough and Cav exposure quartiles are detailed in Table S9. Cav, average concentration; Ctrough, trough serum concentration; ENGOT, European Network of Gynecological Oncological Trial; GOG, Gynecologic Oncology Group; OS, overall survival; Q, quartile; R/M CC, recurrent or metastatic cervical cancer.
FIGURE 5
FIGURE 5
Forest plot of Cox proportional hazards model of OS with individual predicted cemiplimab (a) Ctrough and (b) Cav after the first dose and baseline covariates as model predictors in patients with R/M CC from EMPOWER‐Cervical 1/GOG‐3016/ENGOT‐cx9 (Cox proportional hazard modeling data shown for 293 out of 295 patients as baseline albumin values were not available for two patients). Ctrough and Cav were fit based on after first dose values in this model. Continuous covariates were standardized to have a mean of 0 and SD of 1 by centering values from the mean value and scaling by the SD of the covariate. Interpretation of the estimated HR is based on a change in one unit of SD from the mean value rather than a change in one unit of the covariate from the baseline value of 0. The 95% CI represents the 95% CI of the HR estimate, where a value of 1 contained within the interval indicates that the covariate is not significant. Mean values are detailed in Table S8. Cav, average concentration; CI, confidence interval; Ctrough, trough serum concentration; ECOG, Eastern Cooperative Oncology Group; ENGOT, European Network of Gynecological Oncological Trial; GOG, Gynecologic Oncology Group; HR, hazard ratio; OS, overall survival; R/M CC, recurrent or metastatic cervical cancer.

References

    1. Sung H, Ferlay J, Siegel RL, et al. Global cancer statistics 2020: GLOBOCAN estimates of incidence and mortality worldwide for 36 cancers in 185 countries. CA Cancer J Clin. 2021;71:209‐249. - PubMed
    1. Okunade KS. Human papillomavirus and cervical cancer. J Obstet Gynaecol. 2020;40:602‐608. - PMC - PubMed
    1. Canfell K, Kim JJ, Brisson M, et al. Mortality impact of achieving WHO cervical cancer elimination targets: a comparative modelling analysis in 78 low‐income and lower‐middle‐income countries. Lancet. 2020;395:591‐603. - PMC - PubMed
    1. National Comprehensive Cancer Network . NCCN clinical practice guidelines in oncology: cervical cancer (version 1.2022). 2021. https://www.nccn.org/professionals/physician_gls/pdf/cervical.pdf. Accessed November 20, 2021.
    1. Cohen AC, Roane BM, Leath CA 3rd. Novel therapeutics for recurrent cervical cancer: moving towards personalized therapy. Drugs. 2020;80:217‐227. - PMC - PubMed

Publication types

MeSH terms

Substances