

High temporal resolution Nanopore sequencing dataset of SARS-CoV-2 and host cell RNAs
- PMID: 36251275
- PMCID: PMC9575581
- DOI: 10.1093/gigascience/giac094
High temporal resolution Nanopore sequencing dataset of SARS-CoV-2 and host cell RNAs
Abstract
Background: Recent studies have disclosed the genome, transcriptome, and epigenetic compositions of severe acute respiratory syndrome coronavirus 2 (SARS-CoV-2) and the effect of viral infection on gene expression of the host cells. It has been demonstrated that, besides the major canonical transcripts, the viral genome also codes for noncanonical RNA molecules. While the structural characterizations have revealed a detailed transcriptomic architecture of the virus, the kinetic studies provided poor and often misleading results on the dynamics of both the viral and host transcripts due to the low temporal resolution of the infection event and the low virus/cell ratio (multiplicity of infection [MOI] = 0.1) applied for the infection. It has never been tested whether the alteration in the host gene expressions is caused by aging of the cells or by the viral infection.
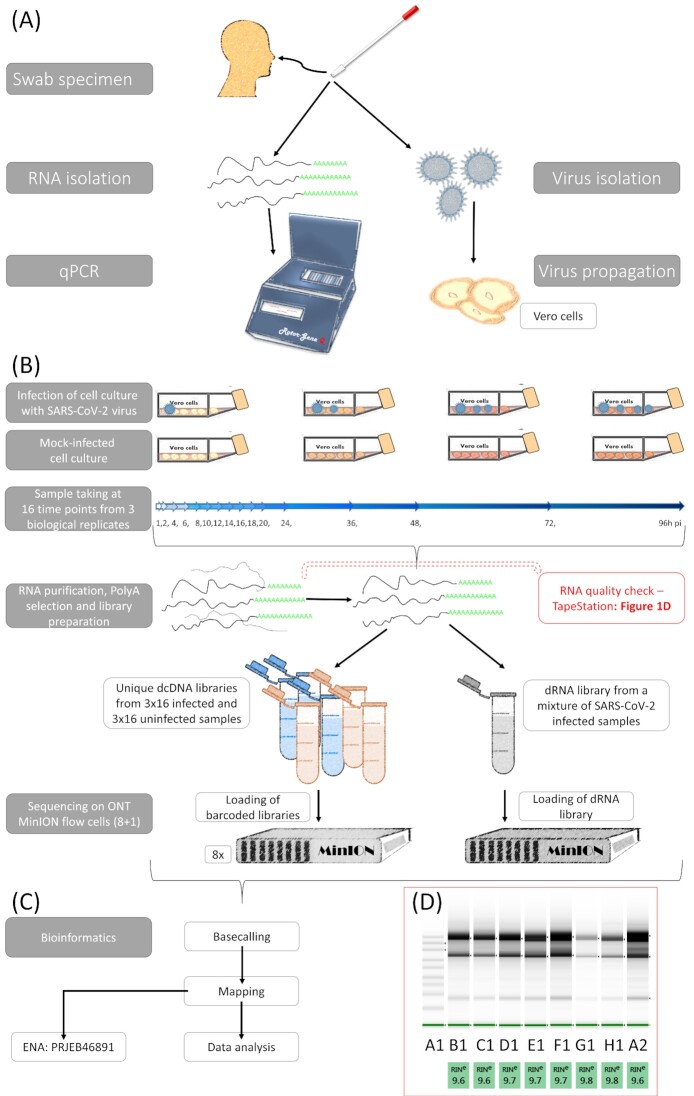
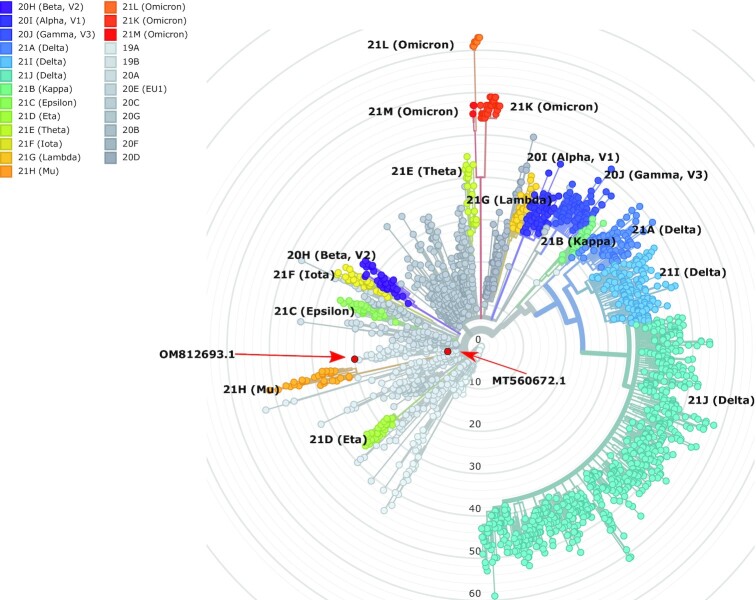
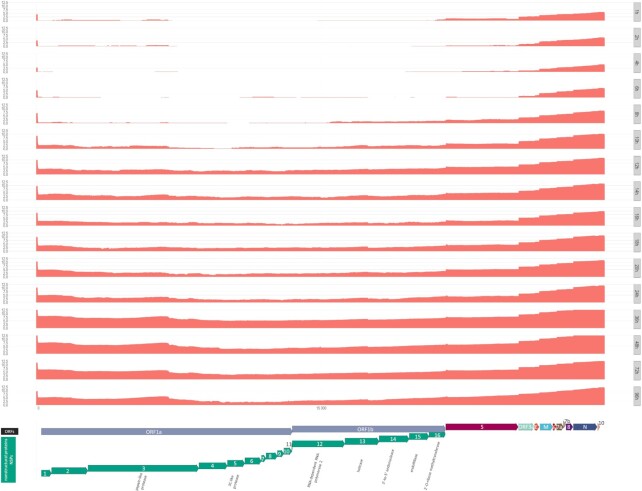
Findings: In this study, we used Oxford Nanopore's direct cDNA and direct RNA sequencing methods for the generation of a high-coverage, high temporal resolution transcriptomic dataset of SARS-CoV-2 and of the primate host cells, using a high infection titer (MOI = 5). Sixteen sampling time points ranging from 1 to 96 hours with a varying time resolution and 3 biological replicates were used in the experiment. In addition, for each infected sample, corresponding noninfected samples were employed. The raw reads were mapped to the viral and to the host reference genomes, resulting in 49,661,499 mapped reads (54,62 Gbs). The genome of the viral isolate was also sequenced and phylogenetically classified.
Conclusions: This dataset can serve as a valuable resource for profiling the SARS-CoV-2 transcriptome dynamics, the virus-host interactions, and the RNA base modifications. Comparison of expression profiles of the host gene in the virally infected and in noninfected cells at different time points allows making a distinction between the effect of the aging of cells in culture and the viral infection. These data can provide useful information for potential novel gene annotations and can also be used for studying the currently available bioinformatics pipelines.
Keywords: MinION system; Oxford Nanopore Technologies; SARS-CoV-2; coronavirus; direct RNA sequencing; direct cDNA sequencing; full-length transcriptome; long-read sequencing.
© The Author(s) 2022. Published by Oxford University Press GigaScience.
Conflict of interest statement
The authors declare that there are no conflicts of interest.
Figures
Similar articles
-
Host-Virus Chimeric Events in SARS-CoV-2-Infected Cells Are Infrequent and Artifactual.J Virol. 2021 Jul 12;95(15):e0029421. doi: 10.1128/JVI.00294-21. Epub 2021 Jul 12. J Virol. 2021. PMID: 33980601 Free PMC article.
-
In-depth Temporal Transcriptome Profiling of Monkeypox and Host Cells using Nanopore Sequencing.Sci Data. 2023 May 9;10(1):262. doi: 10.1038/s41597-023-02149-4. Sci Data. 2023. PMID: 37160911 Free PMC article.
-
Universal whole-genome Oxford nanopore sequencing of SARS-CoV-2 using tiled amplicons.Sci Rep. 2023 Jun 26;13(1):10334. doi: 10.1038/s41598-023-37588-x. Sci Rep. 2023. PMID: 37365249 Free PMC article.
-
The role of microRNAs in modulating SARS-CoV-2 infection in human cells: a systematic review.Infect Genet Evol. 2021 Jul;91:104832. doi: 10.1016/j.meegid.2021.104832. Epub 2021 Apr 1. Infect Genet Evol. 2021. PMID: 33812037 Free PMC article.
-
Experimental and computational methods for studying the dynamics of RNA-RNA interactions in SARS-COV2 genomes.Brief Funct Genomics. 2024 Jan 18;23(1):46-54. doi: 10.1093/bfgp/elac050. Brief Funct Genomics. 2024. PMID: 36752040 Free PMC article. Review.
Cited by
-
KSHV 3.0: a state-of-the-art annotation of the Kaposi's sarcoma-associated herpesvirus transcriptome using cross-platform sequencing.mSystems. 2024 Feb 20;9(2):e0100723. doi: 10.1128/msystems.01007-23. Epub 2024 Jan 11. mSystems. 2024. PMID: 38206015 Free PMC article.
-
Targeted DNA-seq and RNA-seq of Reference Samples with Short-read and Long-read Sequencing.Sci Data. 2024 Aug 16;11(1):892. doi: 10.1038/s41597-024-03741-y. Sci Data. 2024. PMID: 39152166 Free PMC article.
References
Publication types
MeSH terms
Substances
LinkOut - more resources
Full Text Sources
Medical
Miscellaneous
