. 2022 Nov 2;82(21):3888-3902.
doi: 10.1158/0008-5472.CAN-22-1123.

The 5-Hydroxymethylcytosine Landscape of Prostate Cancer

Martin Sjöström #  1   2   3 Shuang G Zhao #  4   5 Samuel Levy #  6 Meng Zhang #  1   2 Yuhong Ning  6 Raunak Shrestha  1   2 Arian Lundberg  1   2 Cameron Herberts  7 Adam Foye  1   8 Rahul Aggarwal  1   8 Junjie T Hua  1   2 Haolong Li  1   2 Anna Bergamaschi  6 Corinne Maurice-Dror  7   9 Ashutosh Maheshwari  1   2 Sujun Chen  10   11 Sarah W S Ng  7 Wenbin Ye  10   11   12 Jessica Petricca  10   11 Michael Fraser  11   13 Lisa Chesner  1   2 Marc D Perry  1   2 Thaidy Moreno-Rodriguez  1   2 William S Chen  1   2 Joshi J Alumkal  14 Jonathan Chou  1   8 Alicia K Morgans  15 Tomasz M Beer  16 George V Thomas  16   17 Martin Gleave  7 Paul Lloyd  6 Tierney Phillips  6 Erin McCarthy  6 Michael C Haffner  18   19 Amina Zoubeidi  7 Matti Annala  7   20 Robert E Reiter  21   22 Matthew B Rettig  21   22   23 Owen N Witte  24 Lawrence Fong  1   8 Rohit Bose  1   8   25   26 Franklin W Huang  1   8 Jianhua Luo  27 Anders Bjartell  28   29 Joshua M Lang  30 Nupam P Mahajan  31 Primo N Lara  32   33 Christopher P Evans  33   34 Phuoc T Tran  35 Edwin M Posadas  36 Chuan He  37   38 Xiao-Long Cui  37   38 Jiaoti Huang  39 Wilbert Zwart  40 Luke A Gilbert  1   25   41 Christopher A Maher  31   42   43   44 Paul C Boutros  10   45   46 Kim N Chi  7 Alan Ashworth  1   8 Eric J Small  1   8 Housheng H He #  10   11 Alexander W Wyatt #  7   47 David A Quigley #  1   25   48 Felix Y Feng #  1   2   8   25
Affiliations

The 5-Hydroxymethylcytosine Landscape of Prostate Cancer

Martin Sjöström et al. Cancer Res. .

Abstract

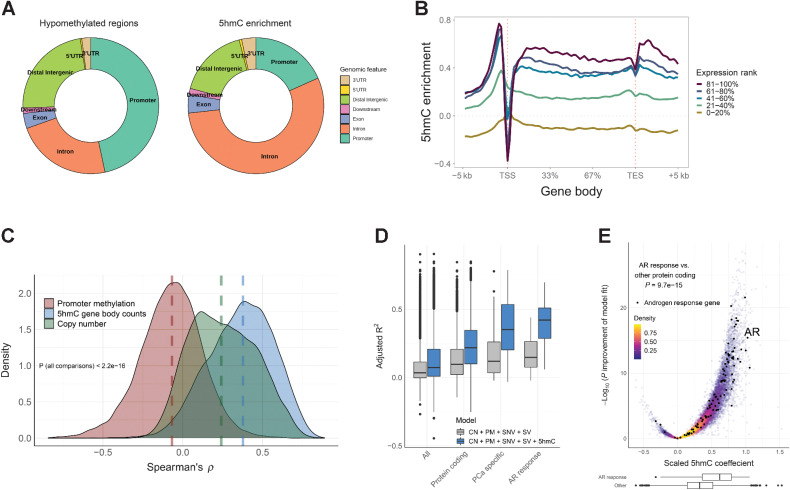
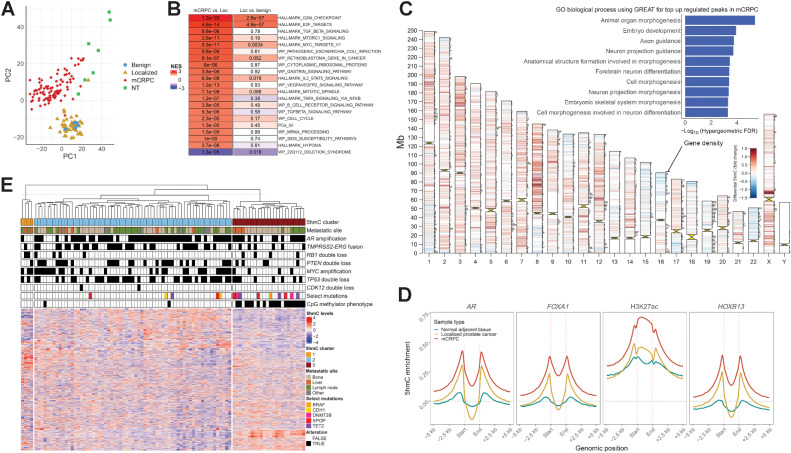
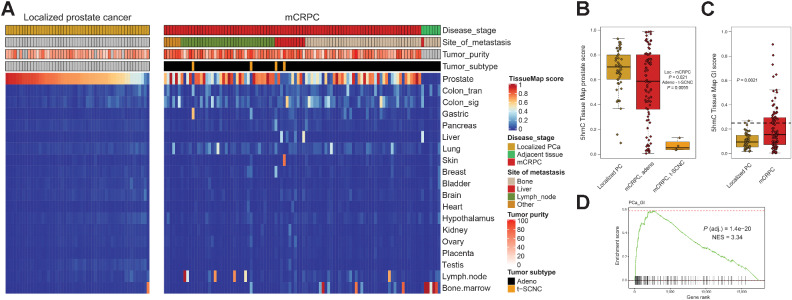
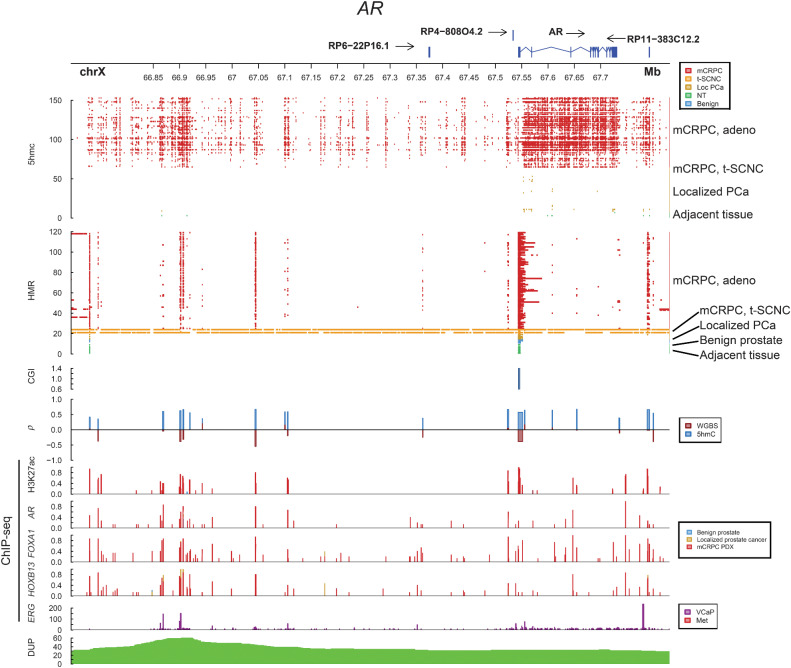
Analysis of DNA methylation is a valuable tool to understand disease progression and is increasingly being used to create diagnostic and prognostic clinical biomarkers. While conversion of cytosine to 5-methylcytosine (5mC) commonly results in transcriptional repression, further conversion to 5-hydroxymethylcytosine (5hmC) is associated with transcriptional activation. Here we perform the first study integrating whole-genome 5hmC with DNA, 5mC, and transcriptome sequencing in clinical samples of benign, localized, and advanced prostate cancer. 5hmC is shown to mark activation of cancer drivers and downstream targets. Furthermore, 5hmC sequencing revealed profoundly altered cell states throughout the disease course, characterized by increased proliferation, oncogenic signaling, dedifferentiation, and lineage plasticity to neuroendocrine and gastrointestinal lineages. Finally, 5hmC sequencing of cell-free DNA from patients with metastatic disease proved useful as a prognostic biomarker able to identify an aggressive subtype of prostate cancer using the genes TOP2A and EZH2, previously only detectable by transcriptomic analysis of solid tumor biopsies. Overall, these findings reveal that 5hmC marks epigenomic activation in prostate cancer and identify hallmarks of prostate cancer progression with potential as biomarkers of aggressive disease.

Significance: In prostate cancer, 5-hydroxymethylcytosine delineates oncogene activation and stage-specific cell states and can be analyzed in liquid biopsies to detect cancer phenotypes. See related article by Wu and Attard, p. 3880.


Figures

Figure 1. 5hmC levels are enriched in gene bodies and independently associated with gene expression in mCRPC. A, Location of hypomethylated regions defined by whole-genome bisulfite sequencing and location of 5hmC enrichment (peaks called by MACS2). Regions were mapped to Gencode v.28 transcripts per sample and the frequencies averaged across 93 mCRPC samples. B, 5hmC enrichment in and around gene bodies for different gene expression levels. Protein coding genes were assigned to expression quintile per sample and log2 5hmC enrichment over input control (similar to low-pass WGS without 5hmC enrichment) was calculated using the NGSplot tool (32). 5hmC enrichment was then averaged across 93 mCRPC samples. C, Correlation between promoter methylation (average CpG methylation by whole-genome bisulfite sequencing), gene copy number, and 5hmC gene body counts, and gene expression, respectively, for protein coding genes across the 93 mCRPC samples. Genes with missing data or with no RNA-seq counts were excluded. Dashed lines represent median correlation per data type. D, Gene expression was modeled for each gene by promoter methylation (PM), copy number (CN), single-nucleotide variants (SNV), structural variants (SV) and 5hmC gene body counts (5hmC). Gene expression and 5hmC gene body counts were scaled (transformed to Z-score) to give comparable coefficients. Grey boxes represent the adjusted R-square of the model without 5hmC while the blue boxes represent the adjusted R-square of the model including 5hmC. Analysis was done for 93 mCRPC samples. Boxplot shows median with hinges at 25th and 75th percentiles and whiskers at largest/smallest value within 1.5 * inter quartile range. E, The adjusted 5hmC coefficients for individual genes modeled as in d). Genes in the Hallmark Androgen Response pathway are labeled black. P-value was calculated by two-sided Wilcoxon rank-sum test for difference in scaled 5hmC coefficients between genes in the androgen response pathway including AR (N = 98) and all other protein coding genes (N = 18,434). Boxplots show distribution of AR response genes vs. other protein coding genes.
Figure 1.
5hmC levels are enriched in gene bodies and are independently associated with gene expression in mCRPC. A, Location of hypomethylated regions defined by whole-genome bisulfite sequencing and location of 5hmC enrichment (peaks called by MACS2). Regions were mapped to Gencode v.28 transcripts per sample and the frequencies averaged across 93 mCRPC samples. B, 5hmC enrichment in and around gene bodies for different gene expression levels. Protein coding genes were assigned to expression quintile per sample and log2 5hmC enrichment over input control (similar to low-pass WGS without 5hmC enrichment) was calculated using the NGSplot tool (32). 5hmC enrichment was then averaged across 93 mCRPC samples. C, Correlation between promoter methylation (average CpG methylation by whole-genome bisulfite sequencing), gene copy number, and 5hmC gene body counts, and gene expression, respectively, for protein coding genes across the 93 mCRPC samples. Genes with missing data or with no RNA-seq counts were excluded. Dashed lines, median correlation per data type. D, Gene expression was modeled for each gene by promoter methylation (PM), copy number (CN), SNVs, SVs, and 5hmC gene body counts (5hmC). Gene expression and 5hmC gene body counts were scaled (transformed to Z-score) to give comparable coefficients. Gray boxes, adjusted R-square of the model without 5hmC; blue boxes, adjusted R-square of the model including 5hmC. Analysis was done for 93 mCRPC samples. Boxplot shows median with hinges at 25th and 75th percentiles and whiskers at largest/smallest value within 1.5 × interquartile range. E, The adjusted 5hmC coefficients for individual genes modeled as in D. Genes in the Hallmark androgen response pathway are labeled black. P value was calculated by two-sided Wilcoxon rank-sum test for difference in scaled 5hmC coefficients between genes in the androgen response pathway including AR (N = 98) and all other protein coding genes (N = 18,434). Boxplots show distribution of AR response genes vs. other protein coding genes.
Figure 2. 5hmC patterns change at different states and subgroups of prostate cancer. A, Unsupervised visualization of global 5hmC patterns for different prostate cancer states using principal component analysis for gene body counts of the top 10% variable protein coding genes. Benign; benign prostate tissue, Localized; localized prostate cancer, mCRPC; metastatic castration-reisistant prostate cancer, NT; normal adjacent tissue (to mCRPC biopsy). B, Differential 5hmC gene body analysis between mCRCP (N = 93) and localized prostate cancer (N = 52), and localized prostate cancer and benign prostate (N = 5), respectively. Genes were ranked by the DESeq2 statistic and further analyzed by GSEA. Color represents the normalized enrichment score (NES) and adjusted p-values are shown for each pathway and state transition. Top significant pathways are shown. C, Differential 5hmC analysis for consensus peaks between localized prostate cancer and mCRPC. 5hmC peaks called by MACS2 for each sample were unified to a consensus set of peaks and used for differential analysis. Peaks with significant differences (FDR < 0.00001) are visualized per chromosome; red indicates upregulation in mCRPC and blue represents downregulation in mCRPC. Horizontal bars on chromosomes represent protein coding gene density. The most significant upregulated peaks (FDR < 0.001 and fold change > 1.5) in mCRPC were further analyzed by the GREAT tool for gene ontology biological processes, and the top 10 enriched biological processes by the hypergeometric test are shown as an insert (44). D, 5hmC enrichment at AR, FOXA1, HOXB13 and H3K27ac sites previously reported in mCRPC xenografts (21). 5hmC enrichment was calculated per sample and then averaged for localized prostate cancer (N = 52), normal adjacent tissue to mCRPC biopsies (N = 7), and mCRPC tissue samples (N = 93). E, Unsupervised hierarchical clustering of mCRPC tissue samples using 5hmC gene body counts of the top 10% most variable protein coding genes. Other means other metastatic soft tissue site. CMP; CpG methylator phenotype, NES; normalized enrichment score, Loc; Localized prostate cancer.
Figure 2.
5hmC patterns change at different states and subgroups of prostate cancer. A, Unsupervised visualization of global 5hmC patterns for different prostate cancer states using principal component analysis for gene body counts of the top 10% variable protein coding genes. Benign, benign prostate tissue; Localized, localized prostate cancer; NT, normal adjacent tissue (to mCRPC biopsy). B, Differential 5hmC gene body analysis between mCRCP (N = 93) and localized prostate cancer (N = 52), and localized prostate cancer and benign prostate (N = 5), respectively. Genes were ranked by the DESeq2 statistic and further analyzed by GSEA. Color represents the normalized enrichment score (NES) and adjusted P values are shown for each pathway and state transition. Top significant pathways are shown. C, Differential 5hmC analysis for consensus peaks between localized prostate cancer and mCRPC. 5hmC peaks called by MACS2 for each sample were unified to a consensus set of peaks and used for differential analysis. Peaks with significant differences (FDR < 0.00001) are visualized per chromosome. Red, upregulation in mCRPC; blue, downregulation in mCRPC. Horizontal bars on chromosomes represent protein coding gene density. The most significant upregulated peaks (FDR < 0.001 and fold change > 1.5) in mCRPC were further analyzed by the GREAT tool for gene ontology biological processes, and the top 10 enriched biological processes by the hypergeometric test are shown as an inset (44). D, 5hmC enrichment at AR, FOXA1, HOXB13, and H3K27ac sites previously reported in mCRPC xenografts (21). 5hmC enrichment was calculated per sample and then averaged for localized prostate cancer (N = 52), normal adjacent tissue to mCRPC biopsies (N = 7), and mCRPC tissue samples (N = 93). E, Unsupervised hierarchical clustering of mCRPC tissue samples using 5hmC gene body counts of the top 10% most variable protein coding genes. Other, other metastatic soft tissue site. CMP, CpG methylator phenotype; Loc, localized prostate cancer.
Figure 3. mCRPC lose prostate 5hmC marks and gain marks indicative of de- and trans differentiation. A, 5hmC Tissue Map scores were calculated for prostate cancer tissue samples predicting similarity to various tissues. Benign; benign prostate tissue, Localized; localized prostate cancer, mCRPC; metastatic castration-reisistant prostate cancer, NT; normal adjacent tissue (to mCRPC biopsy). Other means other metastatic soft tissue site. B, Box and whiskers plot for 5hmC Tissue Map prostate score for localized prostate cancer (N = 52), mCRPC adenocarcinoma (N = 89) and treatment-emergent small cell neuroendocrine prostate cancer (t-SCNC) (N = 4). C, Box and whiskers plot for 5hmC Tissue Map combined gastrointestinal (GI) score (sum of the score in colon, gastric, liver and pancreatic tissue) for localized prostate cancer (N = 52) and mCRPC (N = 93). Horizontal line is drawn at a 5hmC GI score of 0.25, which classifies 4% of localized prostate cancer and 34% of mCRPC as having gained 5hmC GI patterns, similar to what has been previously reported at the gene expression level (42). D, Gene set enrichment analysis for genes ranked by correlation between expression and the 5hmC GI score found the top pathway to be the previously described prostate cancer GI transcriptional signature. t-SCNC, treatment-emergent small cell neuroendocrine prostate cancer, NES; normalized enrichment score Boxplot shows median with hinges at 25th and 75th percentiles and whiskers at largest/smallest value within 1.5 * inter quartile range.
Figure 3.
mCRPC lose prostate 5hmC marks and gain marks indicative of dedifferentiation and transdifferentiation. A, 5hmC tissue map scores were calculated for prostate cancer tissue samples predicting similarity to various tissues. Benign, benign prostate tissue; Localized, localized prostate cancer; NT, normal adjacent tissue (to mCRPC biopsy). Other, other metastatic soft tissue site. B, Box and whiskers plot for 5hmC tissue map prostate score for localized prostate cancer (N = 52), mCRPC adenocarcinoma (N = 89), and t-SCNC (N = 4). C, Box and whiskers plot for 5hmC tissue map combined gastrointestinal (GI) score (sum of the score in colon, gastric, liver and pancreatic tissue) for localized prostate cancer (N = 52) and mCRPC (N = 93). Horizontal line is drawn at a 5hmC GI score of 0.25, which classifies 4% of localized prostate cancer and 34% of mCRPC as having gained 5hmC GI patterns, similar to what has been previously reported at the gene expression level (42). D, GSEA for genes ranked by correlation between expression and the 5hmC GI score found the top pathway to be the previously described prostate cancer GI transcriptional signature. NES, normalized enrichment score. Boxplot shows median with hinges at 25th and 75th percentiles and whiskers at largest/smallest value within 1.5 × interquartile range.
Figure 4. 5hmC marks activity of the Androgen Receptor locus. Integration of multiple layers of data for the AR locus. 5hmC represents peaks called by MACS2 for each sample. HMR; hypomethylated regions called by whole-genome bisulfite sequencing per sample. CGI; CpG islands, ρ; Spearman's correlation between 5hmC peaks and gene expression, and methylation levels by whole-genome bisulfite sequencing, respectively, ChIP-seq; chromatin immunoprecipitation sequencing from publicly available patient samples, patient-derived xenografts and cell lines. DUP; number of mCRPC samples with tandem duplications, PDX; patient-derived xenograft. Benign; benign prostate tissue, Localized; localized prostate cancer, mCRPC; metastatic castration-reisistant prostate cancer, NT; normal adjacent tissue (to mCRPC biopsy).
Figure 4.
5hmC marks activity of the androgen receptor locus. Integration of multiple layers of data for the AR locus. 5hmC represents peaks called by MACS2 for each sample. HMR, hypomethylated regions called by whole-genome bisulfite sequencing per sample. CGI, CpG islands; ρ, Spearman correlation between 5hmC peaks and gene expression, and methylation levels by whole-genome bisulfite sequencing, respectively. ChIP-seq from publicly available patient samples, patient-derived xenografts, and cell lines. DUP, number of mCRPC samples with tandem duplications; PDX, patient-derived xenograft. Benign, benign prostate tissue; Localized, localized prostate cancer; NT, normal adjacent tissue (to mCRPC biopsy); PCa, prostate cancer.
Figure 5. Activating TMPRSS2-ERG fusions and the downstream cistrome are marked by 5hmC. A and B, 5hmC locations and hypomethylation at the ERG and TMPRSS2 loci. 5hmC levels are shown as frequency of samples with a peak called at each position, and hypomethylation as frequency of samples with a hypomethylated region (HMR) called from whole-genome bisulfite sequencing. Samples are split based on the presence of a TMPRSS2-ERG fusion (T2E). Red symbols mark the position of the 3′ and 5′ break-ends for each sample harboring a TMPRSS2-ERG fusion. C, Location of 5hmC peaks are shifted relative to the 3′ break-end in TMPRSS2-ERG fusion positive samples. D, ERG 5hmC gene body levels and gene expression per fusion status (T2E-negative N = 53, T2E-positive N = 40). Two of the T2E-negative samples had a SLC45A3-ERG fusion. E, The top 10 enriched transcription factor binding motifs analyzed by HOMER for loci that have enriched 5hmC levels in TMPRSS2-ERG fusion positive samples. HMR; hypomethylated region, GEX; gene expression, T2E-pos; samples harboring a TMPRSS2-ERG gene fusion, T2E-neg; samples not harboring a TMPRSS2-ERG gene fusion. Boxplot shows median with hinges at 25th and 75th percentiles and whiskers at largest/smallest value within 1.5× inter quartile range.
Figure 5.
Activating TMPRSS2-ERG fusions and the downstream cistrome are marked by 5hmC. A and B, 5hmC locations and hypomethylation at the ERG and TMPRSS2 loci. 5hmC levels are shown as frequency of samples, with a 5hmC peak called by MACS2 at each position and hypomethylation as frequency of samples with a HMR called from whole-genome bisulfite sequencing. Samples are split based on the presence of a TMPRSS2-ERG fusion (T2E). Red symbols mark the position of the 3′ and 5′ break-ends for each sample harboring a TMPRSS2-ERG fusion. C, Location of 5hmC peaks are shifted relative to the 3′ break-end in TMPRSS2-ERG fusion positive samples. D,ERG 5hmC gene body levels and gene expression per fusion status (T2E-negative, N = 53; T2E-positive, N = 40). Two of the T2E-negative samples had a SLC45A3-ERG fusion. E, The top 10 enriched transcription factor binding motifs analyzed by HOMER for loci that have enriched 5hmC levels in TMPRSS2-ERG fusion–positive samples. GEX, gene expression; T2E-pos, samples harboring a TMPRSS2-ERG gene fusion; T2E-neg, samples not harboring a TMPRSS2-ERG gene fusion. Boxplot shows median with hinges at 25th and 75th percentiles and whiskers at largest/smallest value within 1.5 × interquartile range.
Figure 6. Concordance of 5hmC patterns in 15 matched tissue and cell-free DNA samples. A, Tissue Map scores for 15 cell-free DNA samples with matched tissue 5hmC-sequencing available. Predicted ct-fraction is determined using a novel 5hmC-classifier. Patients DTB-149 and DTB-216 had two paired samples at two different timepoints available with 5hmC-sequencing, but not other data modalities and were thus included in this paired analysis but not in integrative analyses. B, Scatterplot for Tissue Map 5hmC GI-score in tissue and cell-free DNA for the 15 matched pairs of samples. C, Spearman's correlation between tissue 5hmC gene body counts and cell-free DNA gene body counts. Blue dashed line represents median correlation. D, Box and whiskers plot showing correlation for 5hmC gene body counts in tissue and cell-free DNA for matched pairs (N = 15, blue box) and for average correlation to non-matched pairs (N = 15, red box). E, Scatterplot for sample similarity of matched tissue and cell-free DNA samples (N = 15) measured by Spearman correlation for 5hmC gene body counts of protein coding genes and predicted ct-fraction by 5hmC levels. F, Hierarchical clustering of matched 5hmC gene body counts in tissue and cell-free DNA samples using the top 10% most variable genes. Scaling (z-scores) was performed separately for cfDNA and tissue-derived samples. ct-fraction/purity is estimated from 5hmC-sequencing (cfDNA samples) or from WGS (tissue). Boxplot shows median with hinges at 25th and 75th percentiles and whiskers at largest/smallest value within 1.5× inter quartile range.
Figure 6.
Concordance of 5hmC patterns in 15 matched tissue and cfDNA samples. A, Tissue map scores for 15 cfDNA samples with matched tissue 5hmC-sequencing available. Predicted ct-fraction was determined using a novel 5hmC-classifier. Patients DTB-149 and DTB-216 had two paired samples at two different time points available with 5hmC sequencing, but not other data modalities and were thus included in this paired analysis but not in integrative analyses. B, Scatterplot for tissue map 5hmC GI-score in tissue and cfDNA for the 15 matched pairs of samples. C, Spearman correlation between tissue 5hmC gene body counts and cfDNA gene body counts. Blue dashed line, median correlation. D, Box and whiskers plot showing correlation for 5hmC gene body counts in tissue and cfDNA for matched pairs (N = 15, blue box) and for average correlation to nonmatched pairs (N = 15, red box). E, Scatterplot for sample similarity of matched tissue and cfDNA samples (N = 15) measured by Spearman correlation for 5hmC gene body counts of protein coding genes and predicted ct-fraction by 5hmC levels. F, Hierarchical clustering of matched 5hmC gene body counts in tissue and cfDNA samples using the top 10% most variable genes. Scaling (z-scores) was performed separately for cfDNA and tissue-derived samples. ct-fraction/purity is estimated from 5hmC-sequencing (cfDNA samples) or from WGS (tissue). Boxplot shows median with hinges at 25th and 75th percentiles and whiskers at largest/smallest value within 1.5 × interquartile range.
Figure 7. 5hmC in cell-free DNA of patients with mCRPC. A, 5hmC Tissue Map scores for each of the 64 cfDNA samples taken before first-line androgen receptor signaling inhibitor (enzalutamide or abiraterone) for mCRPC. Circulating tumor fraction (ct-fraction) was estimated from a targeted cfDNA sequencing panel and by 5hmC-seq using a novel classifier based on gene body 5hmC counts. B, Overall survival for patients split by tertiles of 5hmC predicted ct-fraction. C, Overall survival based on the number of genomic events inferred by 5hmC gene body counts of the eight most commonly altered genes by targeted cfDNA sequencing. Oncogenes (AR, MYC, NCOA2) was considered gained if 5hmC gene body counts were in the upper quartile across samples, and tumor-suppressor genes (RB1, PTEN, TP53, BRCA2, NKX3-1) were considered lost if 5hmC gene body counts were in the lowest quartile. Kaplan-Meier curves are visualized for 0–1, 2–3 and >3 events, and hazard ratios are calculated as mean for each additional event inferred. D, Overall survival based on 5hmC gene body levels of TOP2A and EZH2. Levels are split by quartiles across samples and survival is contrasted between samples being in the top quartile for none, either or both TOP2A and EZH2, as previously described for tissue gene expression (61). P values were calculated by two-sided Wald test. Adjusted HRs are adjusted for ct-fraction, age at mCRPC diagnosis, PSA at first-line ARSI, Hb at first-line ARSI, type of ARSI (enzalutamide or abiraterone), docetaxel for metastatic hormone-sensitive prostate cancer, time to CRPC from start of ADT and presence of visceral metastases.
Figure 7.
5hmC in cell-free DNA of patients with mCRPC. A, 5hmC tissue map scores for each of the 64 cfDNA samples taken before first-line androgen receptor signaling inhibitor (enzalutamide or abiraterone) for mCRPC. Circulating tumor fraction (ct-fraction) was estimated from a targeted cfDNA sequencing panel and by 5hmC-seq using a novel classifier based on gene body 5hmC counts. B, Overall survival for patients split by tertiles of 5hmC predicted ct-fraction. C, Overall survival based on the number of genomic events inferred by 5hmC gene body counts of the eight most commonly altered genes by targeted cfDNA sequencing. Oncogenes (AR, MYC, NCOA2) were considered gained if 5hmC gene body counts were in the upper quartile across samples, and tumor-suppressor genes (RB1, PTEN, TP53, BRCA2, NKX3-1) were considered lost if 5hmC gene body counts were in the lowest quartile. Kaplan-Meier curves are visualized for 0–1, 2–3 and >3 events, and HRs are calculated as mean for each additional event inferred. D, Overall survival based on 5hmC gene body levels of TOP2A and EZH2. Levels are split by quartiles across samples and survival is contrasted between samples being in the top quartile for none, either, or both TOP2A and EZH2, as previously described for tissue gene expression (61). P values were calculated by two-sided Wald test. Adjusted HRs are adjusted for ct-fraction, age at mCRPC diagnosis, PSA at first-line ARSI, Hb at first-line ARSI, type of ARSI (enzalutamide or abiraterone), docetaxel for metastatic hormone-sensitive prostate cancer, time to CRPC from start of ADT, and presence of visceral metastases.

Comment in

  • Accidentals of the DNA Symphony.
    Wu A, Attard G. Wu A, et al. Cancer Res. 2022 Nov 2;82(21):3880-3881. doi: 10.1158/0008-5472.CAN-22-2750. Cancer Res. 2022. PMID: 36321266

References

    1. Skvortsova K, Stirzaker C, Taberlay P. The DNA methylation landscape in cancer. Essays Biochem 2019;63:797–811. - PMC - PubMed
    1. Tahiliani M, Koh KP, Shen Y, Pastor WA, Bandukwala H, Brudno Y, et al. Conversion of 5-methylcytosine to 5-hydroxymethylcytosine in mammalian DNA by MLL partner TET1. Science 2009;324:930–5. - PMC - PubMed
    1. Stroud H, Feng S, Morey Kinney S, Pradhan S, Jacobsen SE. 5-Hydroxymethylcytosine is associated with enhancers and gene bodies in human embryonic stem cells. Genome Biol 2011;12:R54. - PMC - PubMed
    1. Song CX, Szulwach KE, Fu Y, Dai Q, Yi C, Li X, et al. Selective chemical labeling reveals the genome-wide distribution of 5-hydroxymethylcytosine. Nat Biotechnol 2011;29:68–72. - PMC - PubMed
    1. Xu Y, Wu F, Tan L, Kong L, Xiong L, Deng J, et al. Genome-wide regulation of 5hmC, 5mC, and gene expression by Tet1 hydroxylase in mouse embryonic stem cells. Mol Cell 2011;42:451–64. - PMC - PubMed

Publication types