. 2022 Nov;21(11):e13714.
doi: 10.1111/acel.13714. Epub 2022 Oct 17.

A single short reprogramming early in life initiates and propagates an epigenetically related mechanism improving fitness and promoting an increased healthy lifespan

Affiliations

A single short reprogramming early in life initiates and propagates an epigenetically related mechanism improving fitness and promoting an increased healthy lifespan

Quentin Alle et al. Aging Cell. 2022 Nov.

Abstract

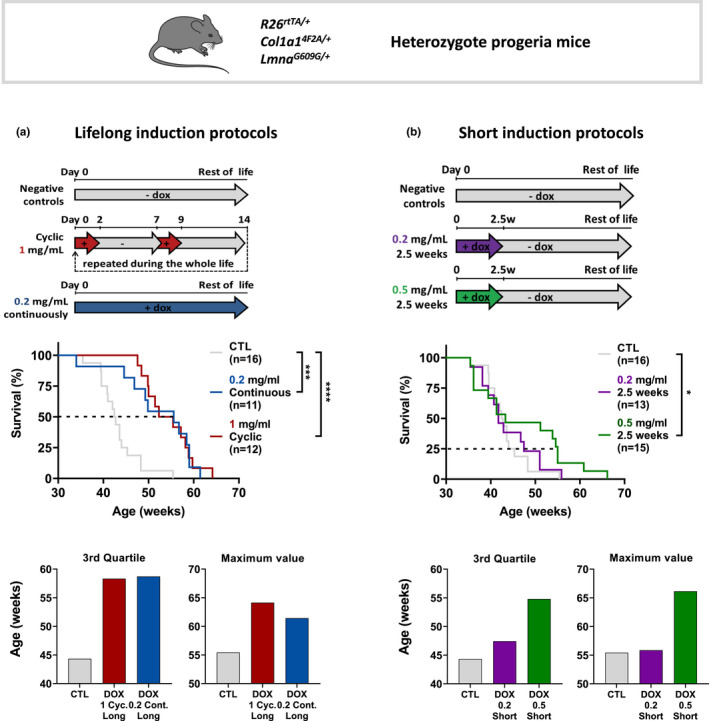
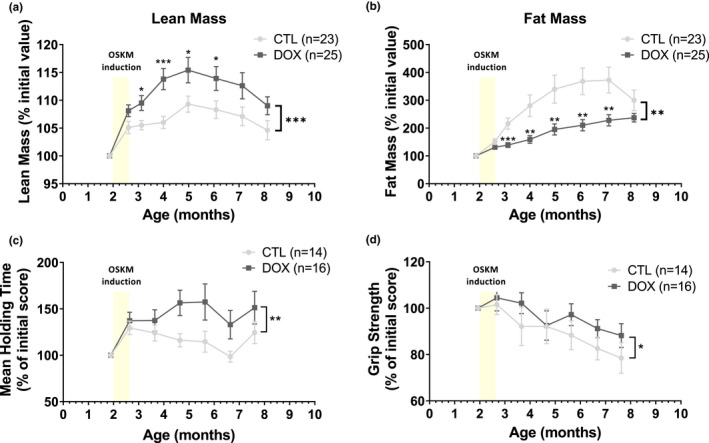
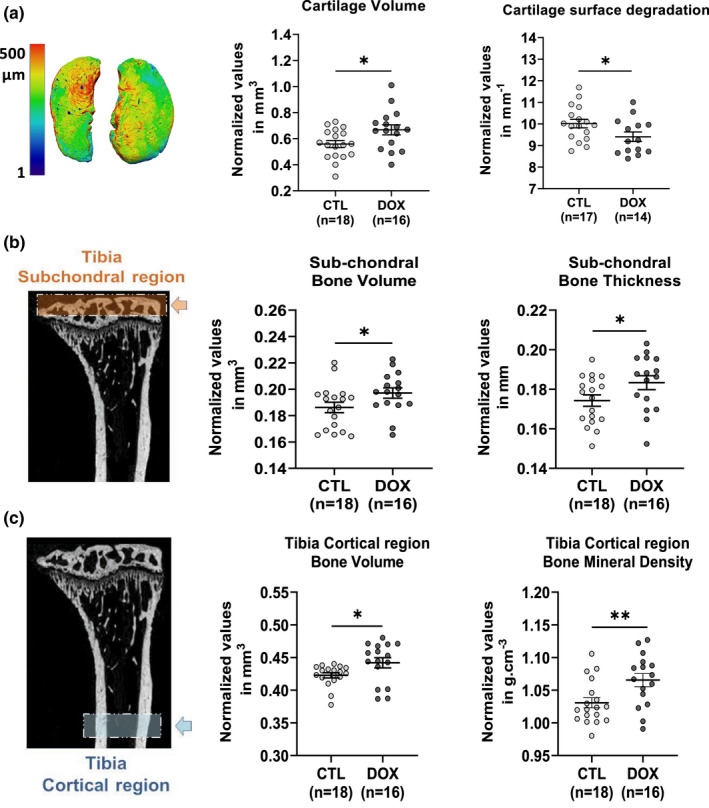
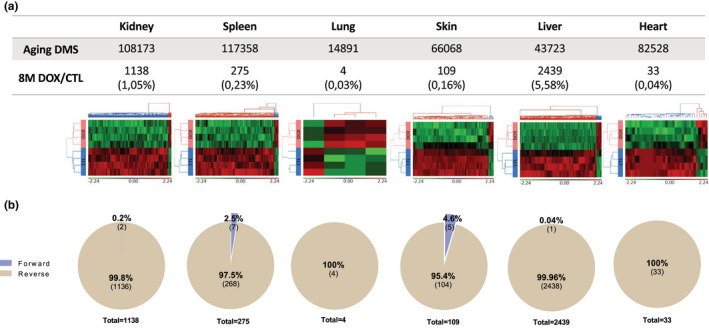
Recent advances in cell reprogramming showed that OSKM induction is able to improve cell physiology in vitro and in vivo. Here, we show that a single short reprogramming induction is sufficient to prevent musculoskeletal functions deterioration of mice, when applied in early life. In addition, in old age, treated mice have improved tissue structures in kidney, spleen, skin, and lung, with an increased lifespan of 15% associated with organ-specific differential age-related DNA methylation signatures rejuvenated by the treatment. Altogether, our results indicate that a single short reprogramming early in life might initiate and propagate an epigenetically related mechanism to promote a healthy lifespan.

Keywords: aging; epigenetics; longevity; metabolism; transient reprogramming.


Conflict of interest statement

The authors declare that they have no competing interests.

Figures

FIGURE 1
FIGURE 1
Single short transient OSKM induction applied early in life, increases late age lifespan in heterozygous progeric mice. (a) Scheme of the long‐term OSKM induction protocols for R26rtTA/+; Col1a14F2A/+; LmnaG609G/+ heterozygous progeric mice, by administrating 1 mg/ml doxycycline in the drinking water chronically 2 days a week (red curve), started at 2 months old and maintained over the entire life, or 0.2 mg/ml docycycline administrated continuously (blue curve). Survival curves of long‐term doxycycline‐treated mice compared to untreated mice (gray curve) with the same genotype are presented. Statistical analysis of curves was performed at the corresponding indicated percent survival. Median survival for the 3rd quartile and maximum lifespan value is presented. (b) Short‐term OSKM induction protocols were performed on progeric R26rtTA/+;Col1a14F2A/+;LmnaG609G/+ mice, by administrating doxycycline in the drinking water for 2.5 weeks either at 0.2 mg/ml (purple curve) or at 0.5 mg/ml (green curve). Inductions start at 2 months old. Survival curves of short‐term doxycycline‐treated mice after induction compared to untreated mice with the same genotype are presented. Statistical analysis of curves was performed at the corresponding indicated percent survival. Median survival for the 3rd quartile and maximum lifespan value is presented. *p = 0.0113, ***p = 0.0003, ****p < 0.0001; according to log‐rank (mantel‐cox) test.
FIGURE 2
FIGURE 2
Single OSKM induction early in life induces healthier body composition and improves lifelong muscular capacities in progeric mice. (a) Body lean mass composition of treated heterozygotes progeric mice with 0.5 mg/ml doxycycline (DOX) for 2.5 weeks at the age of 2 months, compared with untreated controls (CTL) measured by EchoMRI‐700. Results are expressed in percentage of total individual weight. *p‐value <0.05, ***p‐value <0.001 according to multiple t test for 1 vs 1 comparisons and paired t test for whole curves. (b) Body fat mass composition through over life measured by EchoMRI‐700. Results are expressed in percentage of total individual weight. **p‐value <0.01, ***p‐value <0.001 according to multiple t test for 1 vs 1 comparisons and paired t test for whole curves. (c) Rotarod assay. Maximal time to fall (strength endurance) compared to initial individual score. **p‐value <0.01 is according to paired t test on whole curves. (d) Maximal grip strength compared to initial individual score. *p‐value <0.05 is according to paired t test on whole curves. The period of treatment in mentioned in each graph as a yellow bar ±DOX.
FIGURE 3
FIGURE 3
Tissue structure and age‐related tissue fibrosis are improved in aging by a single OSKM induction early in life. (a) Quantifications of skin layers thickness. D., dermis; Ep., epidermis; F.S.S.L., fat subcutaneous superficial layer; P.C., panniculus carnosus. HES staining, 150 μm scale. (b) Morphologic comparison of lung structure (on top) and fibrosis (on bottom) in treated and untreated mice. Scoring of fibrosis level is as described in methods. On top: HES staining, 150 μm scale. On bottom: MT staining, 75 μm scale. (c) Morphologic comparison of spleen marginal zone (MZ) architecture (on top and middle) and white pulp fibrosis (on bottom). The MZ/white pulp interface distortion is depicted by the inner line and the percent of radius involvement (MZ protruding into the white pulp area) is depicted by arrows and scoring was determined as described methods. On top: HES staining, 150 μm scale. In middle: HES staining, 75 μm. On bottom: SR staining, 37.5 μm scale. (d) Measurement of kidney's fractional mesangial area (on top and middle), representing the space surrounding glomeruli (depicted by arrows) and inter‐tubular fibrosis (on bottom). On top: HES staining, 75 μm scale. In middle: HES staining, 37.5 μm. On bottom: SR staining, 37.5 μm scale. All tissues were analyzed on 8‐month‐old heterozygous progeric mice. CTL represents untreated mice and DOX represents treated mice with 0.5 mg/ml doxycycline for 2.5 weeks at the age of 2 months. All Measurements of areas and distances were performed on ImageJ software. The fibrosis was scored as described in the methods. ****p < 0.0001; ***p < 0.001; **p < 0.01; *p < 0.05 is according to unpaired t test, two‐tailed.
FIGURE 4
FIGURE 4
Single short OSKM induction early in life prevents osteoarthritis and osteoporosis in aged mice. (a) Histomorphometric analysis of 3D images of knee joint cartilage by confocal laser scanning microscopy (CLSM). Cartilage volume, and surface degradation were measured in the lateral and medial plateau. *p < 0.05 is according to unpaired t test, two‐tailed. (b) X‐ray micro‐computed tomography (μ‐CT). Histomorphometric analysis of left tibia subchondral bone, in the knee joint (orange box and arrow). Subchondral bone volume and thickness were measured in the lateral and medial plateau. (c) μ‐CT histomorphometric analysis of tibia cortical region (blue box and arrow). Cortical bone volume and mineral density were measured on both tibias. Bone and cartilage tissues were analyzed on 8 months heterozygous progeric mice. CTL represents untreated mice and DOX represents treated mice with 0.5 mg/ml doxycycline during 2.5 weeks at the age of 2 months. For μCT analysis, **p < 0.01; *p < 0.05 is according to unpaired t test, one‐tailed, with Welch's correction.
FIGURE 5
FIGURE 5
Differential methylation analysis reveals tissue‐specific modified DMS by a single short OSKM induction early in life, counteracting partially their aging drift. (a) Supervised hierarchical clustering of differentially methylated CpG loci between doxycycline‐treated (DOX, n = 4) and control mice (CTL, n = 4) in the 6 selected tissues at 8 months among aging DMS. Loci methylation levels of each CpG are represented by M value (log2 converted β values) which are shifted to mean of zero and scaled to standard deviation of one. Red and green colors represent, respectively, hypermethylated and hypomethylated CpG Loci. Doxycycline and control mice are, respectively, colored in red and blue. Significance level of differences between control and doxycycline‐treated mice was set at p < 0.005 according to one‐way ANOVA test. (b) Proportion of forward and reverse DMS between doxycycline‐treated and control mice among aging DMS. Forward and reverse DMS defined, respectively, whether methylation levels evaluated at 8 months in Doxycycline mice are modified in a similar or opposite way compared to aging methylation process.

References

    1. Abad, M. , Mosteiro, L. , Pantoja, C. , Cañamero, M. , Rayon, T. , Ors, I. , Graña, O. , Megías, D. , Domínguez, O. , Martínez, D. , Manzanares, M. , Ortega, S. , & Serrano, M. (2013). Reprogramming in vivo produces teratomas and iPS cells with totipotency features. Nature, 502(7471), 340–345. 10.1038/nature12586 - DOI - PubMed
    1. Aspray, T. J. , & Hill, T. R. (2019). Osteoporosis and the ageing skeleton. Sub‐Cellular Biochemistry, 91, 453–476. 10.1007/978-981-13-3681-2_16 - DOI - PubMed
    1. Banito, A. , Rashid, S. T. , Acosta, J. C. , Li, S. , Pereira, C. F. , Geti, I. , Pinho, S. , Silva, J. C. , Azuara, V. , Walsh, M. , Vallier, L. , & Gil, J. (2009). Senescence impairs successful reprogramming to pluripotent stem cells. Genes & Development, 23(18), 2134–2139. 10.1101/gad.1811609 - DOI - PMC - PubMed
    1. Birjandi, S. Z. , Ippolito, J. A. , Ramadorai, A. K. , & Witte, P. L. (2011). Alterations in marginal zone macrophages and marginal zone B cells in old mice. Journal of Immunology, 186(6), 3441–3451. 10.4049/jimmunol.1001271 - DOI - PMC - PubMed
    1. Browder, K. C. , Reddy, P. , Yamamoto, M. , Haghani, A. , Guillen, I. G. , Sahu, S. , Wang, C. , Luque, Y. , Prieto, J. , Shi, L. , Shojima, K. , Hishida, T. , Lai, Z. , Li, Q. , Choudhury, F. K. , Wong, W. R. , Liang, Y. , Sangaraju, D. , Sandoval, W. , … Izpisua Belmonte, J. C. (2022). In vivo partial reprogramming alters age‐associated molecular changes during physiological aging in mice. Nature Aging, 2, 243–253. 10.1038/s43587-022-00183-2 - DOI - PubMed

Publication types

LinkOut - more resources