. 2022 Oct 25;119(43):e2200257119.
doi: 10.1073/pnas.2200257119. Epub 2022 Oct 17.

Neural event segmentation of continuous experience in human infants

Affiliations

Neural event segmentation of continuous experience in human infants

Tristan S Yates et al. Proc Natl Acad Sci U S A. .

Abstract

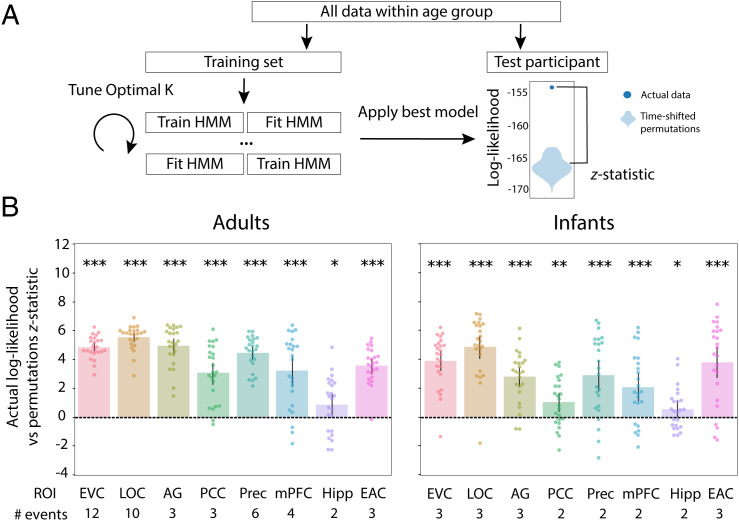
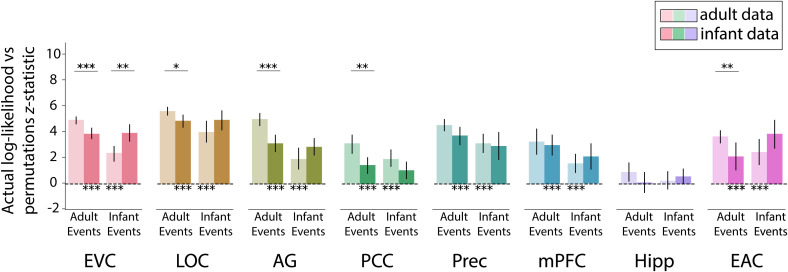
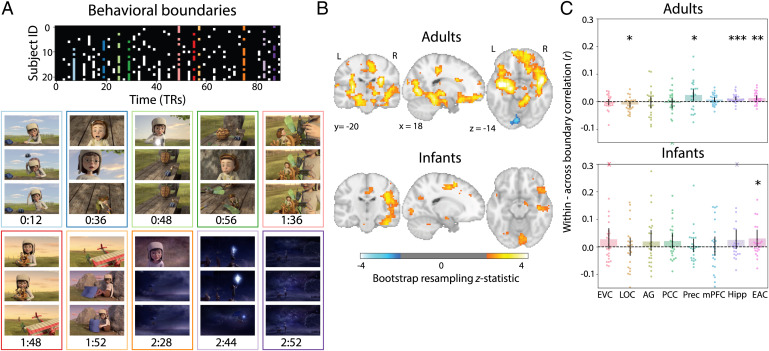
How infants experience the world is fundamental to understanding their cognition and development. A key principle of adult experience is that, despite receiving continuous sensory input, we perceive this input as discrete events. Here we investigate such event segmentation in infants and how it differs from adults. Research on event cognition in infants often uses simplified tasks in which (adult) experimenters help solve the segmentation problem for infants by defining event boundaries or presenting discrete actions/vignettes. This presupposes which events are experienced by infants and leaves open questions about the principles governing infant segmentation. We take a different, data-driven approach by studying infant event segmentation of continuous input. We collected whole-brain functional MRI (fMRI) data from awake infants (and adults, for comparison) watching a cartoon and used a hidden Markov model to identify event states in the brain. We quantified the existence, timescale, and organization of multiple-event representations across brain regions. The adult brain exhibited a known hierarchical gradient of event timescales, from shorter events in early visual regions to longer events in later visual and associative regions. In contrast, the infant brain represented only longer events, even in early visual regions, with no timescale hierarchy. The boundaries defining these infant events only partially overlapped with boundaries defined from adult brain activity and behavioral judgments. These findings suggest that events are organized differently in infants, with longer timescales and more stable neural patterns, even in sensory regions. This may indicate greater temporal integration and reduced temporal precision during dynamic, naturalistic perception.

Keywords: early development; event cognition; fMRI; naturalistic movies; timescale hierarchy.


Conflict of interest statement

The authors declare no competing interest.

Figures

Fig. 1.
Fig. 1.
Average leave-one-out ISC in adults and infants. (A) Voxel-wise ISC values in the two groups, thresholded arbitrarily at a mean correlation value of 0.10 to visualize the distribution across the whole brain. (B) ISC values were significant in both adults and infants across ROIs (except EAC in infants). Dots represent individual participants and error bars represent 95% CIs of the mean from bootstrap resampling. ***P  <  0.001, **P  <  0.01, *P  <  0.05. ROIs: EVC, LOC, AG, PCC, precuneus (Prec), mPFC, hippocampus (Hipp), and EAC.
Fig. 2.
Fig. 2.
Event structure across the adult and infant brain. (A) The optimal number of events for a given voxel was determined via a searchlight across the brain, which found the number of events that maximized the model log-likelihood in held-out data. Voxels with an average ISC value greater than 0.10 are plotted for visualization purposes. In adults, there was a clear difference in the number of events found in early visual regions vs. higher-order associative regions, but this was not present in infants. Instead, there was a flattened hierarchy in the infant brain, with fewer/longer events in both early visual and associative regions. (B) Example timepoint-by-timepoint correlation matrices in EVC and precuneus in the two groups. The model event boundaries found for each age group are outlined in red (EVC) and aqua (precuneus).
Fig. 3.
Fig. 3.
Nested cross-validation of adult and infant age groups. (A) Schematic explaining the nested cross-validation procedure for computing the reliability of event segmentation. (B) Across ROIs and for both adults and infants, the model fit real better than permuted held-out data. The number of events that optimized model log-likelihood in the full sample of participants is labeled below the x axis. Dots represent individual participants and error bars represent 95% CIs of the mean from bootstrap resampling. ***P  <  0.001, **P  <  0.01, *P  <  0.05.
Fig. 4.
Fig. 4.
Reliability of event structure for models learned on participants of the same vs. other age group. Light bars indicate fit of adult and infant event structures to adult data, and dark bars indicate fit of adult and infant event structures to infant data. Note that the fits to the same group (adult events in adults, infant events in infants) are simply replotted from Fig. 3, without duplicating the statistics. Overall, event structures learned from adults and infants fit data from the other group (clearest in EVC and LOC). However, in several regions, these fits were weaker than to data from the same group (clearest in EVC, LOC, AG, PCC, and EAC for adult events and in EVC for infant events). Error bars represent 95% CIs of the mean from bootstrap resampling. ***P  <  0.001, **P  <  0.01, *P  <  0.05.
Fig. 5.
Fig. 5.
Relating behavioral boundaries to neural activity. (A) Matrix showing which behavioral participants indicated the presence of an event boundary at each TR in the movie. The 10 TRs with the highest percentage of agreement robust to response time adjustment were used as event boundaries (colored columns; see Materials and Methods). Movie frames from the TR before, during, and after each event boundary are depicted below for qualitative inspection. (B) Whole-brain searchlight analysis for each age group comparing pattern similarity between timepoints drawn from within vs. across behavioral event boundaries. Bootstrapped z scores are thresholded at P<0.05, uncorrected. (C) ROI analysis of difference in pattern similarity within minus across behavioral events. Dots represent individual participants and error bars represent 95% CIs of the mean from bootstrap resampling. One adult participant with a value beyond the y axis range for PCC is indicated with an X at the negative edge. Infant participants with values beyond the y axis range for EVC and hipppocampus are indicated with Xs at the positive edge. ***P  <  0.001, **P  <  0.01, *P  <  0.05.

References

    1. Roseberry S., Richie R., Hirsh-Pasek K., Golinkoff R. M., Shipley T. F., Babies catch a break: 7- to 9-month-olds track statistical probabilities in continuous dynamic events. Psychol. Sci. 22, 1422–1424 (2011). - PubMed
    1. Stahl A. E., Romberg A. R., Roseberry S., Golinkoff R. M., Hirsh-Pasek K., Infants segment continuous events using transitional probabilities. Child Dev. 85, 1821–1826 (2014). - PMC - PubMed
    1. Bauer P. J., Mandler J. M., One thing follows another: Effects of temporal structure on 1- to 2-year-olds’ recall of events. Dev. Psychol. 25, 197–206 (1989).
    1. Sonne T., Kingo O. S., Krøjgaard P., Bound to remember: Infants show superior memory for objects presented at event boundaries. Scand. J. Psychol. 58, 107–113 (2017). - PubMed
    1. Levine D., Buchsbaum D., Hirsh-Pasek K., Golinkoff R. M., Finding events in a continuous world: A developmental account. Dev. Psychobiol. 61, 376–389 (2019). - PubMed

Publication types

LinkOut - more resources