. 2022 Oct 25;119(43):e2205277119.
doi: 10.1073/pnas.2205277119. Epub 2022 Oct 17.

The ulcerative colitis-associated gene FUT8 regulates the quantity and quality of secreted mucins

Affiliations

The ulcerative colitis-associated gene FUT8 regulates the quantity and quality of secreted mucins

Gerard Cantero-Recasens et al. Proc Natl Acad Sci U S A. .

Abstract

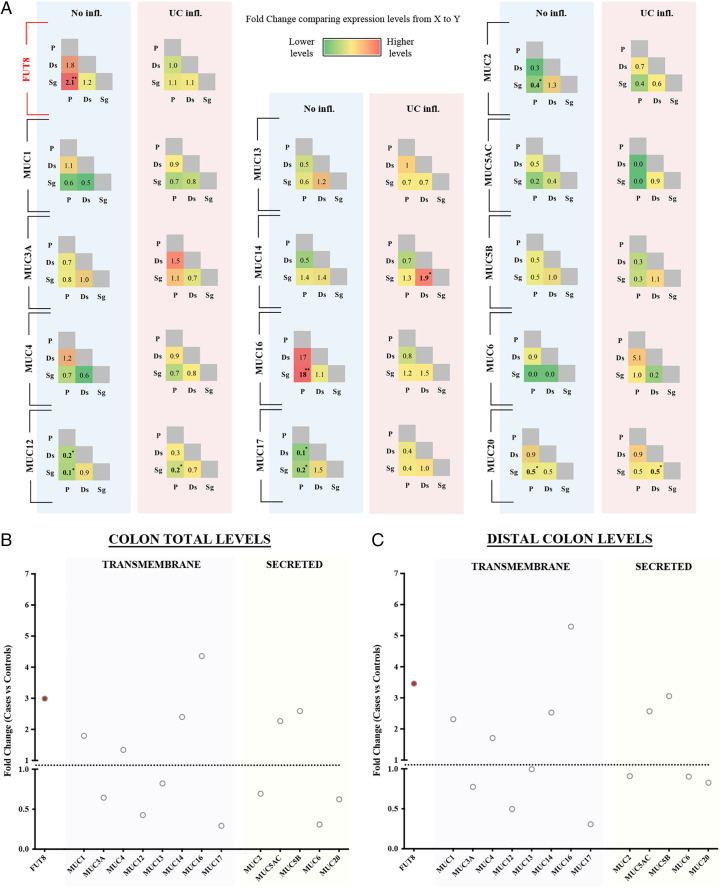
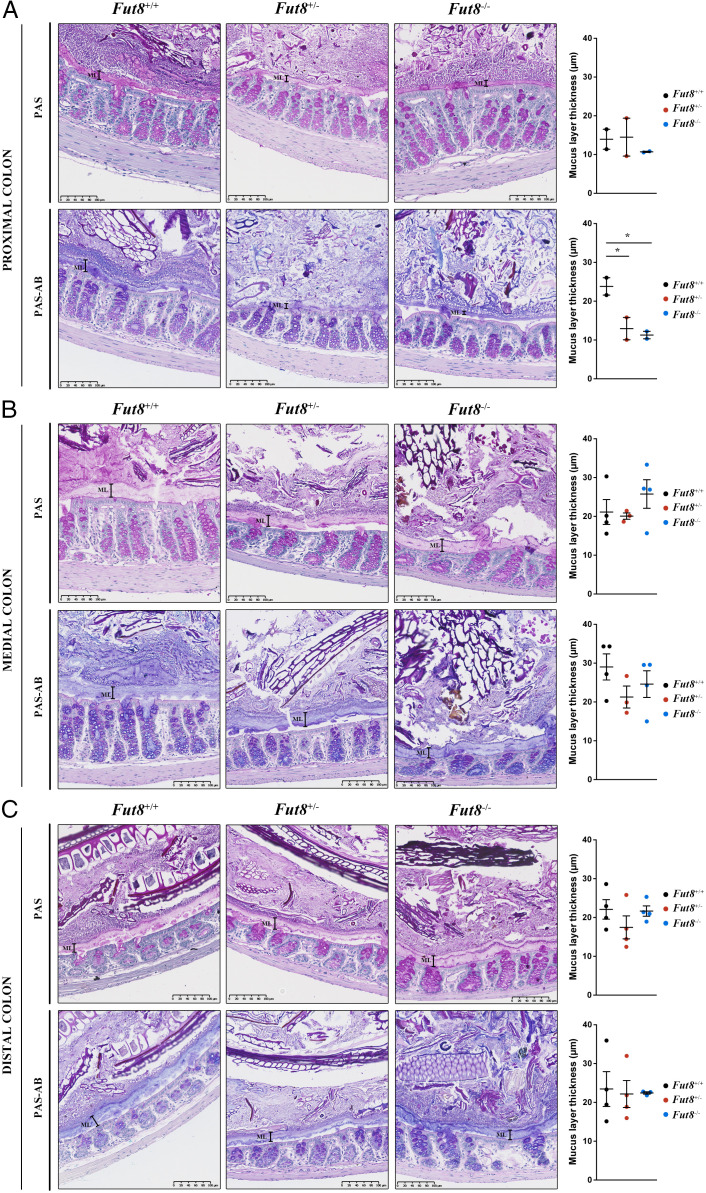
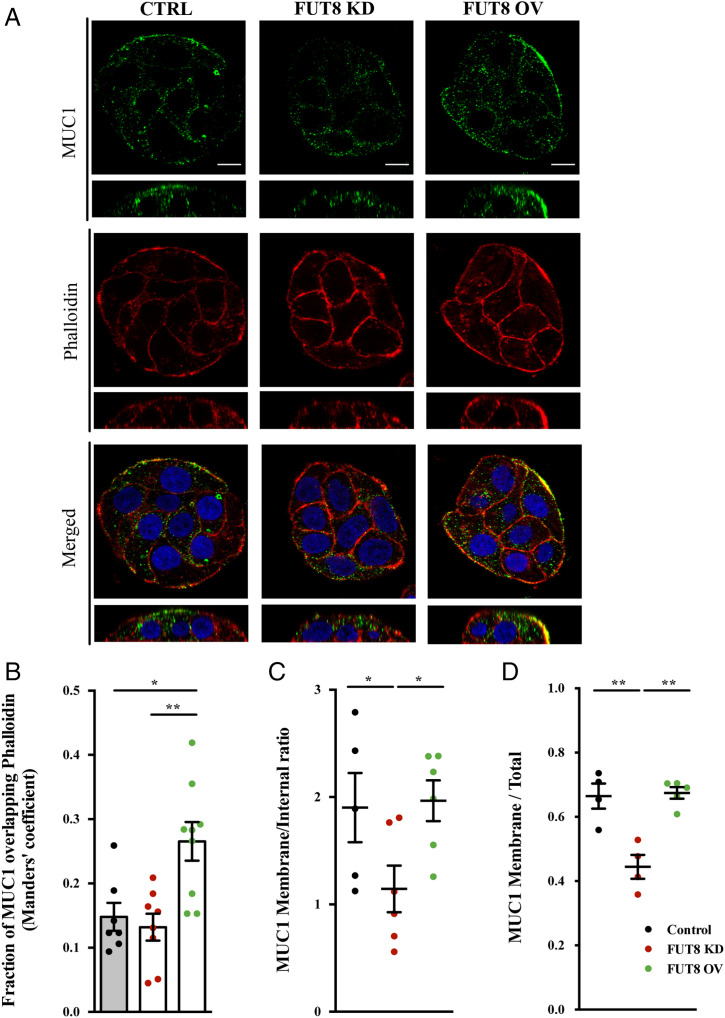
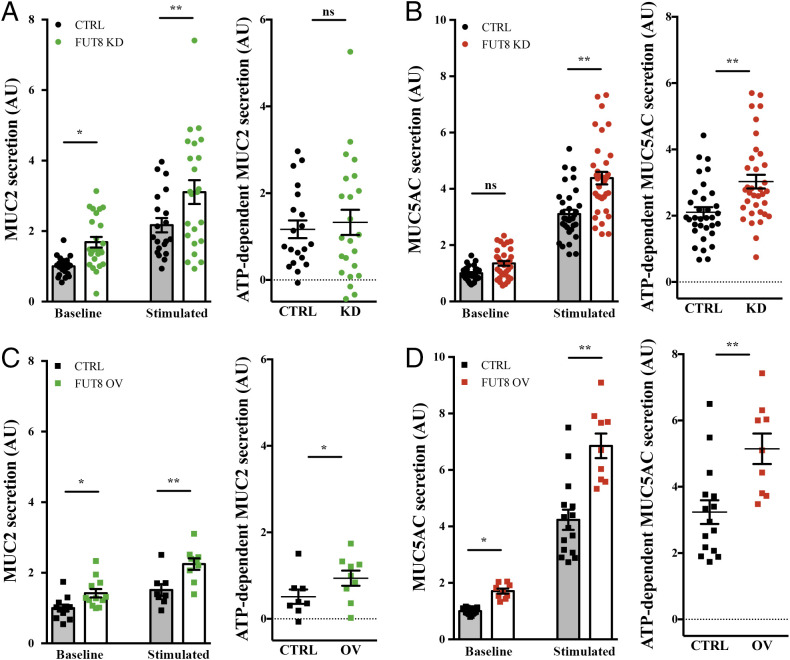
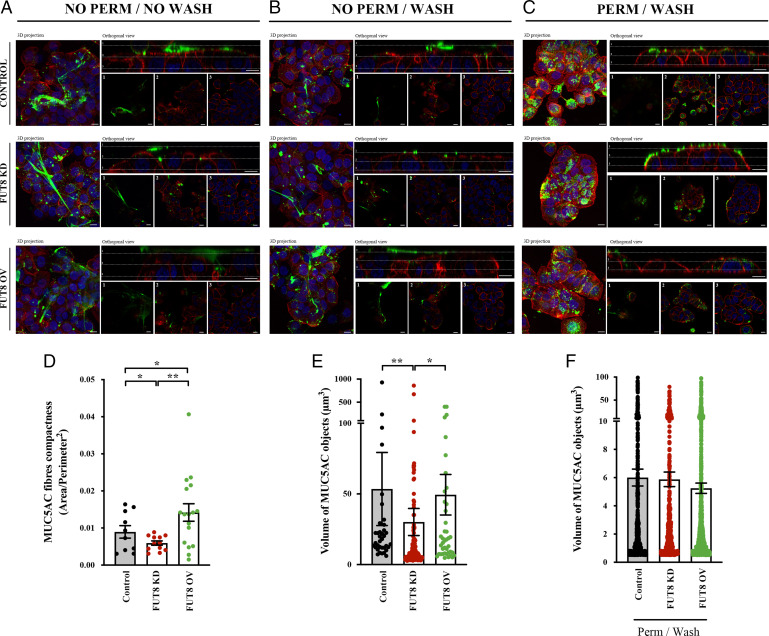
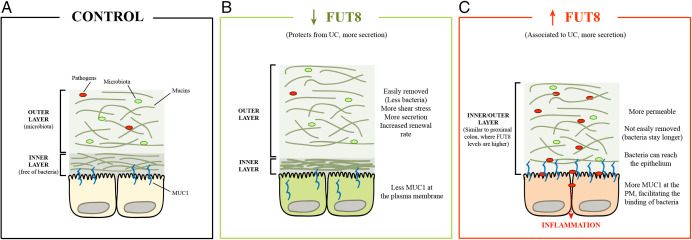
Mucins are the main macrocomponents of the mucus layer that protects the digestive tract from pathogens. Fucosylation of mucins increases mucus viscoelasticity and its resistance to shear stress. These properties are altered in patients with ulcerative colitis (UC), which is marked by a chronic inflammation of the distal part of the colon. Here, we show that levels of Fucosyltransferase 8 (FUT8) and specific mucins are increased in the distal inflamed colon of UC patients. Recapitulating this FUT8 overexpression in mucin-producing HT29-18N2 colonic cell line increases delivery of MUC1 to the plasma membrane and extracellular release of MUC2 and MUC5AC. Mucins secreted by FUT8 overexpressing cells are more resistant to removal from the cell surface than mucins secreted by FUT8-depleted cells (FUT8 KD). FUT8 KD causes intracellular accumulation of MUC1 and alters the ratio of secreted MUC2 to MUC5AC. These data fit well with the Fut8-/- mice phenotype, which are protected from UC. Fut8-/- mice exhibit a thinner proximal colon mucus layer with an altered ratio of neutral to acidic mucins. Together, our data reveal that FUT8 modifies the biophysical properties of mucus by controlling levels of cell surface MUC1 and quantity and quality of secreted MUC2 and MUC5AC. We suggest that these changes in mucus viscoelasticity likely facilitate bacterial-epithelial interactions leading to inflammation and UC progression.

Keywords: FUT8; fucosylation; mucin secretion; ulcerative colitis.


Conflict of interest statement

The authors declare no competing interest.

Figures

Fig. 1.
Fig. 1.
Colonic expression levels of FUT8 and mucins in UC. (A) Expression of FUT8 and mucins was compared between different colonic locations (P: proximal -ascending- colon, Ds: descending colon, Sg: sigmoid colon) in control subjects and UC patients. Data are shown as fold-change between locations of the x axis vs. the y axis. (B) Total levels of FUT8 and 14 mucins at the colon comparing control subjects vs. patients. Data represent the fold-change between controls and UC patients (black circles). Red-filled circles represent those statistically significant differences (P < 0.004). (C) Specific levels of FUT8 and 14 mucins at the distal colon comparing the data from patients with the expression levels of control subjects. Red-filled circles represent those statistically significant differences (P < 0.004). Abbreviations: No infl.: Not inflamed, UC infl.: Ulcerative colitis inflamed colon. *P < 0.05, **P < 0.01.
Fig. 2.
Fig. 2.
Fut8−/− mice present thinner mucus layer at the proximal colon. Representative (A) proximal, (B) medial, and (C) distal colons of Fut8+/+ (Left), Fut8+/− (Center), and Fut8−/− (Right) mice stained with PAS or PAS-AB. Quantification of the mucus layer thickness for each condition is shown next to images. Average values ± SEM are plotted as scatter plot with bar graph (Fut8+/+: black dots, Fut8+/−: red dots, Fut8−/−: blue dots). The y axis represents the thickness of the mucus layer in micrometers. *P < 0.05.
Fig. 3.
Fig. 3.
FUT8 levels impact MUC1 localization (A) Immunofluorescence z-stack single planes of control, FUT8-KD, and FUT8-OV differentiated HT29-18N2 cells with anti-MUC1 antibody (green), phalloidin (red), and DAPI (red). (Scale bars, 5 µm.) (B) Colocalization between MUC1 and phalloidin was calculated from immunofluorescence images by Manders’ coefficient using Fiji. Average values ± SEM are plotted as scatter plot with bar graph. The y axis represents Manders’ coefficient of the fraction of MUC1 overlapping with phalloidin. (C) Quantification of MUC1 levels at the membrane compared to intracellular levels in control (black), FUT8 KD (red), and FUT8 OV (green) cells. Data were calculated from immunofluorescence images using Fiji. (D) Quantification of MUC1 levels at the membrane compared to total levels in control (black), FUT8 KD (red), and FUT8 OV (green) cells. Data were calculated from immunofluorescence images using FIJI. Abbreviations: Ctrl: control cells; FUT8 KD: FUT8-depleted cells; FUT8 OV: FUT8 overexpressing cells; KD: FUT8 KD; OV: FUT8 OV. *P < 0.05, **P < 0.01.
Fig. 4.
Fig. 4.
FUT8 levels alter mucin export. (A and C) Secreted MUC2 from differentiated control (black circles) and FUT8 KD (green circles) cells or control (black squares) and FUT8 OV (green squares) cells that were incubated for 30 min at 37 °C in the absence (baseline) or presence (stimulated) of 100 µM ATP. Data were normalized to intracellular actin levels. The y axis represents normalized values relative to the values of untreated control cells. ATP-dependent MUC2 secretion was calculated from the data in A or B, respectively, as the difference between normalized baseline secretion and stimulated secretion for each condition. (B and D) Secreted MUC5AC from differentiated control (black circles) and FUT8 KD (red circles) cells or control (black squares) and FUT8 OV (red squares) cells that were incubated for 30 min at 37 °C in the absence (baseline) or presence (stimulated) of 100 µM ATP. Data were normalized to intracellular actin levels. The y axis represents normalized values relative to the values of untreated control cells. ATP-dependent MUC5AC secretion was calculated from the data in C or D, respectively, as the difference between normalized baseline secretion and stimulated secretion for each condition. Abbreviations: Ctrl: control cells; KD: FUT8 KD; OV: FUT8 OV. *P < 0.05, **P < 0.01.
Fig. 5.
Fig. 5.
FUT8 affects the removal resistance of the mucin fibers. (A and B) Control, FUT8 KD, and FUT8 OV cells were differentiated for 6 d and seeded in glass-bottom dishes. After stimulation using 100 µM ATP, cells were processed for immunofluorescence (A) before (NO PERM/NO WASH) or (B) after extensive washing with isotonic solution (NO PERM/WASH). Cells were stained with anti-MUC5AC (green), phalloidin (red), and DAPI (blue). In the orthogonal view, dotted lines across the images demarcate the top surface of the cell. (Scale bars, to 10 µm.) (C) Control, FUT8 KD, and FUT8 OV cells were permeabilized after extensive washing (PERM/WASH) to reveal intracellular MUC5AC granules. (D) Quantification of MUC5AC fibers compactness (ratio between area and perimeter2) in control (black), FUT8 KD (red), and FUT8 OV (green) cells before washing and without permeabilization (NO PERM/NO WASH). Data were calculated from immunofluorescence images using Fiji software. (E) Volume of control (black), FUT8 KD (red), and FUT8 OV (green) MUC5AC objects was calculated from individual immunofluorescence stacks of cells before washing and without permeabilization (NO PERM/NO WASH) using the 3D analysis Fiji software. The y axis represents the volume of the granules in cubic micrometers. (F) Volume of MUC5AC granules from permeabilized control (black), FUT8 KD (red), and FUT8 OV (green) cells was calculated from individual i immunofluorescent images using 3D analysis Fiji software. The y axis represents the volume of the granules in cubic micrometers. Abbreviations: NO PERM/NO WASH: Not permeabilized cells without washing, NO PERM/WASH: Not permeabilized cells with extensive washing, PERM/WASH: Permeabilized cells after extensive washing. *P < 0.05, **P < 0.01.
Fig. 6.
Fig. 6.
Model for FUT8 role on UC pathogenesis. (A) In control cells, both mucus layers are separated in the distal colon, and the pathogens and the microbiota restricted to the outer layer. (B) In cells with low levels of FUT8, mucins are less resistant to removal, which makes the outer layer, together with bacteria, easily removed. In turn, this triggers more secretion, thus increasing the renewal rate and protecting against invasion from pathogens. (C) High levels of FUT8, as observed in UC patients, disrupt the mucus layer, making it more permeable to pathogens. In addition, these mucin fibers are more resistant to shear stress, so the bacteria can stay longer and reach the epithelium triggering inflammation.

References

    1. Johansson M. E. V., Larsson J. M. H., Hansson G. C., The two mucus layers of colon are organized by the MUC2 mucin, whereas the outer layer is a legislator of host-microbial interactions. Proc. Natl. Acad. Sci. U.S.A. 108 (suppl. 1), 4659–4665 (2011). - PMC - PubMed
    1. Magalhães A., et al. , Muc5ac gastric mucin glycosylation is shaped by FUT2 activity and functionally impacts Helicobacter pylori binding. Sci. Rep. 6, 25575 (2016). - PMC - PubMed
    1. Thornton D. J., Rousseau K., McGuckin M. A., Structure and function of the polymeric mucins in airways mucus. Annu. Rev. Physiol. 70, 459–486 (2008). - PubMed
    1. Perez-Vilar J., Mucin granule intraluminal organization. Am. J. Respir. Cell Mol. Biol. 36, 183–190 (2007). - PMC - PubMed
    1. Adler K. B., Tuvim M. J., Dickey B. F., Regulated mucin secretion from airway epithelial cells. Front. Endocrinol. (Lausanne) 4, 129 (2013). - PMC - PubMed

Publication types