. 2022 Oct 25;119(43):e2209211119.
doi: 10.1073/pnas.2209211119. Epub 2022 Oct 17.

14-3-3τ drives estrogen receptor loss via ERα36 induction and GATA3 inhibition in breast cancer

Affiliations

14-3-3τ drives estrogen receptor loss via ERα36 induction and GATA3 inhibition in breast cancer

Lidija A Wilhelms Garan et al. Proc Natl Acad Sci U S A. .

Abstract

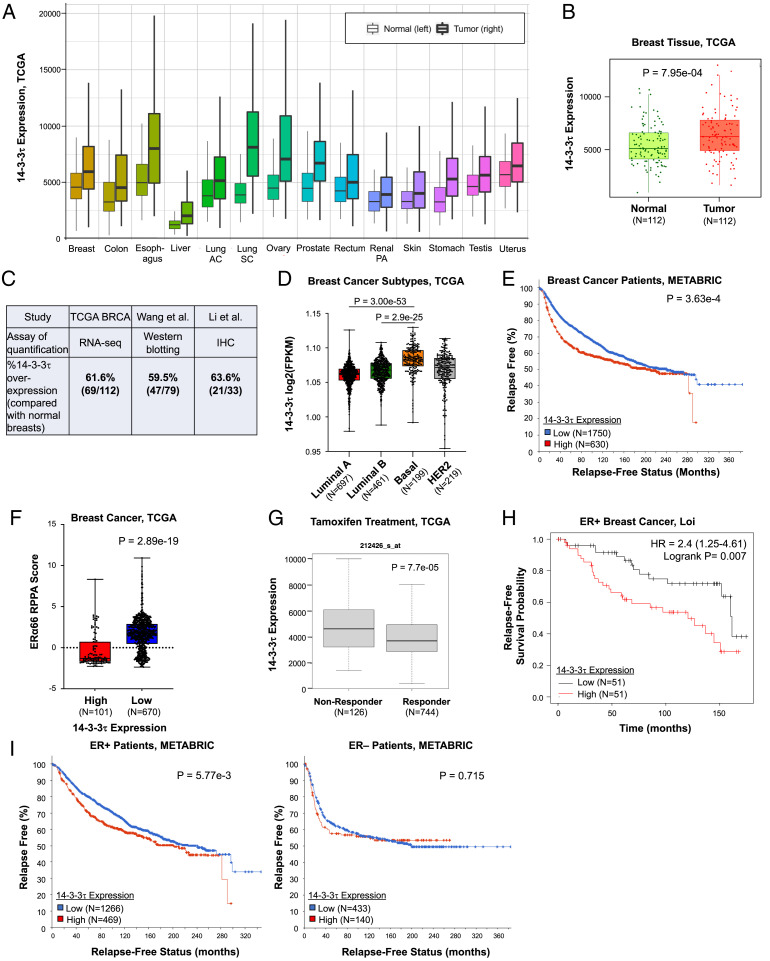
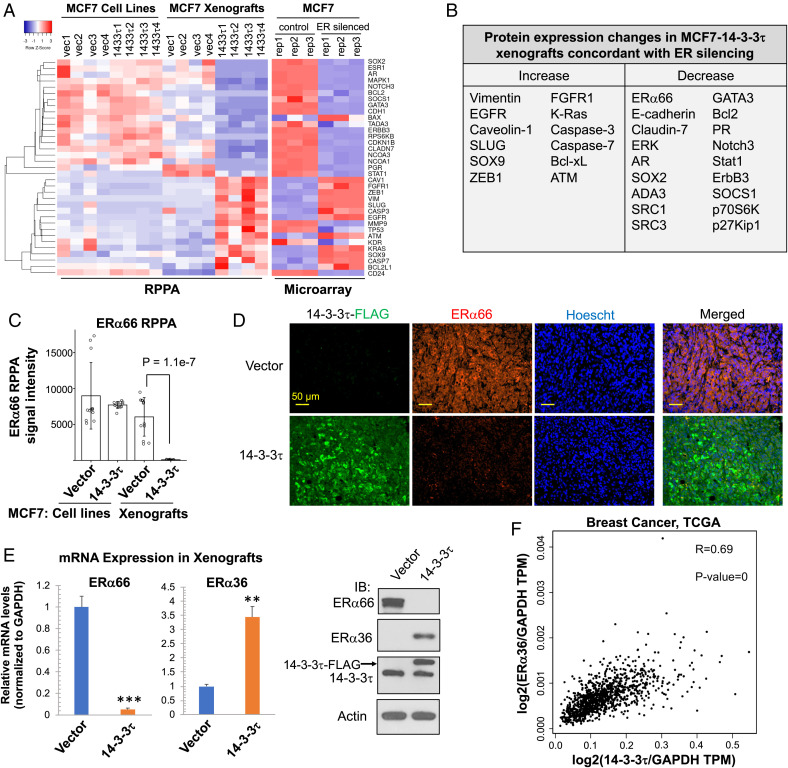
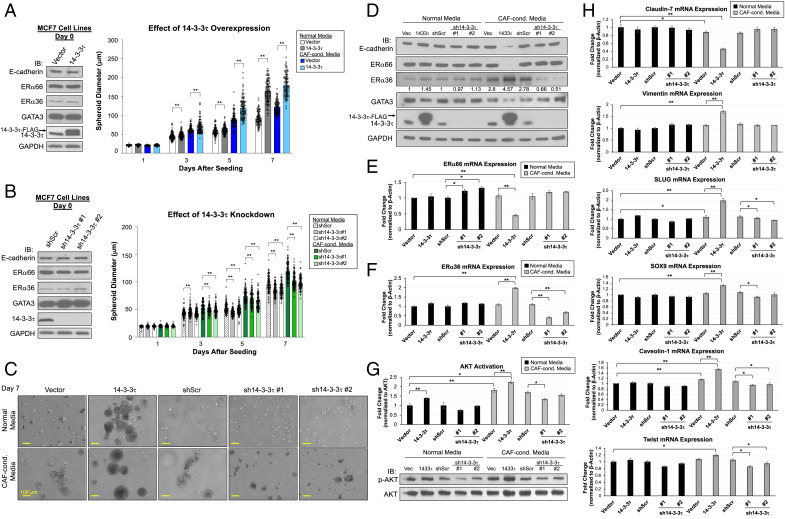
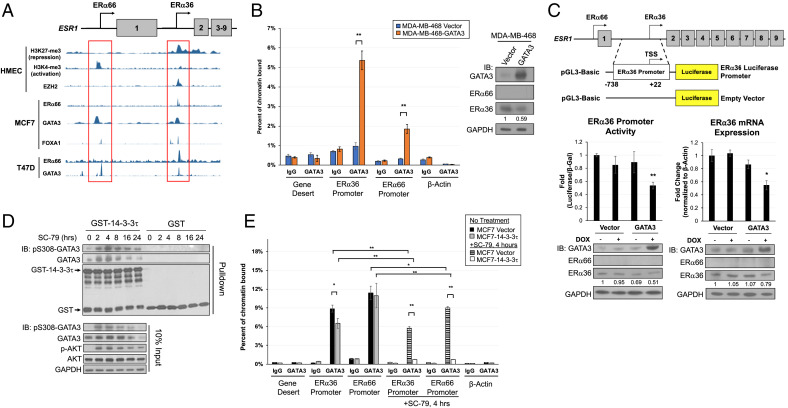
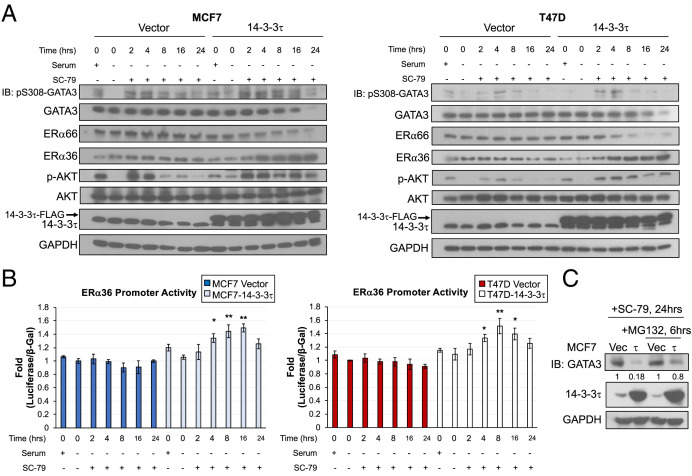
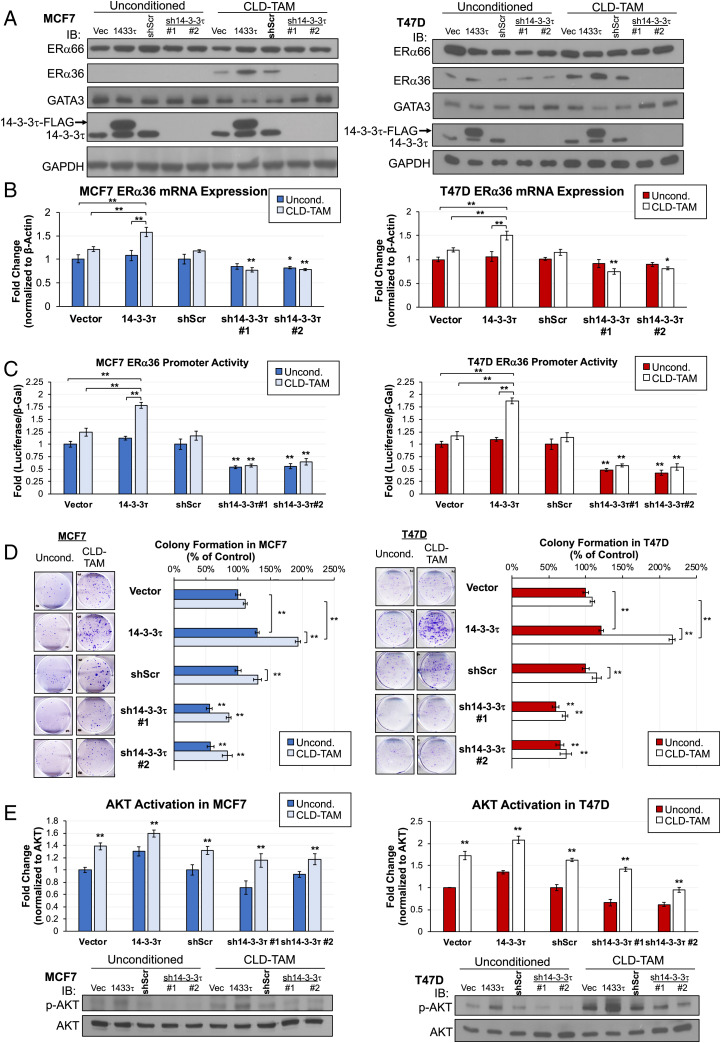
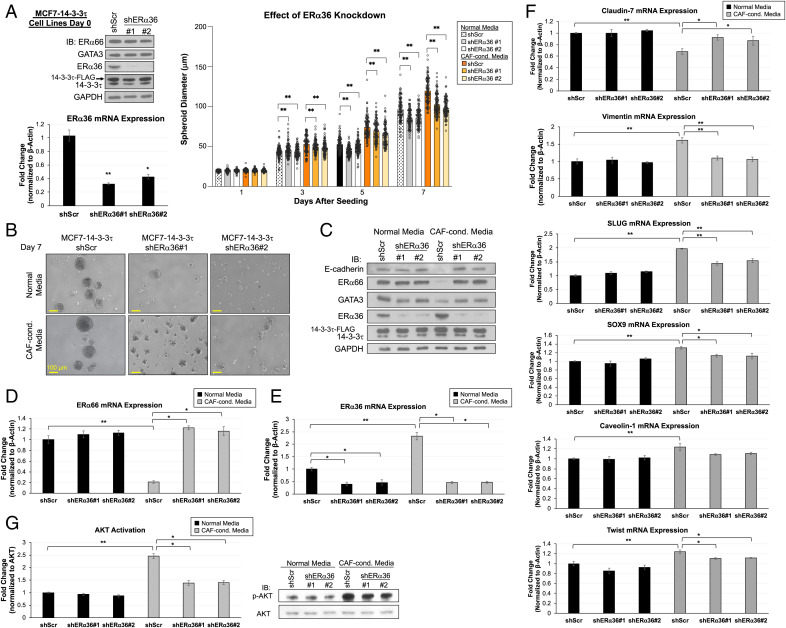
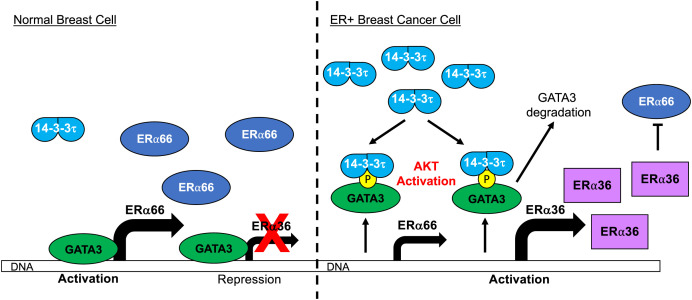
About one-fourth of recurrent estrogen receptor-positive (ER+) breast cancers lose ER expression, leading to endocrine therapy failure. However, the mechanisms underlying ER loss remain to be fully explored. We now show that 14-3-3τ, up-regulated in ∼60% of breast cancer, drives the conversion of ER+ to ER- and epithelial-to-mesenchymal transition (EMT). We identify ERα36, an isoform of ERα66, as a downstream effector of 14-3-3τ. Overexpression of 14-3-3τ induces ERα36 in xenografts and tumor spheroids. The regulation is further supported by a positive correlation between ERα36 and 14-3-3τ expression in human breast cancers. ERα36 can antagonize ERα66 and inhibit ERα66 expression. Isoform-specific depletion of ERα36 blocks the ER conversion and EMT induced by 14-3-3τ overexpression in tumor spheroids, thus establishing ERα36 as a key mediator in 14-3-3τ-driven ER loss and EMT. ERα36 promoter is repressed by GATA3, which can be phosphorylated by AKT at consensus binding sites for 14-3-3. Upon AKT activation, 14-3-3τ binds phosphorylated GATA3 and facilitates the degradation of GATA3 causing GATA3 to lose transcriptional control over its target genes ERα66 and ERα36. We also demonstrate a role for the collaboration between 14-3-3τ and AKT in ERα36 induction and endocrine therapy resistance by three-dimensional spheroid and tamoxifen treatment models in MCF7 and T47D ER+ breast cancer cells. Thus, the 14-3-3τ-ERα36 regulation provides a previously unrecognized mechanism for ER loss and endocrine therapy failure.

Keywords: 14-3-3τ; 3D tumor spheroid model; ERα36; GATA3; estrogen receptor.


Conflict of interest statement

The authors declare no competing interest.

Figures

Fig. 1.
Fig. 1.
14-3-3τ is up-regulated in breast cancer, and its up-regulation is significantly associated with decreased ERα66 expression, tamoxifen resistance, and relapse-free survival. (A) 14-3-3τ expression is significantly elevated in 14 cancers from TCGA database compared with normal tissue expression. Tumor samples are denoted with bolded lines. Significance calculated by Mann-Whitney U test. AC, adenocarcinoma; SC, squamous cell carcinoma; PA, papillary cell carcinoma. (B) 14-3-3τ expression is significantly (P = 7.95e-4) increased in breast cancer compared with their matched, normal breast tissues in the TCGA BRCA dataset. (C) 14-3-3τ is overexpressed in about 60% of breast tumors when compared with their matched, adjacent normal breast tissues in three cohorts: TCGA, Wang et al. (22) and Li et al. (21). 14-3-3τ overexpression in Wang et al. is defined by ≥ 1.5X of their matched normal breast tissues on Western blot analysis. The cutoff for TCGA and Li et al. is the 14-3-3τ expression level in the respective matched normal breast tissues. IHC, immunohistochemistry. (D) 14-3-3τ expression significantly increases from luminal A and luminal B to basal-like breast cancer subtype (P = 3.00e-53 and P = 2.9e-25, respectively). (E) METABRIC relapse-free survival analysis showing breast cancer patients with high 14-3-3τ expression (red) are significantly (P = 3.63e-4) more likely to relapse than patients with low expression (blue). Patients were split by upper tertile of 14-3-3τ expression in their breast cancers. Similar results were obtained when patients were split by upper quartile or median. (F) High 14-3-3τ expression is significantly (P = 2.89e-19) associated with low ERα66 protein expression in breast cancer RPPA analysis of TCGA BRCA samples. Cutoff was defined by 14-3-3τ expression Z score >1. Similar results were obtained when using other cut-offs. (G) ER+ patients with high 14-3-3τ expression are significantly (P = 7.7e-05) less likely to respond to TAM treatment (TCGA). (H) ER+ patients treated with TAM who have high 14-3-3τ expression (red) are significantly (P = 0.007) more likely to relapse than patients with low 14-3-3τ expression (black) (Loi cohort (28)). (I) High 14-3-3τ expression (red) only significantly impacts relapse-free survival in ER+ patients compared with ER– patients breast cancer (METABRIC). Patients were split by upper tertile of 14-3-3τ expression in their breast cancers. HER2, human epidermal growth factor receptor 2; HR, hazard ratio; RNA-seq, RNA sequencing.
Fig. 2.
Fig. 2.
14-3-3τ overexpression down-regulates ERα66, but up-regulates ERα36 and induces EMT changes in MCF7 xenografts. (A, Left) Heatmap of RPPA analyses of MCF7-vector and MCF7-14-3-3τ cell lines (n = 4 biological replicates per group) and xenografts (n = 4 xenografts per group). Right: Heatmap of microarray analysis of control MCF7 and ERα66-silenced MCF7 cells (n = 3 biological replicates per cell line). The data were extracted from GSE27473. (B) Summary of RPPA protein changes exclusively in 14-3-3τ xenografts relevant to breast cancer progression and EMT and concordant to changes induced by ERα66 silencing. (C) RPPA data of ERα66 protein expression. Data are represented as means ± SD. N = 12 per group (three RPPA technical replicates per biological sample, four biological replicates per group). (D) Representative immunohistochemistry images of vector and 14-3-3τ xenograft samples illustrating ERα66 loss in 14-3-3τ tumors. Imaged at 20X. (Scale bar, 50 μm.) (E) Representative MCF7 vector and 14-3-3τ xenograft mRNA and lysate analyzed by RT-qPCR and Western blot demonstrating significant loss of ERα66 and induction of ERα36. Data are represented as means ± SEM, n = 3 xenografts from each group; **P < 0.01; ***P < 0.001 (two-tailed t test). IB, immunoblotting. The individual data from each xenograft are presented in SI Appendix, Fig. S4. (F) A strong, positive correlation (R = 0.69, Pearson) exists between 14-3-3τ and ERα36 gene expression in breast cancer TCGA dataset (n = 1085). Gene expression is normalized to GAPDH. TPM, transcripts per million.
Fig. 3.
Fig. 3.
Spheroid model of 14-3-3τ-driven ERα66 loss and EMT induction using CAF-conditioned media. (A, Left) Western blot analyses of MCF7 cell lysates seeded in 3D model on day 0. IB, immunoblotting. Right: Spheroid growth curves of MCF7 vector and 14-3-3τ grown for 8 d in normal media (NM) or CAF-conditioned media (CCM). Graph represents average spheroid diameter (n = 103) measured every other day. All cell lines grew significantly larger in CCM compared with NM with 14-3-3τ-CCM growing the largest. *P < 0.05, **P < 0.01. (B, Left) Western blot analyses of MCF7 cell lysates seeded in 3D model on day 0. Right: Spheroid growth curves of MCF7 shScr and 14-3-3τKDs grown for 8 d in NM or CCM. Graph represents average spheroid diameter (n = 103) measured every other day. All cell lines grew significantly larger in CCM compared with NM, with KD lines growing the smallest. *P < 0.05, **P < 0.01. (C) Representative images of spheroids from all cell lines on day 7 taken at 10X magnification. (Scale bar, 100 μm.) (D) Western blot analyses of spheroids grown in NM or CCM harvested at day 8. 14-3-3τ-CCM cells had reduction of ERα66, GATA3, and E-cadherin and an induction of ERα36. The relative intensities of ERα36 were quantified (NIH ImageJ software (33)) and normalized to NM control line. (E) ERα66 mRNA expression was significantly decreased upon 14-3-3τ overexpression when grown in CCM, while sh14-3–3τ increased its expression. (F) ERα36 expression was significantly increased in 14-3-3τ-CCM spheroids while sh14-3–3τ-CCM spheroids significantly hindered its expression. (G) AKT activity was significantly increased in all spheroids grown in CCM compared with NM with highest activity in 14-3-3τ-CCM spheroids. Spheroids with 14-3-3τ depletion grown in CCM had reduced AKT activation compared with shScr-CCM. AKT activation was determined by p-AKT protein quantification (NIH ImageJ software) normalized to AKT and relative to respective control line. (H) Genes that demonstrate EMT features are most significantly changed in 14-3-3τ-CCM spheroids, including significant down-regulation in epithelial marker claudin-7 and induction of mesenchymal markers (vimentin, SLUG, SOX9, caveolin-1, and Twist). (E–H) Data shown are mean ± SD, (n = 3 biological replicates); *P < 0.05, **P < 0.01 (two-tailed t test).
Fig. 4.
Fig. 4.
14-3-3τ binds GATA3 after AKT activation, and this interaction dissociates GATA3 from the ERα36 promoter. (A) ENCODE data show ERα66 and ERα36 promoter regions exhibit corresponding histone marks for activation or repression, respectively, in human mammary epithelial cells (HMEC). In MCF7 and T47D cell lines, several transcription factors bind to ERα66 and ERα36 promoter regions. (B) ChIP assay demonstrates the binding of GATA3 to both ERα36 and ERα66 promoter regions in MDA-MB-468 cells overexpressing DOX-inducible GATA3 following 1 μM DOX treatment for 48 h. Western blot confirms DOX-inducible GATA3 overexpression and reduction of ERα36 protein. ERα36 protein expression was quantified (NIH ImageJ software), normalized to GAPDH and relative to vector. Data represent mean ± SD, (n = 3 biological replicates); *P < 0.05, **P < 0.01 (two-tailed t test). IB, immunoblotting. (C) Schematic of luciferase reporter construct for activity at the ERα36 promoter region. GATA3 induction in MDA-MB-468 reduces ERα36 promoter activity, transcript, and protein when treated with 1 μM of DOX for 48 h. ERα36 protein expression was quantified (NIH ImageJ software), normalized to GAPDH and relative to vector/no DOX. Data represent mean ± SD, (n = 3 biological replicates); *P < 0.05, **P < 0.01 (two-tailed t test). (D) AKT phosphorylates GATA3 at S308 and creates a 14-3-3τ-binding motif. 14-3-3τ binds GATA3 after activation of AKT with 10 μM SC-79; the interaction of 14-3-3τ with GATA3 peaks at 4 h after treatment. (E) ChIP assay demonstrates significant binding of GATA3 to both ERα36 and ERα66 promoter regions in MCF7 vector and 14-3-3τ cells. GATA3 binding to both promoters is significantly eliminated in MCF7-14-3-3τ cells treated with SC-79 at 4 h. Data shown are mean ± SD of a representative experiment (n = 6 technical replicates); *P < 0.05, **P < 0.01 (two-tailed t test).
Fig. 5.
Fig. 5.
14-3-3τ facilitates GATA3 degradation resulting in ERα36 transcriptional activation. (A) Activation of AKT with 10 μM SC-79 treatment decreased the levels of GATA3 and ERα66, but increased ERα36 levels in 14-3-3τ overexpressing MCF7 and T47D cells; however, this effect was not observed in vector control cells. IB, immunoblotting. (B) The transcriptional activity of ERα36 was enhanced by SC-79 treatment in 14-3-3τ-overexpressing MCF7 and T47D cells, but not in vector control cells. Data represent mean ± SD, (n = 3 biological replicates); *P < 0.05, **P < 0.01 (two-tailed t test). (C) SC-79 treatment for 24 h decreased the levels of GATA3 in MCF7-14-3-3τ cells; however, this effect was partially rescued by treatment with 10 μM MG132 proteasome inhibitor. GATA3 was quantified (NIH ImageJ software), normalized to GAPDH, and the fold change was calculated relative to that in vector control cells.
Fig. 6.
Fig. 6.
Continuous low-dose tamoxifen (CLD-TAM) treatment of luminal breast cancer cells with 14-3-3τ overexpression reduces GATA3 expression while inducing ERα36 expression and significantly increasing resistance to TAM. (A) CLD-TAM treatment reduced GATA3 expression with a corresponding ERα36 protein induction while did not affect ERα66 levels in 14-3-3τ overexpressing MCF7 or T47D cells. IB, immunoblotting. (B) ERα36 mRNA expression was significantly increased in CLD-TAM-treated MCF7 or T47D cells with 14-3-3τ overexpression, while 14-3-3τ knockdown cells showed significant reduction of ERα36 transcript in both treatment groups compared with scrambled control. Data represent mean ± SD, (n = 4 biological replicates); *P < 0.05, **P < 0.01 (two-tailed t test). (C) 14-3-3τ promoted the induction of ERα36 promoter activity by CLD-TAM, while 14-3-3τ knockdown significantly inhibited the activity. Data represent mean ± SD, (n = 4 biological replicates); *P < 0.05, **P < 0.01 (two-tailed t test). (D) All CLD-TAM-conditioned cells showed better cell viability than unconditioned cells when treated with 5 μM TAM for 14 d. CLD-TAM-treated 14-3-3τ cells had the most resistance to TAM treatment while 14-3-3τ knockdown cells remained the most sensitive. (E) 14-3-3τ modulated AKT activation after CLD-TAM treatment. D and E: Data represent mean ± SD, (n = 3 biological replicates); *P < 0.05, **P < 0.01 (two-tailed t test).
Fig. 7.
Fig. 7.
Knockdown of ERα36 in MCF7-14-3-3τ grown in 3D model rescues ERα66 expression and abrogates EMT. (A, Right) Spheroid growth curves of MCF7-14-3-3τ stably expressing shScr or shERα36#1 or #2 in normal media (NM) or CAF-conditioned media (CCM). Graph represents average spheroid diameter (n = 103) measured every other day for 7 d. Left : Western blot analyses and ERα36 mRNA expression in MCF7-14-3-3τ stably expressing shScr or shERα36 at time of seeding. *P < 0.05, **P < 0.01. IB, immunoblotting. (B) Representative microscope images of spheroids from all cell lines on day 7 taken at 10X magnification. (Scale bar, 100 μm.) (C) Western blot analyses of spheroids grown in NM or CCM harvested at day 8. MCF7-14-3-3τ-shScr showed reduction of ERα66, GATA3, and E-cadherin expressions and an induction of ERα36 expression in CCM compared with in NM spheroids. Both shERα36 spheroids grown in CCM showed comparable expression of these proteins as those grown in NM. (D) ERα66 mRNA expression was significantly reduced in MCF7-14-3-3τ shScr spheroids grown in CCM but not in any other spheroids. (E) ERα36 mRNA expression was significantly increased in MCF7-14-3-3τ shScr spheroids grown in CCM. (F) Genes that demonstrate EMT features are most significantly changed in MCF7-14-3-3τ shScr spheroids grown in CCM including down-regulation in epithelial marker claudin-7 and induction of mesenchymal markers (vimentin, SLUG, SOX9, caveolin-1, and Twist). Spheroids with depleted ERα36 grown in CCM demonstrated significant induction of claudin-7 and reduction of mesenchymal markers compared with MCF7-14-3-3τ shScr-CCM spheroids. (G) AKT activation was greater in all spheroids grown in CCM compared with NM, with the largest activity in MCF7-14-3-3τ shScr-CCM spheroids. The activation of AKT was significantly reduced by ERα36 depletion only in spheroids grown in CCM. AKT activation was determined by p-AKT protein quantification (NIH ImageJ software) normalized to AKT and relative to shScr/NM control. D–G: Data represent mean ± SD, (n = 3 biological replicates); *P < 0.05, **P < 0.01 (two-tailed t test).
Fig. 8.
Fig. 8.
Schematic model of the molecular mechanism controlling ERα36 transcription in normal versus luminal breast cancer cells. Under normal cell conditions, GATA3 binds both ERα66 and ERα36 promoters to promote ERα66 transcription and to repress ERα36 transcription. During the evolution of breast cancer, some ER+ breast cancer may acquire both high 14-3-3τ expression and aberrant AKT activation, either due to intrinsic factors or interactions with TME. These events facilitate GATA3 phosphorylation leading to 14-3-3τ-GATA3 interaction which causes GATA3 to lose transcriptional control of ERα66 and ERα36. ERα36 is now transcribed and antagonizes ERα66 expression leading to down-regulation of ERα66 and more basal-like cell characteristics.

Similar articles

Cited by

References

    1. Burstein H. J., et al. , Adjuvant endocrine therapy for women with hormone receptor-positive breast cancer: ASCO clinical practice guideline focused update. J. Clin. Oncol. 37, 423–438 (2019). - PubMed
    1. Davies C., et al. ; Adjuvant Tamoxifen: Longer Against Shorter (ATLAS) Collaborative Group, Long-term effects of continuing adjuvant tamoxifen to 10 years versus stopping at 5 years after diagnosis of oestrogen receptor-positive breast cancer: ATLAS, a randomised trial. Lancet 381, 805–816 (2013). - PMC - PubMed
    1. Rondón-Lagos M., Villegas V. E., Rangel N., Sánchez M. C., Zaphiropoulos P. G., Tamoxifen resistance: Emerging molecular targets. Int. J. Mol. Sci. 17, E1357 (2016). - PMC - PubMed
    1. Aurilio G., et al. , A meta-analysis of oestrogen receptor, progesterone receptor and human epidermal growth factor receptor 2 discordance between primary breast cancer and metastases. Eur. J. Cancer 50, 277–289 (2014). - PubMed
    1. Wang Z. Y., Yin L., Estrogen receptor alpha-36 (ER-α36): A new player in human breast cancer. Mol. Cell. Endocrinol. 418, 193–206 (2015). - PubMed

Publication types

MeSH terms