. 2022 Oct 17;13(1):6041.
doi: 10.1038/s41467-022-33377-8.

A local tumor microenvironment acquired super-enhancer induces an oncogenic driver in colorectal carcinoma

Affiliations

A local tumor microenvironment acquired super-enhancer induces an oncogenic driver in colorectal carcinoma

Royce W Zhou et al. Nat Commun. .

Erratum in

Abstract

Tumors exhibit enhancer reprogramming compared to normal tissue. The etiology is largely attributed to cell-intrinsic genomic alterations. Here, using freshly resected primary CRC tumors and patient-matched adjacent normal colon, we find divergent epigenetic landscapes between CRC tumors and cell lines. Intriguingly, this phenomenon extends to highly recurrent aberrant super-enhancers gained in CRC over normal. We find one such super-enhancer activated in epithelial cancer cells due to surrounding inflammation in the tumor microenvironment. We restore this super-enhancer and its expressed gene, PDZK1IP1, following treatment with cytokines or xenotransplantation into nude mice, thus demonstrating cell-extrinsic etiology. We demonstrate mechanistically that PDZK1IP1 enhances the reductive capacity CRC cancer cells via the pentose phosphate pathway. We show this activation enables efficient growth under oxidative conditions, challenging the previous notion that PDZK1IP1 acts as a tumor suppressor in CRC. Collectively, these observations highlight the significance of epigenomic profiling on primary specimens.


Conflict of interest statement

R.E.P. owns equity in Therapten. Ramon Parsons receives royalty payments from Cullgen and Therapten. R.E.P. gives industry-sponsored lectures at the Lurie Cancer Center and the University of Southern California Cancer Center. R.E.P. reports other activities with Columbia University and Regeneron Pharmaceuticals. S.H.I. consults for EXACT Sciences Corporation, and Geneoscopy. S.H.I. receives royalty payments from Bio-Rad Laboratories Inc. The remaining authors declare no competing interest.

Figures

Fig. 1
Fig. 1. Recurrently dysregulated super-enhancers in CRC patients.
a Study overview. Figure adapted from SMART Servier Medical Art, reproduced with permission, licensed under a Creative Commons Attribution 3.0 unported license. b PCA of H3K27ac signal at 2026 SEs in CRC (n = 15 independent tissue samples), normal mucosa (n = 15), crypts (n = 4), and FAP adenomas (n = 2). c, d GSEA between SE proximal genes and differentially expressed genes between CRC and normal. e H3K27ac ChIP-seq track near ASCL2. Two proximal SEs are underlined. The y-axes of all ChIP-seq tracks are scaled the same. f 2026 SEs by log2 fold change in H3K27ac signal with 12 candidate SE target genes based on overlap of ranking and recurrence annotated. g Heatmap of H3K27ac signal at 583 differentially expressed SEs (P < 0.01, two-sided Student’s t test). Source data are provided as a Source Data file. NES normalized enrichment score, FDR false discovery rate.
Fig. 2
Fig. 2. A subset of super-enhancers is specific to primary CRC specimens and not recapitulated in CRC cell lines.
a PCA of H3K27ac signal at 2026 SEs in CRC (n = 15 independent tissue samples) and CRC cell lines (n = 13 independent cell lines). Please see Methods for accessions. b Heatmap of H3K27ac signal (Z-score) between CRC tumors and CRC cell lines with unsupervised hierarchical clustering and Pearson’s correlation testing. 221 SEs (out of 2026) down-regulated in CRC cell lines compared to primary tumors (mean H3K27ac signal log2 fold change <−1, P < 0.01). c GSEA validation of a tumor-enriched SE gene signature imposed on differentially expressed genes between primary CRC and CRC cell lines. See Supplementary Table 3 for gene list. d Venn diagram showing overlap between 221 SEs down-regulated in CRC cell lines from b with the top 100 gained SEs in primary CRC over patient-matched normal. NES normalized enrichment score, Q false discovery rate.
Fig. 3
Fig. 3. A context-dependent, primary CRC-enriched super-enhancer at the locus of PDZK1IP1.
a H3K27ac ChIP-seq tracks at the PDZK1IP1 SE in primary CRCs (n = 8 representative independent tumors) and CRC cell lines (n = 8 representative lines). The y-axes of all ChIP-seq tracks are scaled to the same range [0-107]. b Frequency of samples meeting ROSE criteria for SE calling at the PDZK1IP1 locus. n = 15 independent CRC tumors, n = 15 independent patient-matched normal colon mucosae, n = 13 independent CRC cell lines, n = 9 independent 3D CRC organoids. c RNA-seq expression of PDZK1IP1 in primary CRC (n = 16 independent tumors), normal mucosa (n = 15 independent tissue samples), and CCLE CRC cell lines (n = 51 independent cell lines). Data presented as median ± interquartile range. Significance was determined using two-sided Student’s t test. d, e RNA-seq expression of PDZK1IP1 in primary CRCs and sample-matched patient-derived 3D CRC organoids. For the Weill cohort, n = 3 for PDZK1IP1-high tumors and organoids, n = 2 for PDZK1IP1-low tumors and organoids. For the Milan cohort, n = 6 for PDZK1IP1-high tumors and organoids, n = 3 for PDZK1IP1-low tumors and organoids. Significance determined by two-sided Student’s test. Please see Methods for accessions. f, g Uniform Manifold Approximation and Projection (UMAP) of single cells from 23 independent primary CRC tumors and 10 independent adjacent patient-matched normal colons merged into a single plot, annotated with cell type and PDZK1IP1 expression. Please see Methods for accessions. Source data are provided as a Source Data file.
Fig. 4
Fig. 4. Xenotransplantation restores the PDZK1IP1 super-enhancer and CRISPR interference attenuates expression.
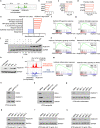
a Xenotransplantation and tumor ChIP-seq experiment overview. Figure adapted from SMART Servier Medical Art, reproduced with permission, licensed under a Creative Commons Attribution 3.0 unported license. b H3K27ac ChIP-seq track of the PDZK1IP1 SE (underlined) in HT29 xenografts (n = 3 independent tumors) or HT29 parental cells maintained in culture. Y-axes of all ChIP-seq tracks are scaled to the same range [0–133]. c Immunoblot of PDZK1IP1 protein levels between HT29 xenografts (n = 3 independent tumors) or HT29 parental cells maintained in culture (n = 3 biological replicates). d Quantitative real-time PCR (qRT-PCR) of PDZK1IP1 mRNA expression between HT29 xenografts (n = 3 independent tumors) or HT29 parental cells maintained in culture (n = 3 biological replicates). Data presented as mean ± s.e.m. Significance was determined using two-sided Student’s t test. e Fold change gene expression by RNA-seq between HT29 xenografts (n = 3 independent tumors) or HT29 parental cells maintained in culture (n = 3 biological replicates). X-axis represents all protein-coding genes within 500 kb on either side of the PDZK1IP1 SE. Data presented as mean ± s.e.m. f dCas9-KRAB CRISPR interference of open chromatin regions at the PDZK1IP1 SE. ATAC-seq track at the PDZK1IP1 SE in primary CRCs from TCGA (n = 81 independent tumors, merged into one track). gj Immunoblot of PDZK1IP1 levels in HT29 cells expressing lentiviral sgRNAs with dCas9-KRAB targeting E1, E2, or P (promoter) regions of the PDZK1IP1 SE, grown in culture or as xenograft tumors. Source data are provided as a Source Data file.
Fig. 5
Fig. 5. The PDZK1IP1 super-enhancer is regulated by inflammation.
a ATAC-seq track at the PDZK1IP1 SE in primary CRCs from TCGA (n = 81 independent tumors, merged into one track). bd TRAP motif analysis at consensus open chromatin regions from the PDZK1IP1 SE in primary CRC, where sequences are compared against all human promoters with a Benjamini-Hochberg correction to generate a P-value. e Hallmarks of Cancer GSEA of RNA-seq expression data from PDZK1IP1-high (top 50% mRNA expression) versus PDZK1IP1-low (bottom 50% mRNA expression) primary CRCs from TCGA (n = 342 independent tumors). fi Hallmarks of Cancer GSEA enrichment signatures from PDZK1IP1-high (top 50% mRNA expression) versus PDZK1IP1-low (bottom 50% mRNA expression) primary CRCs from TCGA (n = 342 independent tumors). j, k PDZK1IP1 expression levels by immunoblot in cytokine stimulated HT29 cells (10 ng/mL, 16 hours) or HT29 subcutaneous xenografts in nude mice. l H3K27ac ChIP-seq track of the PDZK1IP1 SE (underlined) in unstimulated or TNFα, IFNγ, and IL-6 co-stimulated HT29 cells at 10 ng/mL for 16 hours. Y-axes of all ChIP-seq tracks are scaled to the same range [0-122]. m Hallmarks of Cancer GSEA performed on differentially expressed genes from RNA-seq between HT29 xenograft tumors (n = 3 independent tumors) and HT29 parental cells maintained in culture (n = 3 biological replicates). n, o Immunoblot of PDZK1IP1 levels in HT29 xenografts in the presence of WT or deleted RELA or STAT3. ps Immunoblot of PDZK1IP1 levels in HT29 cells with the indicated treatment for 16 hours. Source data are provided as a Source Data file. NES normalized enrichment score, FDR false discovery rate.
Fig. 6
Fig. 6. PDZK1IP1 is a context-dependent regulator of CRC tumor growth.
a, b Growth curves, sgPDZK1IP1 and sgNeg subcutaneous xenograft tumors in nude mice. HT29 n = 10 mice per group, DLD1 n = 10 mice per group. 1 million cells injected per mouse for both HT29 and DLD1. Data presented as mean ± s.e.m. Significance was determined using two-sided Student’s t-test. c, d Growth curves, PDZK1IP1-V5 and EV xenograft tumors. HT29 n = 10 mice per group, DLD1 n = 5 mice for PDZK1IP1-V5, n = 8 mice for EV. 3-5 million cells injected for both HT29 and DLD1. Data presented as mean ± s.e.m. Significance was determined using two-sided Student’s t test. e Meta-comparison of 2D Incucyte growth curves in vitro with xenograft tumor growth in vivo. KO – sgPDZK1IP1.329, WT – sgNeg, EV – empty vector, OE – PDZK1IP1-V5. ΔGrowth presented as (KO-WT) as percentage of WT, or (OE-EV) as a percentage of EV. Data presented as mean ± s.e.m. Significance was determined using two-sided Student’s t-test. HT29 KO and WT, as well as DLD1 KO and WT in vivo (n = 10 mice per group). HT29 KO and WT, as well as DLD1 KO and WT in vitro (n = 6 biological replicates). f Growth curves of HT29 cells with CRISPR dCas9-KRAB interference of the E2 region of the PDZK1IP1 SE (sgE2), and sgNeg subcutaneous xenograft tumors (n = 8 mice per group.) 1 million cells injected per mouse. Data presented as mean ± s.e.m. Significance was determined using two-sided Student’s t test. Source data are provided as a Source Data file.
Fig. 7
Fig. 7. PDZK1IP1 regulates cancer metabolism.
a, b Steady state levels (total peak are) of PPP intermediates and downstream metabolites (n = 3 per group). Data presented as mean ± s.e.m. Significance was determined using two-sided Student’s t test. *P < 0.05, **P < 0.01, ***P < 0.001, ****P < 0.0001. c Schematic of PPP entry from glycolysis. df Total peak area of labeled 6-phosphogluconolactone (n = 4 per group), 1,2C13-glucose tracing. Data presented as mean ± s.e.m. Significance was determined using two-sided Student’s t test. g, h Steady-state NADPH/NADP + ratios from total metabolite peak area (n = 3 per group). Data presented as mean ± s.e.m. Significance was determined using two-sided Student’s t test. i, j Steady-state levels of total glutathione peak area (n = 4 per group). Data presented as mean ± s.e.m. Significance was determined using two-sided Student’s t test. k, l Cellular ROS levels by luminescent assay following diamide treatment for 1 h at the indicated concentrations (n = 4 per group). Data presented as mean ± s.e.m. Significance was determined using Student’s t test. * P < 0.05 m Growth curves of sgNeg and sgPDZK1IP1.329 xenograft tumors with or without 30 mM N-acetylcysteine in drinking water (n = 8 mice per group, 1 million cells injected). Data presented as mean ± s.e.m. Significance was determined using two-sided Student’s t test. Source data are provided as a Source Data file.

References

    1. Whyte WA, et al. Master transcription factors and mediator establish super-enhancers at key cell identity genes. Cell. 2013;153:307–319. doi: 10.1016/j.cell.2013.03.035. - DOI - PMC - PubMed
    1. Hnisz D, et al. Super-enhancers in the control of cell identity and disease. Cell. 2013;155:934–947. doi: 10.1016/j.cell.2013.09.053. - DOI - PMC - PubMed
    1. Zhang X, et al. Identification of focally amplified lineage-specific super-enhancers in human epithelial cancers. Nat. Genet. 2016;48:176–182. doi: 10.1038/ng.3470. - DOI - PMC - PubMed
    1. Zhang X, et al. Somatic superenhancer duplications and hotspot mutations lead to oncogenic activation of the KLF5 transcription factor. Cancer Discov. 2018;8:108–125. doi: 10.1158/2159-8290.CD-17-0532. - DOI - PMC - PubMed
    1. Mansour MR, et al. Oncogene regulation. An oncogenic super-enhancer formed through somatic mutation of a noncoding intergenic element. Science. 2014;346:1373–1377. doi: 10.1126/science.1259037. - DOI - PMC - PubMed

Publication types