. 2022 Oct 17;12(1):17365.
doi: 10.1038/s41598-022-21290-5.

A digital platform for the design of patient-centric supply chains

Affiliations

A digital platform for the design of patient-centric supply chains

Niki Triantafyllou et al. Sci Rep. .

Abstract

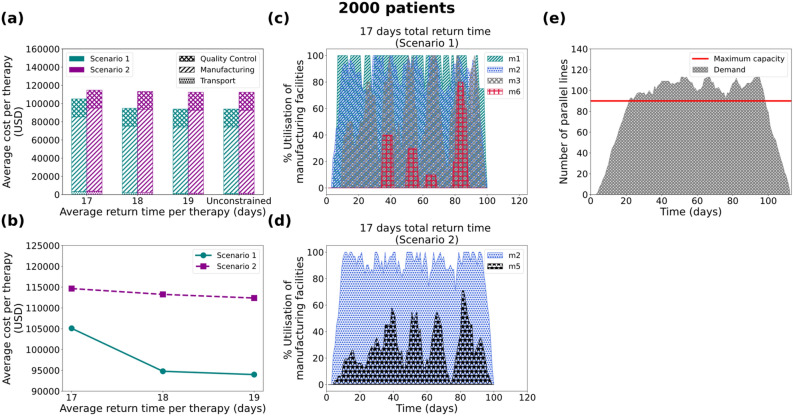
Chimeric Antigen Receptor (CAR) T cell therapies have received increasing attention, showing promising results in the treatment of acute lymphoblastic leukaemia and aggressive B cell lymphoma. Unlike typical cancer treatments, autologous CAR T cell therapies are patient-specific; this makes them a unique therapeutic to manufacture and distribute. In this work, we focus on the development of a computer modelling tool to assist the design and assessment of supply chain structures that can reliably and cost-efficiently deliver autologous CAR T cell therapies. We focus on four demand scales (200, 500, 1000 and 2000 patients annually) and we assess the tool's capabilities with respect to the design of responsive supply chain candidate solutions while minimising cost.


Conflict of interest statement

The authors declare no competing interests.

Figures

Figure 1
Figure 1
CAR T cell therapy lifecycle for (a) autologous and (b) allogeneic therapies.
Figure 2
Figure 2
Explicit theoretical description of flow equations and binary decisions.
Figure 3
Figure 3
CAR T cell therapy lifecycle as considered in this work. INCp,c,t corresponds to the incoming patient p at the leukapheresis site c at time t. The outgoing leukapheresis sample is ready to be shipped to the manufacturing facility m after TLS which is the duration of the leukapheresis procedure. At the leukapheresis site exit we consider two variables, namely: OUTCp,c,t and LSRp,c,m,j,t both indicating the leukapheresis samples of patient p, ready to be shipped from the leukapheresis site c at time t. Their main difference is that the former (OUTCp,c,t) allows tracking of the general mass balance around the facility, while LSRp,c,m,j,t enables tracking of the leukapheresis sample of patient p, ready to be shipped from the leukapheresis site c to the manufacturing facility m, using transport mode j at time t. TT1j corresponds to the transportation duration between the leukapheresis site and the manufacturing facility based on mode j. After TT1j the leukapheresis samples arrive at the manufacturing facility m. In the same fashion, we consider two variables both at the entrance and at the exit of the manufacturing facility. INMp,m,t and OUTMp,m,t are used to describe the general mass balance between incoming and outgoing therapies of patient p to and from the manufacturing facility m, respectively, at time t. Similarly, LSAp,c,m,j,t enables tracking of the incoming therapies p from leukapheresis site c to manufacturing facility m using transport mode j at time t. MSOp,m,h,j,t describes the outgoing therapies p from manufacturing facility m to hospital site h using transport mode j at time t. Therapies will be ready to leave the manufacturing after TMFE+TQC which is the sum of the manufacturing and quality control durations. After TT2j the manufactured therapies arrive at the hospital site h. In the same way, we use two variables to denote the incoming therapies. Specifically, INHp,h,t that describes the general flow of therapies p arriving at the hospital site h at time t and FTDp,m,h,j,t that tracks therapy p that has left from manufacturing facility m and is arriving at the hospital site h via transport mode j at time t.
Figure 4
Figure 4
Results for the 200 patients/year demand scenario: Comparison of average cost per therapy (USD) for (a) 7 and (b) 19 days duration of the manufacturing process, where the cost is broken down into transport cost, manufacturing cost and Quality Control cost. Average cost per therapy as a function of the average return time for (c) 7 and (d) 19 days. Utilisation of manufacturing facilities built for the 7 days manufacturing duration for Scenario 1 (e) and Scenario 2 (f), with the average return time of therapy constrained at 17 days. Scenario 1 and Scenario 2 correspond to unconstrained and constrained number of manufacturing facilities respectively.
Figure 5
Figure 5
Results for the 500 patients/year demand scenario: Comparison of average cost per therapy (USD) for (a) 7 and (b) 19 days duration of the manufacturing process, where the cost is broken down into transport cost, manufacturing cost and Quality Control cost. Average cost per therapy as a function of the average return time for (c) 7 and (d) 19 days. Utilisation of manufacturing facilities built for the 7 days manufacturing duration for Scenario 1 (e) and Scenario 2 (f), with the average return time of therapy constrained at 17 days. Scenario 1 and Scenario 2 correspond to unconstrained and constrained number of manufacturing facilities respectively.
Figure 6
Figure 6
Results for the 1000 patients/year demand scenario: Comparison of average cost per therapy (USD) for (a) 7 and (b) 19 days duration of the manufacturing process, where the cost is broken down into transport cost, manufacturing cost and Quality Control cost. Average cost per therapy as a function of the average return time for (c) 7 and (d) 19 days. Utilisation of manufacturing facilities built for the 7 days manufacturing duration for Scenario 1 (e) and Scenario 2 (f), with the average return time of therapy constrained at 17 days. Scenario 1 and Scenario 2 correspond to unconstrained and constrained number of manufacturing facilities respectively.
Figure 7
Figure 7
Results for the 2000 patients/year demand scenario: (a) Average cost per therapy (USD) for 7 days duration of the manufacturing process, where the cost is broken down into transport cost, manufacturing cost and Quality Control cost. (b) Average cost per therapy as a function of the average return time for 7 days of manufacturing. Utilisation of manufacturing facilities built for the 7 days manufacturing duration for Scenario 1 (c) and Scenario 2 (d), with the average return time of therapy constrained at 17 days. (e) Number of parallel lines needed for the 19-day manufacturing duration with the average return time of therapy being unconstrained. Scenario 1 and Scenario 2 correspond to unconstrained and constrained number of manufacturing facilities respectively.

References

    1. Cho JH, et al. Engineering advanced logic and distributed computing in human CAR immune cells. Nat. Commun. 2021 doi: 10.1038/s41467-021-21078-7. - DOI - PMC - PubMed
    1. Sadelain M, Brentjens R, Rivière I, Park J. CD19 CAR therapy for acute lymphoblastic Leukemia. Am. Soc. Clin. Oncol. Educ. Book. 2015;35:e360–e363. doi: 10.14694/EdBook_AM.2015.35.e360. - DOI - PubMed
    1. Caldwell KJ, Gottschalk S, Talleur AC. Allogeneic CAR cell therapy—more than a pipe dream. Front. Immunol. 2021;11:1–12. doi: 10.3389/fimmu.2020.618427. - DOI - PMC - PubMed
    1. First CAR-T therapy to target BCMA gets FDA nod. Nat. Biotechnol. 39, 531 (2021) - PubMed
    1. Mullard A. FDA approves fourth CAR-T cell therapy. Nat. Rev. Drug Discov. 2021;20:166. - PubMed

Publication types

MeSH terms