. 2022 Oct 17;12(1):17380.
doi: 10.1038/s41598-022-22262-5.

How the Great Plains Dust Bowl drought spread heat extremes around the Northern Hemisphere

Affiliations

How the Great Plains Dust Bowl drought spread heat extremes around the Northern Hemisphere

Gerald A Meehl et al. Sci Rep. .

Abstract

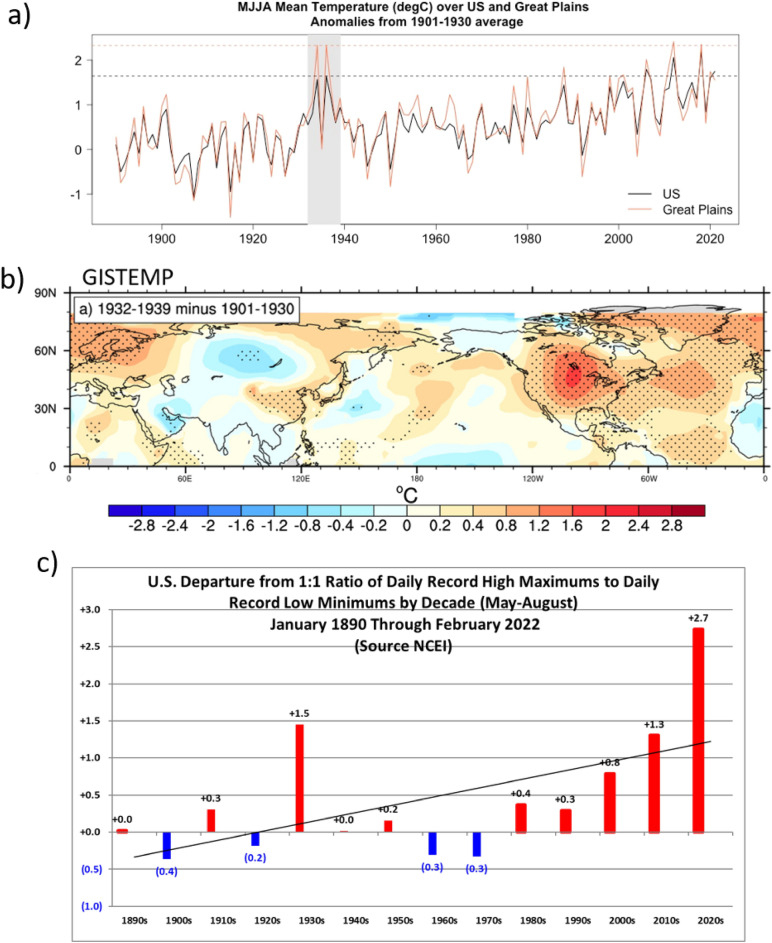
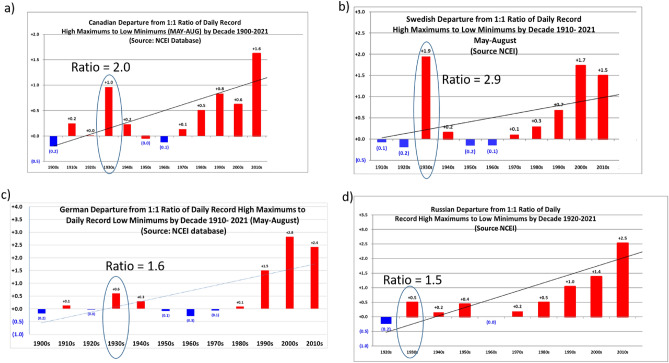
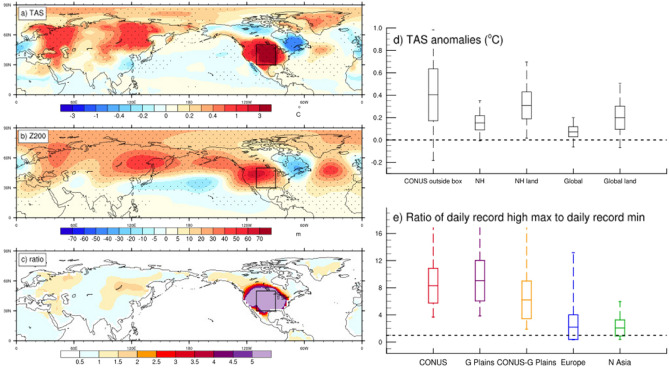
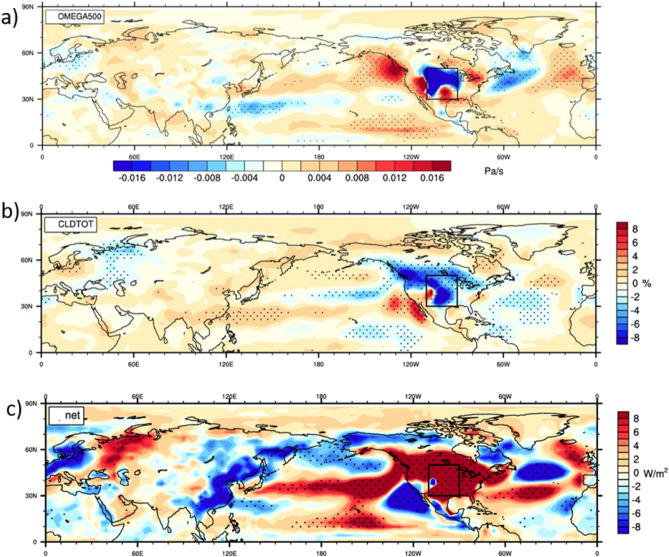
Extraordinary heat extremes occurred in the 1930s in areas of the Northern Hemisphere far from the record setting heat over the US associated with the Great Plains Dust Bowl drought. A climate model sensitivity experiment is used to identify a new mechanism involving a warm season circumglobal atmospheric teleconnection pattern that spread heat extremes over far-flung areas of the Northern Hemisphere arising from the intense heating over the desiccated Great Plains themselves. It has only been in the twenty-first century that human populations in these regions of the Northern Hemisphere have experienced heat extremes comparable to the 1930s. This demonstrates that humans influenced Northern Hemisphere temperature and heat extremes through disastrous and unprecedented regional land use practices over the Great Plains, and points to the possibility that future intense regional droughts could affect heat extremes on hemispheric scales.


Conflict of interest statement

The authors declare no competing interests.

Figures

Figure 1
Figure 1
The warm 1930s and heat extremes. (a) Season average MJJA mean surface air temperature anomalies (°C) relative to 1901–1930 over the continental U.S. (black line) and the Great Plains (red line) using the BEST observations. Gray shading denotes the Dust Bowl years between 1932 and 1939, and horizontal lines indicate the maximum MJJA value during that period (occurring in 1936) for both U.S. (dashed black line) and Great Plains (dashed red line); (b) season average MJJA mean surface air temperature anomalies (°C), 1932–39 minus 1901–1930, from GISTEMP; stippling denotes differences significant at the 95% level; (c) decadal averages over the continental U.S. of the ratio of daily record high maximum temperatures to record daily record low minimum temperatures from NCEI, depicted as deviations from the nominal value of 1.0 (the value of the ratio with no change to either record highs or record lows). To obtain the total ratios, add the nominal value of 1.0 to the values plotted so that the total records ratio for the 1930s would be 2.5, with the deviation from 1.0 to 1.5.
Figure 2
Figure 2
Extreme heat in the 1930s far from the Great Plains. Same as Fig. 1c, except for country values by decade for (a) Canada, (b) Sweden, (c) Germany, and (d) Russia. The total records ratios for the 1930s stand out for most of the twentieth century and are highlighted in each panel.
Figure 3
Figure 3
Dust Bowl heat extremes in the model experiment. The MJJA season average anomalies, experiment minus control, from the climate model sensitivity experiment where soil moisture over the Great Plains box (denoted in panels a-c) is set to zero; stippling indicates differences significant at the 95% level; (a) surface air temperature (TAS, °C); (b) 200 hPa height (Z200, m); (c) total records ratio differences; (d) box and whisker plots (markings indicate maximum value, + 1 standard deviation, mean, − 1 standard deviation, minimum value) for TAS anomalies (°C) for continental U.S. (CONUS) averaged outside the Great Plains box; NH (Northern Hemisphere), NH land (Northern Hemisphere land grid points), global average, global average over land grid points; (e) total records ratios averaged over various regions taken from the data shown in (c) for continental U.S. (CONUS), Great Plains, Great Plains minus CONUS, Europe (10° W–60° E, 30° N–50° N), and Northern Asia (80° E–160° E, 35° N–75° N) with box and whisker markings as in (d).
Figure 4
Figure 4
Processes producing far-field heat extremes. Anomalies from climate model experiment, experiment minus control, MJJA averages, stippling indicates differences significant at the 95% level; (a) vertical velocity at 500 hPa (Pa sec−1), positive values indicate anomalous downward vertical velocity; (b) total cloud (%), negative values indicate fewer clouds; and (c) net surface heat flux (W m−2), positive values indicate anomalous energy downward into the surface.

References

    1. Egan T. The Worst Hard Time. Boston: Houghton Mifflin Company; 2006.
    1. Schubert SD, Suarez MJ, Pegion PJ, Koster RD, Bacmeister JT. On the cause of the 1930s dust bowl. Science. 2004;303:1855–1859. doi: 10.1126/science.1095048. - DOI - PubMed
    1. Schubert S, et al. A USCLIVAR project to assess and compare the responses of global climate models to drought-related SST forcing patterns: Overview and results. J. Clim. 2009;22:5251–5272. doi: 10.1175/2009JCLI3060.1. - DOI
    1. Herweijer C, Seager R. The global footprint of persistent extra-tropical drought in the instrumental era. Int. J. Climatol. 2008 doi: 10.1002/joc.1590. - DOI
    1. Donat MG, et al. Extraordinary heat during the 1930s dust bowl and associated large-scale conditions. Clim. Dyn. 2016;46:413–426. doi: 10.1007/s00382-015-2590-5. - DOI

Publication types