

Cntnap2-dependent molecular networks in autism spectrum disorder revealed through an integrative multi-omics analysis
- PMID: 36253443
- PMCID: PMC9908544
- DOI: 10.1038/s41380-022-01822-1
Cntnap2-dependent molecular networks in autism spectrum disorder revealed through an integrative multi-omics analysis
Abstract
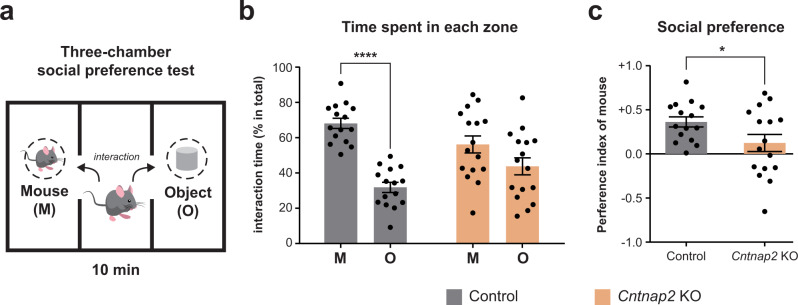
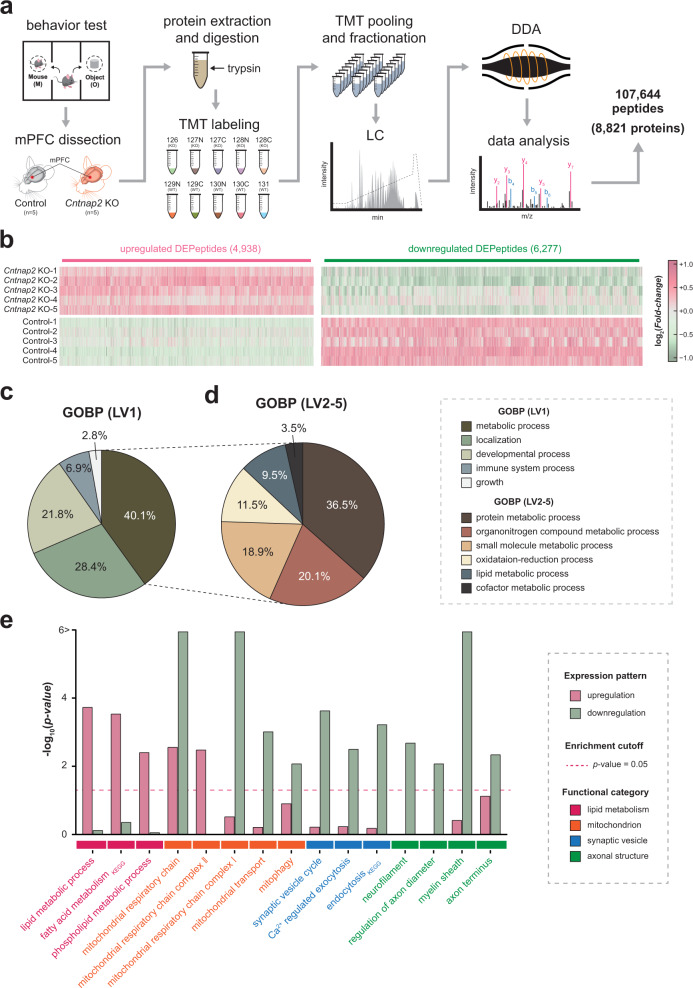
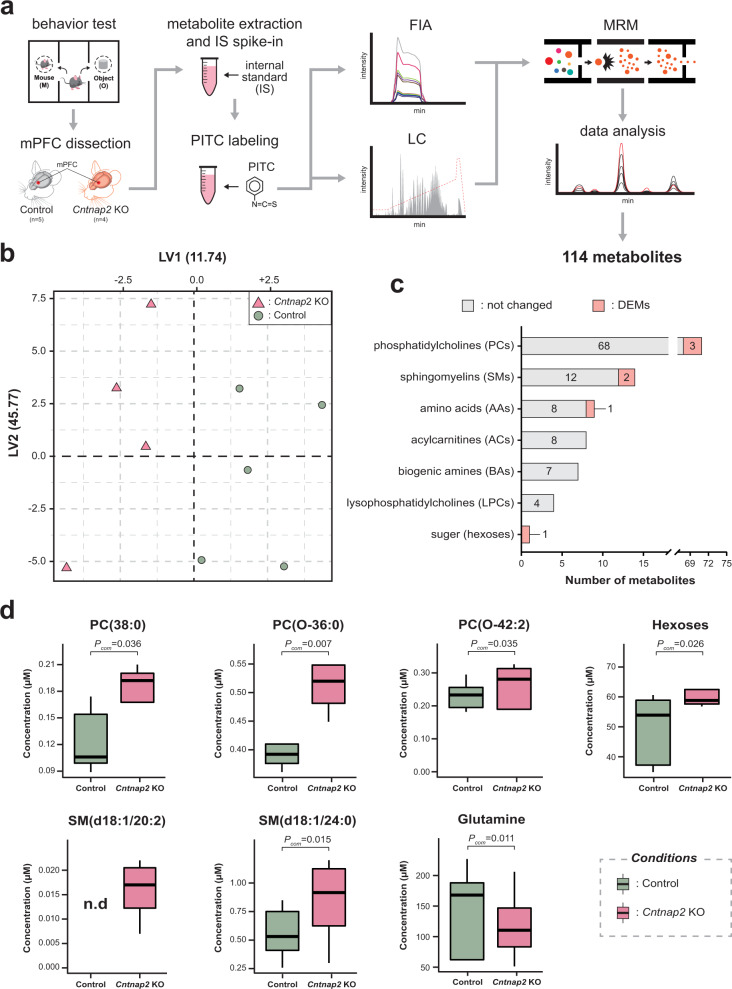
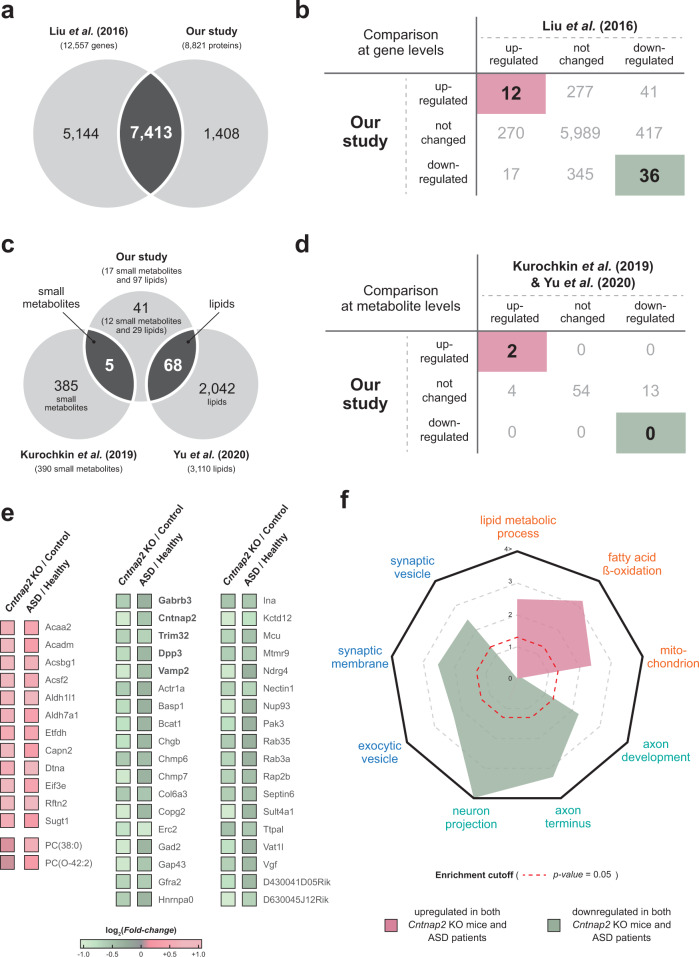
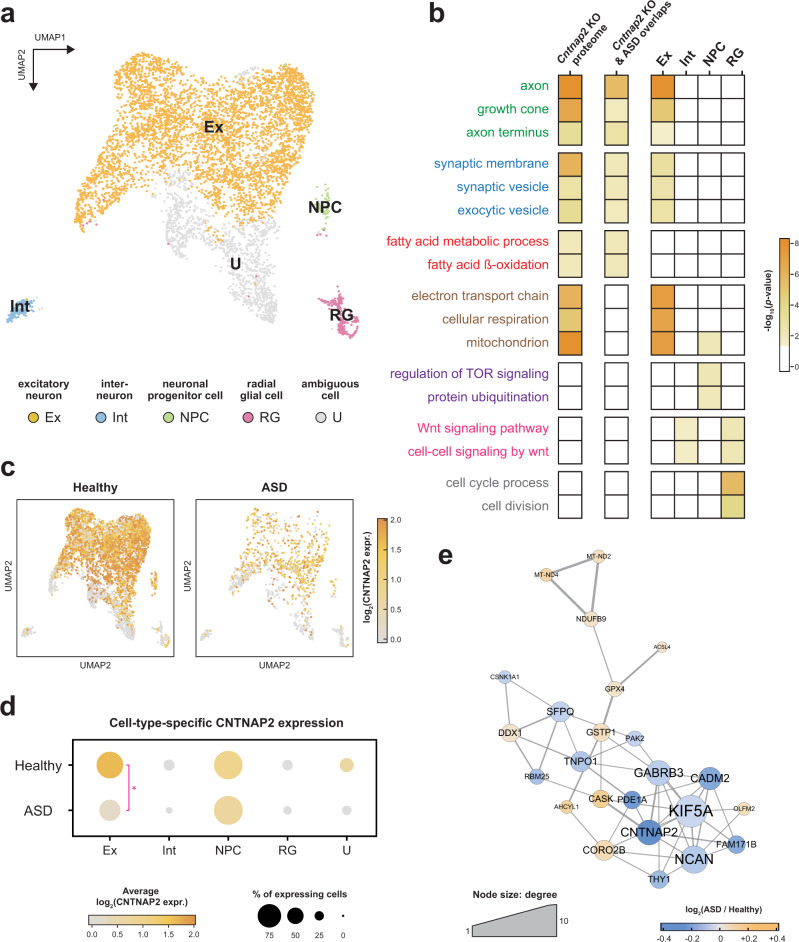
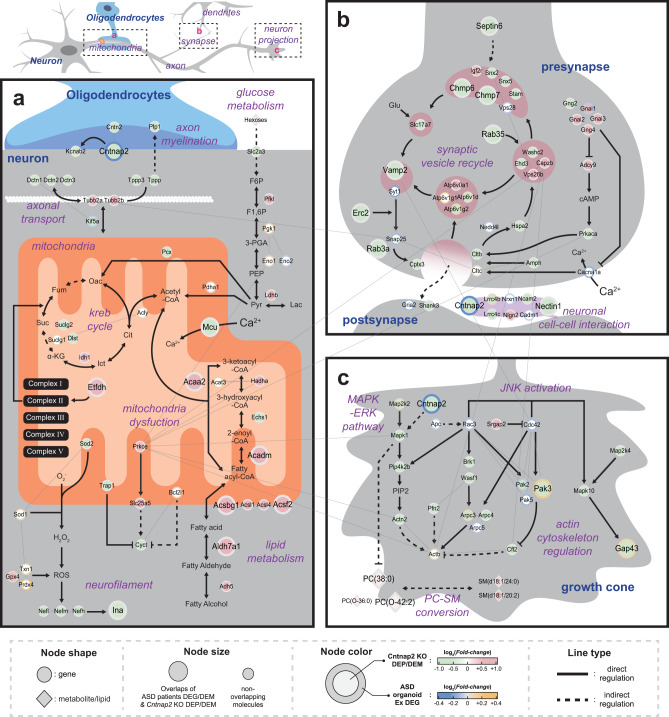
Autism spectrum disorder (ASD) is a major neurodevelopmental disorder in which patients present with core symptoms of social communication impairment, restricted interest, and repetitive behaviors. Although various studies have been performed to identify ASD-related mechanisms, ASD pathology is still poorly understood. CNTNAP2 genetic variants have been found that represent ASD genetic risk factors, and disruption of Cntnap2 expression has been associated with ASD phenotypes in mice. In this study, we performed an integrative multi-omics analysis by combining quantitative proteometabolomic data obtained with Cntnap2 knockout (KO) mice with multi-omics data obtained from ASD patients and forebrain organoids to elucidate Cntnap2-dependent molecular networks in ASD. To this end, a mass spectrometry-based proteometabolomic analysis of the medial prefrontal cortex in Cntnap2 KO mice led to the identification of Cntnap2-associated molecular features, and these features were assessed in combination with multi-omics data obtained on the prefrontal cortex in ASD patients to identify bona fide ASD cellular processes. Furthermore, a reanalysis of single-cell RNA sequencing data obtained from forebrain organoids derived from patients with CNTNAP2-associated ASD revealed that the aforementioned identified ASD processes were mainly linked to excitatory neurons. On the basis of these data, we constructed Cntnap2-associated ASD network models showing mitochondrial dysfunction, axonal impairment, and synaptic activity. Our results may shed light on the Cntnap2-dependent molecular networks in ASD.
© 2022. The Author(s).
Conflict of interest statement
The authors declare no competing interests.
Figures
Similar articles
-
Learning delays in a mouse model of Autism Spectrum Disorder.Behav Brain Res. 2016 Apr 15;303:201-7. doi: 10.1016/j.bbr.2016.02.006. Epub 2016 Feb 9. Behav Brain Res. 2016. PMID: 26873041 Free PMC article.
-
Modelling monogenic autism spectrum disorder using mouse cortical organoids.Biochem Biophys Res Commun. 2020 Jan 1;521(1):164-171. doi: 10.1016/j.bbrc.2019.10.097. Epub 2019 Oct 23. Biochem Biophys Res Commun. 2020. PMID: 31653345
-
Genetic variants in autism-related CNTNAP2 impair axonal growth of cortical neurons.Hum Mol Genet. 2018 Jun 1;27(11):1941-1954. doi: 10.1093/hmg/ddy102. Hum Mol Genet. 2018. PMID: 29788201
-
Zebrafish as a tool for autism research: unraveling the roles of Shank3, Cntnap2, Neuroligin3, and Arid1b in synaptic and behavioral abnormalities.Neurogenetics. 2025 Jun 6;26(1):48. doi: 10.1007/s10048-025-00828-5. Neurogenetics. 2025. PMID: 40478461 Review.
-
What does CNTNAP2 reveal about autism spectrum disorder?Trends Mol Med. 2012 Mar;18(3):156-63. doi: 10.1016/j.molmed.2012.01.003. Epub 2012 Feb 25. Trends Mol Med. 2012. PMID: 22365836 Free PMC article. Review.
Cited by
-
Integrative approach of omics and imaging data to discover new insights for understanding brain diseases.Brain Commun. 2024 Aug 8;6(4):fcae265. doi: 10.1093/braincomms/fcae265. eCollection 2024. Brain Commun. 2024. PMID: 39165479 Free PMC article. Review.
-
Heterozygous deletion of the autism-associated gene CHD8 impairs synaptic function through widespread changes in gene expression and chromatin compaction.Am J Hum Genet. 2023 Oct 5;110(10):1750-1768. doi: 10.1016/j.ajhg.2023.09.004. Am J Hum Genet. 2023. PMID: 37802044 Free PMC article.
-
Advancements in Single-Cell Proteomics and Mass Spectrometry-Based Techniques for Unmasking Cellular Diversity in Triple Negative Breast Cancer.Proteomics Clin Appl. 2025 Jan;19(1):e202400101. doi: 10.1002/prca.202400101. Epub 2024 Nov 21. Proteomics Clin Appl. 2025. PMID: 39568435 Free PMC article. Review.
-
nlr-1/CNTNAP regulates dopamine circuit structure and foraging behaviors in C. elegans.Commun Biol. 2024 Oct 2;7(1):1248. doi: 10.1038/s42003-024-06936-6. Commun Biol. 2024. PMID: 39358459 Free PMC article.
-
A bibliometric analysis of autism spectrum disorder signaling pathways research in the past decade.Front Psychiatry. 2024 Feb 12;15:1304916. doi: 10.3389/fpsyt.2024.1304916. eCollection 2024. Front Psychiatry. 2024. PMID: 38410675 Free PMC article.
References
Publication types
MeSH terms
Substances
LinkOut - more resources
Full Text Sources
Medical
Molecular Biology Databases
Research Materials
