. 2022 Oct 17;5(1):1100.
doi: 10.1038/s42003-022-04040-1.

splitSMLM, a spectral demixing method for high-precision multi-color localization microscopy applied to nuclear pore complexes

Affiliations

splitSMLM, a spectral demixing method for high-precision multi-color localization microscopy applied to nuclear pore complexes

Leonid Andronov et al. Commun Biol. .

Abstract

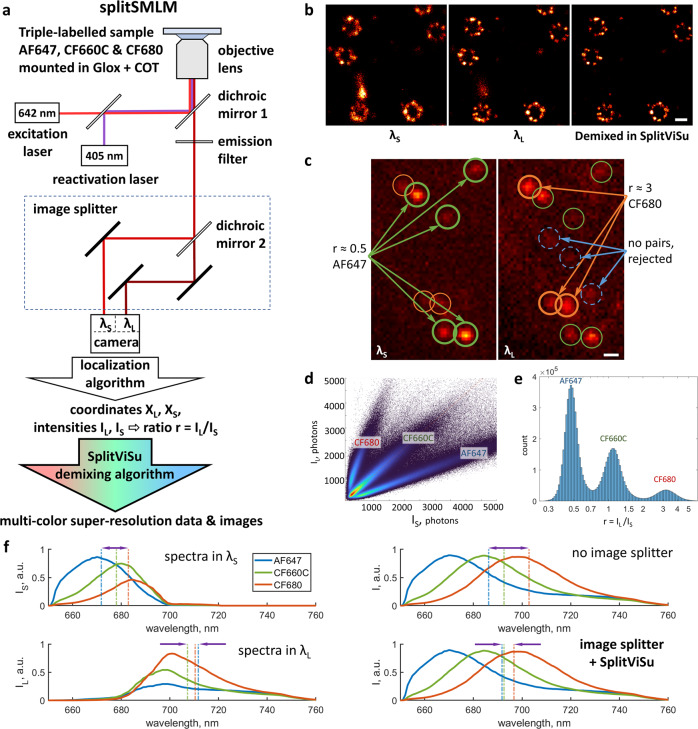
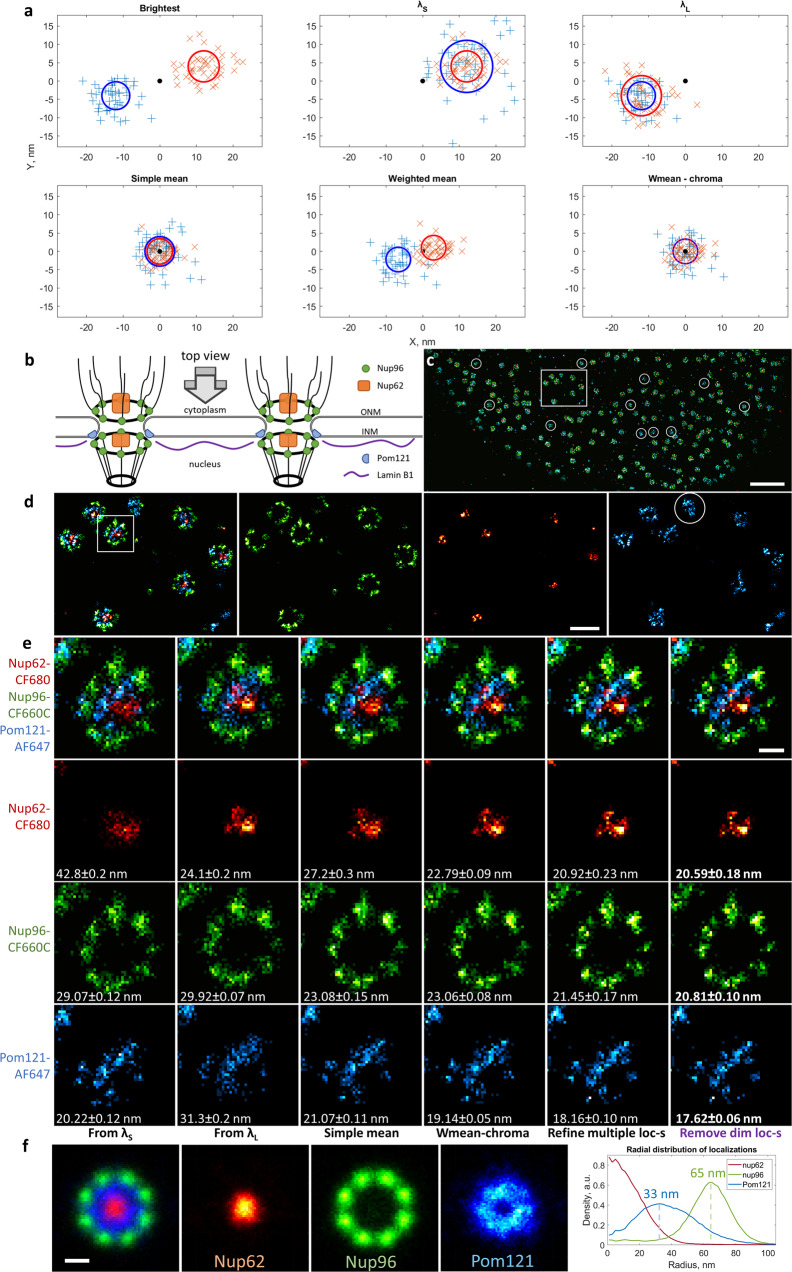
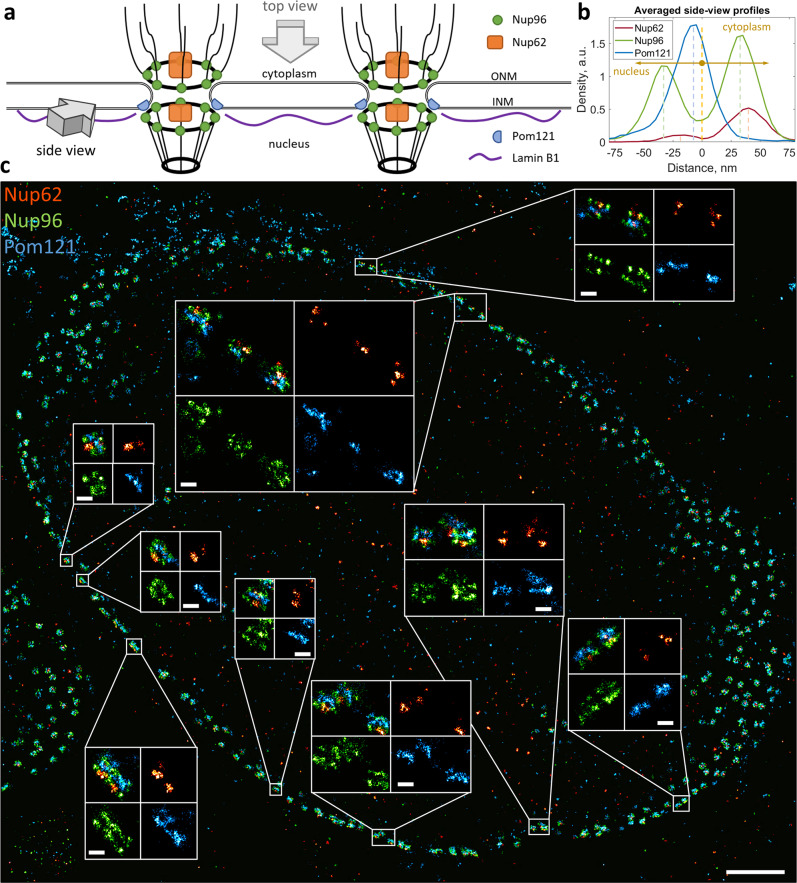
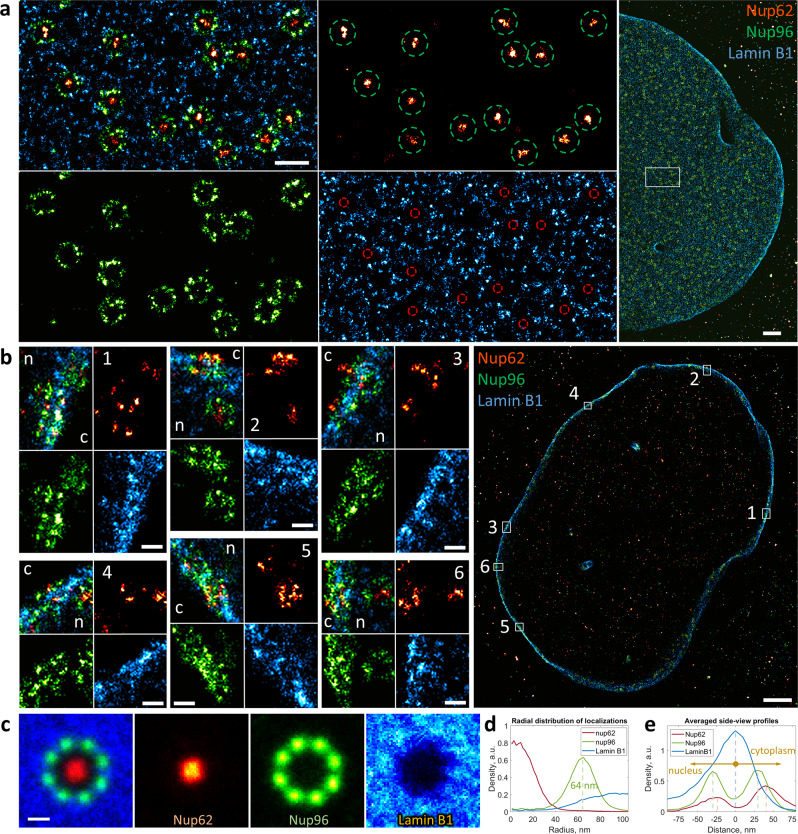
Single molecule localization microscopy (SMLM) with a dichroic image splitter can provide invaluable multi-color information regarding colocalization of individual molecules, but it often suffers from technical limitations. Classical demixing algorithms tend to give suboptimal results in terms of localization precision and correction of chromatic errors. Here we present an image splitter based multi-color SMLM method (splitSMLM) that offers much improved localization precision and drift correction, compensation of chromatic distortions, and optimized performance of fluorophores in a specific buffer to equalize their reactivation rates for simultaneous imaging. A novel spectral demixing algorithm, SplitViSu, fully preserves localization precision with essentially no data loss and corrects chromatic errors at the nanometer scale. Multi-color performance is further improved by using optimized fluorophore and filter combinations. Applied to three-color imaging of the nuclear pore complex (NPC), this method provides a refined positioning of the individual NPC proteins and reveals that Pom121 clusters act as NPC deposition loci, hence illustrating strength and general applicability of the method.


Conflict of interest statement

The authors declare no competing interests.

Figures

Fig. 1
Fig. 1. Principle of splitSMLM.
a Scheme of the splitSMLM imaging system and the overall workflow. b Super-resolution images of a single-labeled sample, reconstructed (from left to right) from localizations within the λS channel, from localizations within the λL channel or after demixing in SplitViSu, demonstrating removal of spurious localizations and resolution improvement. c Image of the two spectrally different channels, λS and λL (left and right, respectively), with localizations originating either from AF647 (green), CF680 (orange) or from background noise (blue). d Bivariate histogram of photon counts IS and IL originating from the λS and λL channels with three sectors corresponding to three fluorophore species. e Univariate histogram of ratios r on a semi-log plot with three peaks corresponding to three fluorophore species. f Fluorescence spectra of AF647, CF660C and CF680 calculated within the λS and λL channels (left), without image splitter (top right), or equivalent spectra after demixing in SplitViSu (bottom right). Vertical lines represent average wavelengths for the corresponding fluorophores in the corresponding channels. Average wavelengths after demixing in SplitViSu are calculated as the mean values of the average wavelengths of the fluorophores in the λS and λL channels. Arrows indicate maximum spectral difference within the triplet of fluorophores and reflect the amount of chromatic aberrations in the corresponding setting. Scale bars, 100 nm (b) and 500 nm (c).
Fig. 2
Fig. 2. Localization precision and chromatic error correction in splitSMLM using SplitViSu.
a Simulated results of demixing in SplitViSu using various methods for calculation of the output coordinates: “brightest”—the output coordinates equal the input coordinates from the brightest channel for the given fluorophore; “λS”, “λL”—the output coordinates equal the input coordinates from the λS or λL channel, respectively; “simple mean”—the output is calculated as a simple mean of the input coordinates in the λS and λL channels; “weighted mean”—the output is calculated as a photon count-weighted mean of the input coordinates in the λS and λL channels; “wmean-chroma”—the output is calculated as the “weighted mean” with subsequent subtraction of a chromatic error. The simulated data contains two species of fluorophores with different ratios: rred = 0.6, rblue = 3.5. The true position is the same for both fluorophore species and is shown as a black dot. The total photon count detected from every localization is the same for all fluorophores and equals 2000 photons. The full width at half maximum (FWHM) of the microscope’s PSF is 300 nm. The chromatic error between two fluorophores within the opposite channels of the image splitter is 24 nm (x-direction) and 8 nm (y-direction). Each species was detected 50 times within each channel. The circles represent the FWHM of the demixed distributions using the corresponding method for calculation of the output coordinates. b Scheme of the NPCs at the NE, used as a test object in this study. ONM, outer nuclear membrane; INM, inner nuclear membrane. ce “Top views” of the NPCs in a U2OS cell with immunofluorescently labeled Pom121 (blue), Nup62 (red) and Nup96 (green). Rectangle in c represents the region zoomed in d; square in d represents the region zoomed in e. Circles in c and e represent Pom121 clusters with few localizations of Nup96 and Nup62, which might correspond to deposition sites of new NPCs. e Different methods for calculation of demixed coordinates tested on a single NPC. Numbers in the bottom represent the resolution of the images, estimated according to the FRC1/7 criterion, calculated from the images of a whole cell. The images in e are reconstructed as 2D histograms of localization coordinates with a pixel size of 5 × 5 nm. f Sum of aligned images of individual NPCs with a radial distribution of localizations of each protein shown in the graph. For this graph, a sum of 160 NPC particles was used. Scale bars, 1 µm (c), 200 nm (d), 50 nm (e, f).
Fig. 3
Fig. 3. “Side view” of the NPCs with Nup96, Nup62 and Pom121 imaged by splitSMLM.
a Scheme of the NPCs at the NE. ONM, outer nuclear membrane; INM, inner nuclear membrane. b Averaged “side view” profiles of Nup62, Nup96 and Pom121 obtained by alignment of 65 individual NPCs. c U2OS cell with immuno-fluorescently labeled Pom121 (blue), Nup62 (red) and Nup96 (green) with zoomed-in “side view” regions in insets. Scale bars, 1 µm (c) and 100 nm (insets).
Fig. 4
Fig. 4. Three-color splitSMLM imaging of lamin B1 at the NE.
a “Top view” of the NE (Nup96, green; Nup62, red; lamin B1, blue). Green circles with a diameter of 150 nm represent the positions of the Nup96 ring. Red circles have a diameter of 50 nm and represent the positions of Nup62. White rectangle indicates the zoomed-in region. b “Side views” of the NE. The numbered rectangles in the general view represent the zoomed-in regions; n, nucleus; c, cytoplasm. c Sum of aligned images of individual NPCs. d Radial distribution of localizations of each protein obtained by averaging 99 NPC particles. e Averaged “side view” profiles of Nup62, Nup96 and lamin B1 obtained by alignment of 66 individual NPCs. Scale bars, 200 nm (a, left), 1 µm (a, right and b, right), 100 nm (b, left), 50 nm (c).

References

    1. Hell SW, Wichmann J. Breaking the diffraction resolution limit by stimulated emission: stimulated-emission-depletion fluorescence microscopy. Opt. Lett. 1994;19:780–782. doi: 10.1364/OL.19.000780. - DOI - PubMed
    1. Gustafsson MGL. Nonlinear structured-illumination microscopy: Wide-field fluorescence imaging with theoretically unlimited resolution. Proc. Natl Acad. Sci. USA. 2005;102:13081–13086. doi: 10.1073/pnas.0406877102. - DOI - PMC - PubMed
    1. Rust MJ, Bates M, Zhuang X. Stochastic optical reconstruction microscopy (STORM) provides sub-diffraction-limit image resolution. Nat. Methods. 2006;3:793–795. doi: 10.1038/nmeth929. - DOI - PMC - PubMed
    1. Betzig E, et al. Imaging intracellular fluorescent proteins at nanometer resolution. Science. 2006;313:1642–1645. doi: 10.1126/science.1127344. - DOI - PubMed
    1. Sharonov A, Hochstrasser RM. Wide-field subdiffraction imaging by accumulated binding of diffusing probes. Proc. Natl Acad. Sci. USA. 2006;103:18911–18916. doi: 10.1073/pnas.0609643104. - DOI - PMC - PubMed

Publication types

Substances