Review
. 2022 Oct 17;12(1):17362.
doi: 10.1038/s41598-022-21563-z.

Global distribution of soil fauna functional groups and their estimated litter consumption across biomes

Affiliations
Review

Global distribution of soil fauna functional groups and their estimated litter consumption across biomes

Petr Heděnec et al. Sci Rep. .

Abstract

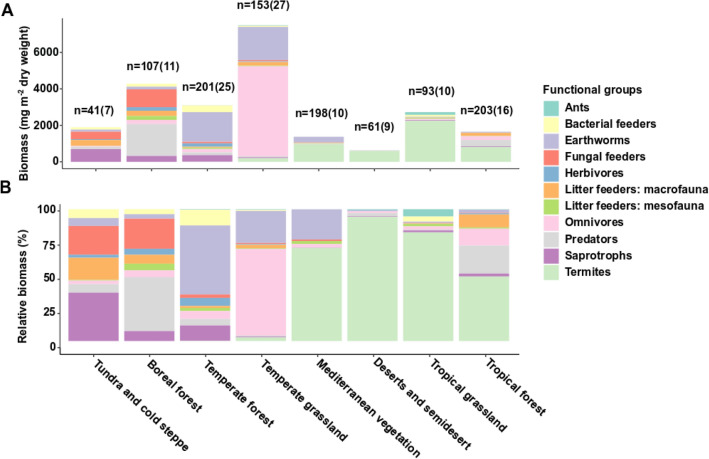
Soil invertebrates (i.e., soil fauna) are important drivers of many key processes in soils including soil aggregate formation, water retention, and soil organic matter transformation. Many soil fauna groups directly or indirectly participate in litter consumption. However, the quantity of litter consumed by major faunal groups across biomes remains unknown. To estimate this quantity, we reviewed > 1000 observations from 70 studies that determined the biomass of soil fauna across various biomes and 200 observations from 44 studies on litter consumption by soil fauna. To compare litter consumption with annual litterfall, we analyzed 692 observations from 24 litterfall studies and 183 observations from 28 litter stock studies. The biomass of faunal groups was highest in temperate grasslands and then decreased in the following order: boreal forest > temperate forest > tropical grassland > tundra > tropical forest > Mediterranean ecosystems > desert and semidesert. Tropical grasslands, desert biomes, and Mediterranean ecosystems were dominated by termites. Temperate grasslands were dominated by omnivores, while temperate forests were dominated by earthworms. On average, estimated litter consumption (relative to total litter input) ranged from a low of 14.9% in deserts to a high of 100.4% in temperate grassland. Litter consumption by soil fauna was greater in grasslands than in forests. This is the first study to estimate the effect of different soil fauna groups on litter consumption and related processes at global scale.


Conflict of interest statement

The authors declare no competing interests.

Figures

Figure 1
Figure 1
Global distribution among biomes of the biomass (A) and the relative biomass (B) of soil fauna functional groups. The n refers to number of observations based on individual habitat studies. Number in parentheses refers to number of published studies.
Figure 2
Figure 2
Non-metric multidimensional scaling (NMDS) of climatic factors, litter quality, and biomass of soil fauna functional groups. Red arrows indicate climatic factors and litter quality. Black arrows indicate biomass of soil fauna functional groups. NMDS procedure computed configuration in 999 iterations with a stress value of 0.013.
Figure 3
Figure 3
Heatmap of Pearson’s correlation coefficients for the relationships between the biomass of soil fauna by functional group and the following variables: fine root biomass, litterfall, net primary production (NPP), mean annual temperature (MAT), mean annual precipitation (MAP), N content of soil, N content of litter, and the litter C:N ratio. Asterisks indicate significant correlations: *, **, and *** indicate p < 0.05, < 0.01, and < 0.001, respectively. Bonferoni corrections were used to adjust p value of multiple correlations. Blue color indicates positive correlation. Red color indicates negative correlation.
Figure 4
Figure 4
Path model based on the direct effects of climate (MAT, MAP), soil (soil N and C:N ratio), and productivity (NPP, N (litter) and mean annual litterfall) on biomass of soil fauna functional groups associated with litter transformation (earthworms, termites, saprotrophs, herbivores, litter feeding mesofauna and macrofauna). Solid lines indicate direct effects. Goodness of Fit (GoF) = 0.72. Asterisks indicate significant effect: *, **, and *** indicate p < 0.05, < 0.01, and < 0.001, respectively.
Figure 5
Figure 5
Mean annual litterfall and estimated consumption of litterfall by soil fauna across biomes (A) and estimated quantity of belowground living fine roots consumed by belowground herbivores across biomes (B). Values for annual litterfall in (A) and fine root biomass (B) are means ± SE.

References

    1. Bardgett RD, van der Putten WH. Belowground biodiversity and ecosystem functioning. Nature. 2014;515:505–511. doi: 10.1038/nature13855. - DOI - PubMed
    1. Fierer N. Embracing the unknown: Disentangling the complexities of the soil microbiome. Nat. Rev. Microbiol. 2017 doi: 10.1038/nrmicro.2017.87. - DOI - PubMed
    1. Frouz J. Effects of soil macro- and mesofauna on litter decomposition and soil organic matter stabilization. Geoderma. 2018;332:161–172. doi: 10.1016/j.geoderma.2017.08.039. - DOI
    1. Hicks Pries CE, Castanha C, Porras R, Phillips C, Torn MS. Response to comment on “The whole-soil carbon flux in response to warming”. Science. 2018;359:1420–1423. doi: 10.1126/science.aao0457. - DOI - PubMed
    1. Lavelle P, et al. Soil function in a changing world: The role of invertebrate ecosystem engineers. Eur. J. Soil Biol. 1997;33:159–193.

Publication types