. 2022 Dec;6(12):1649-1659.
doi: 10.1038/s41562-022-01450-3. Epub 2022 Oct 17.

Life expectancy changes since COVID-19

Affiliations

Life expectancy changes since COVID-19

Jonas Schöley et al. Nat Hum Behav. 2022 Dec.

Abstract

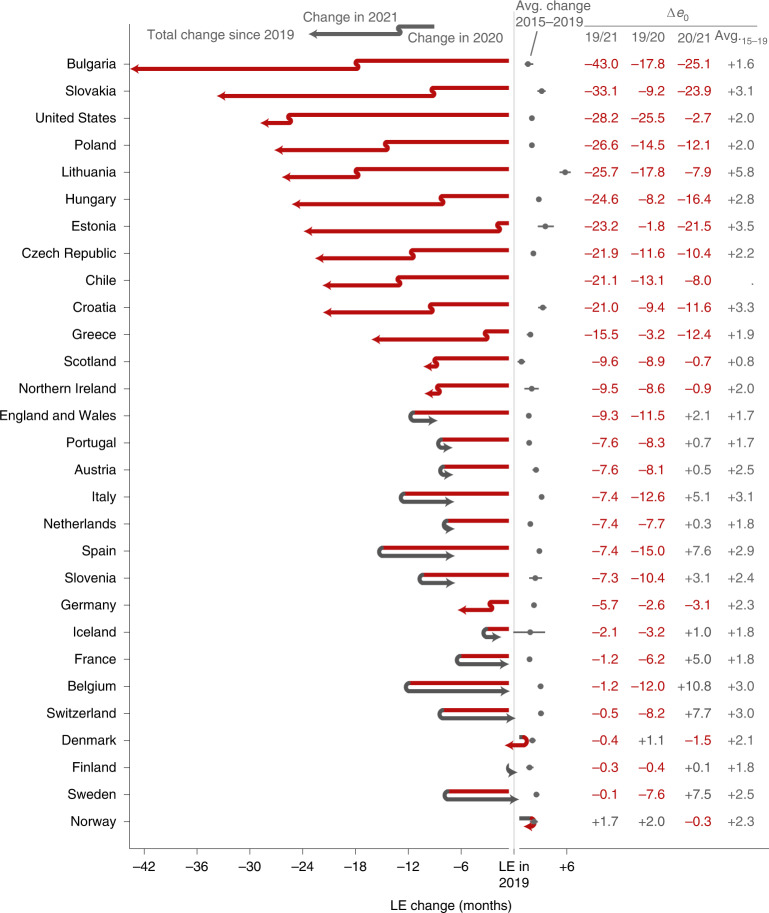
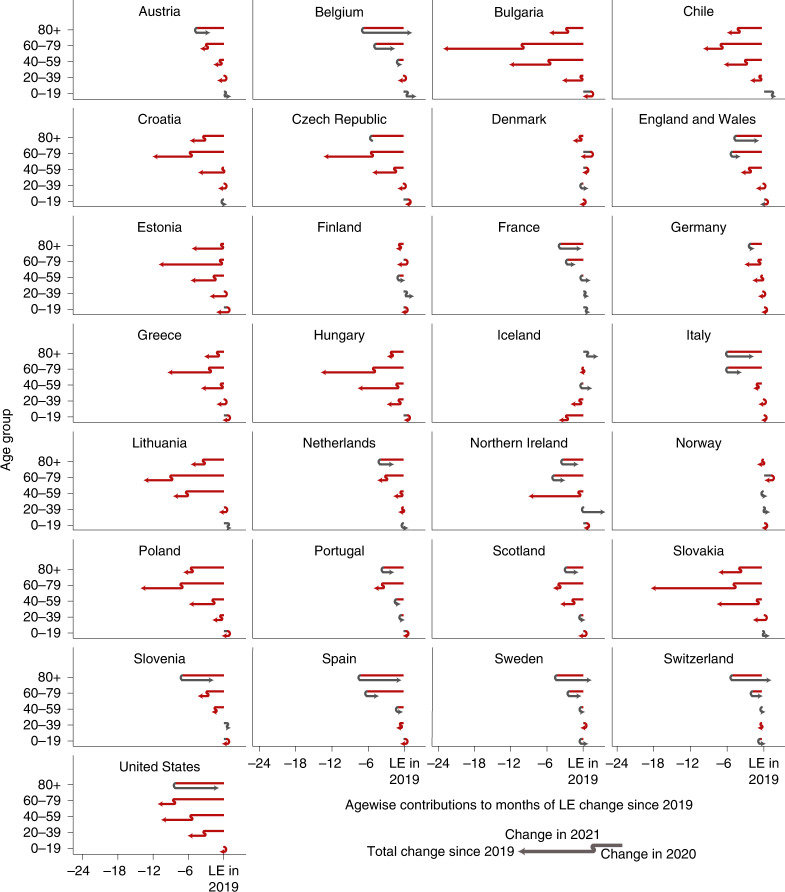
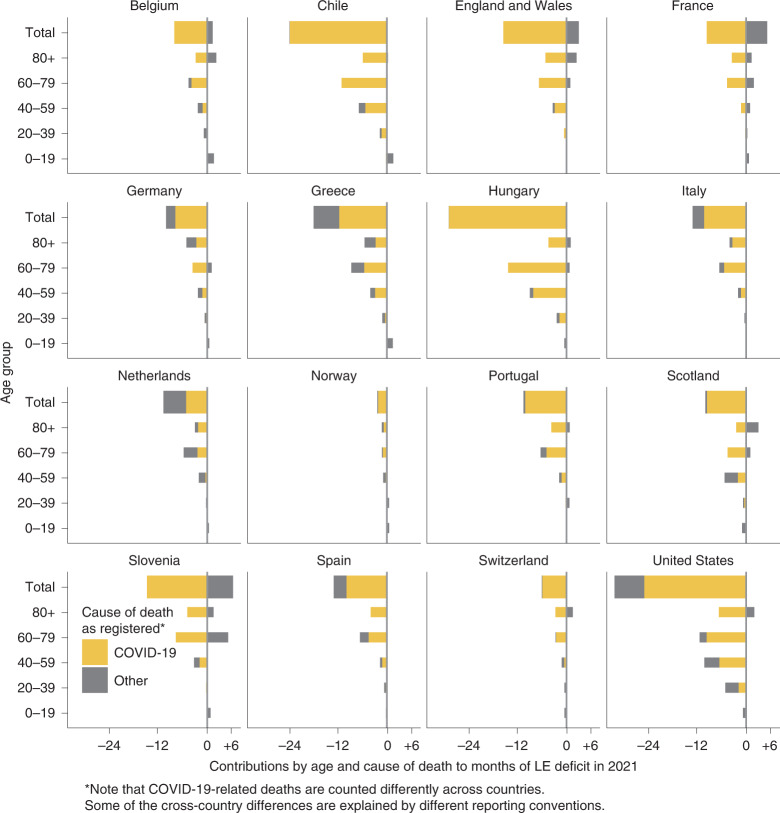
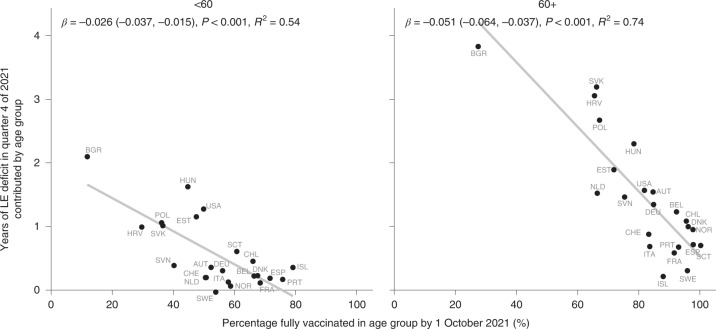
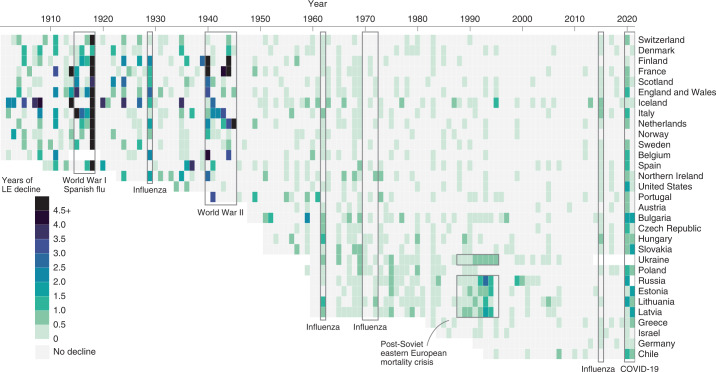
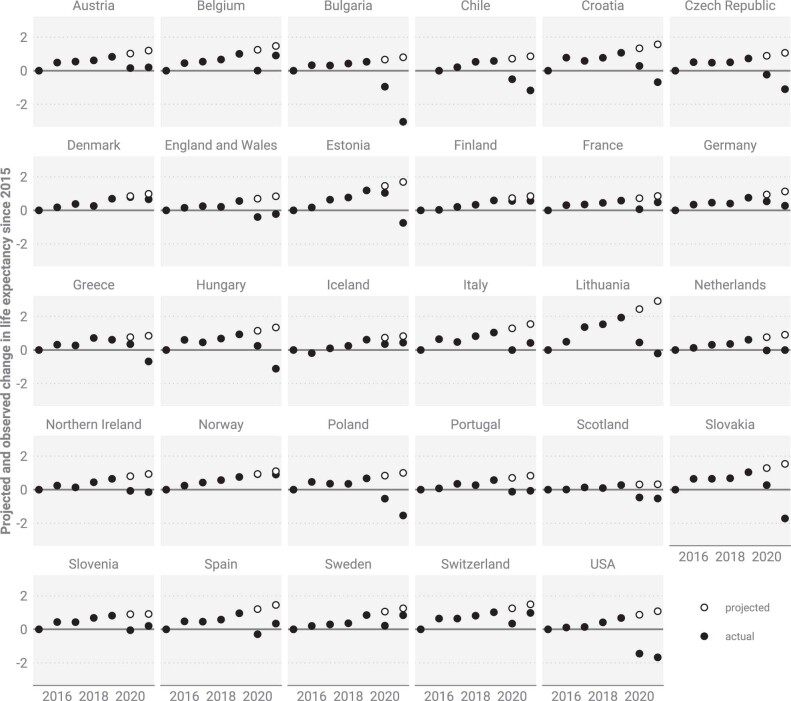
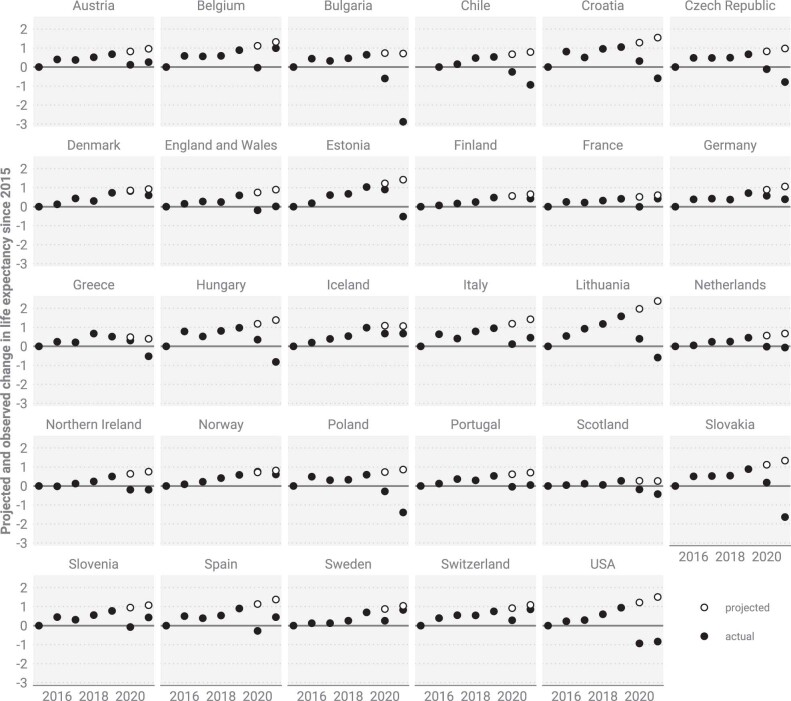
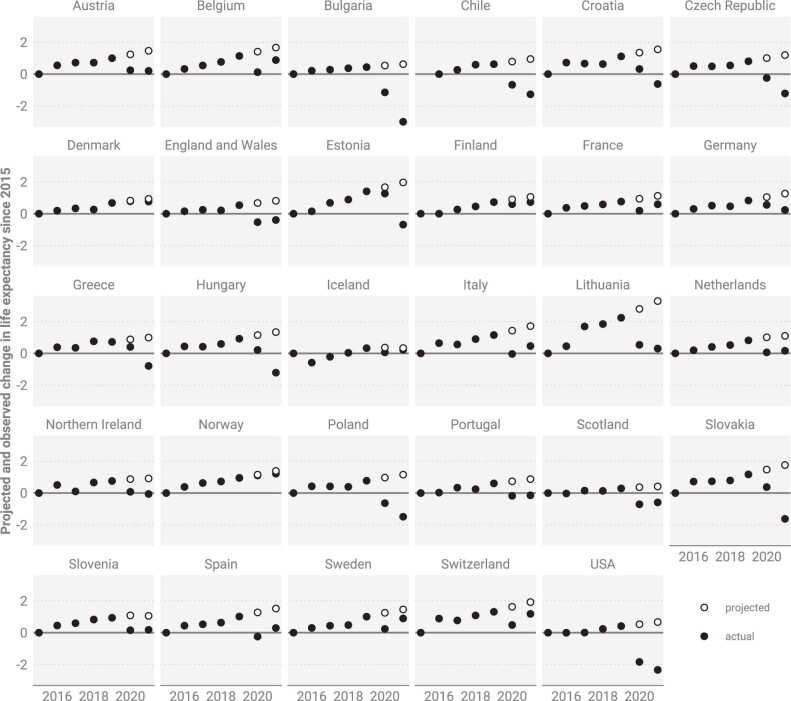
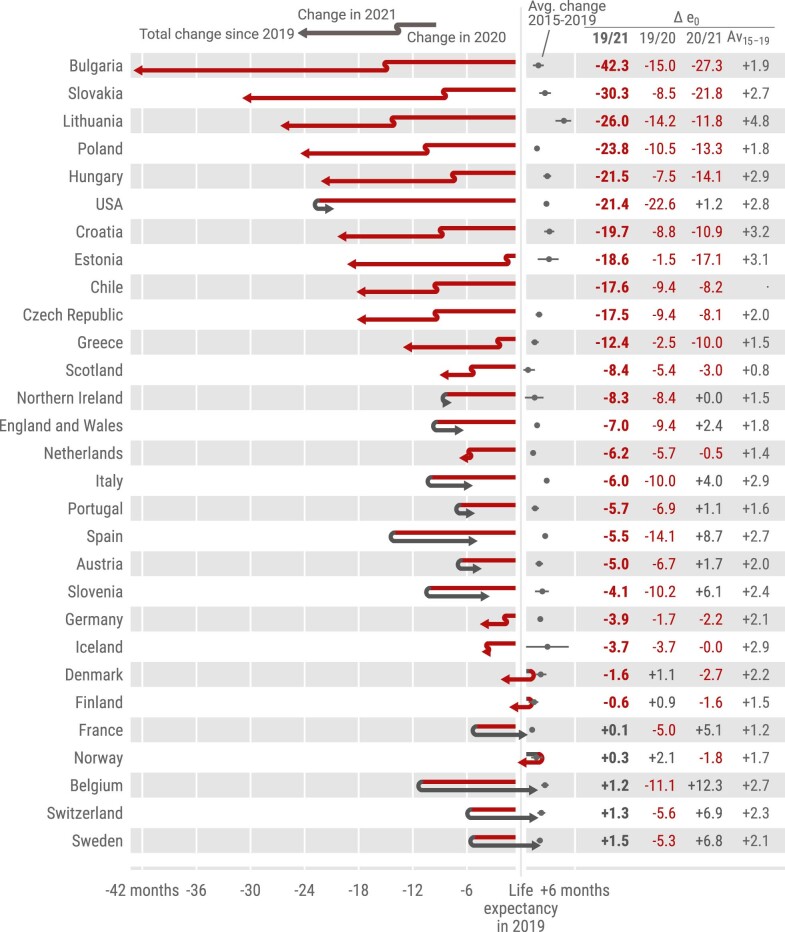
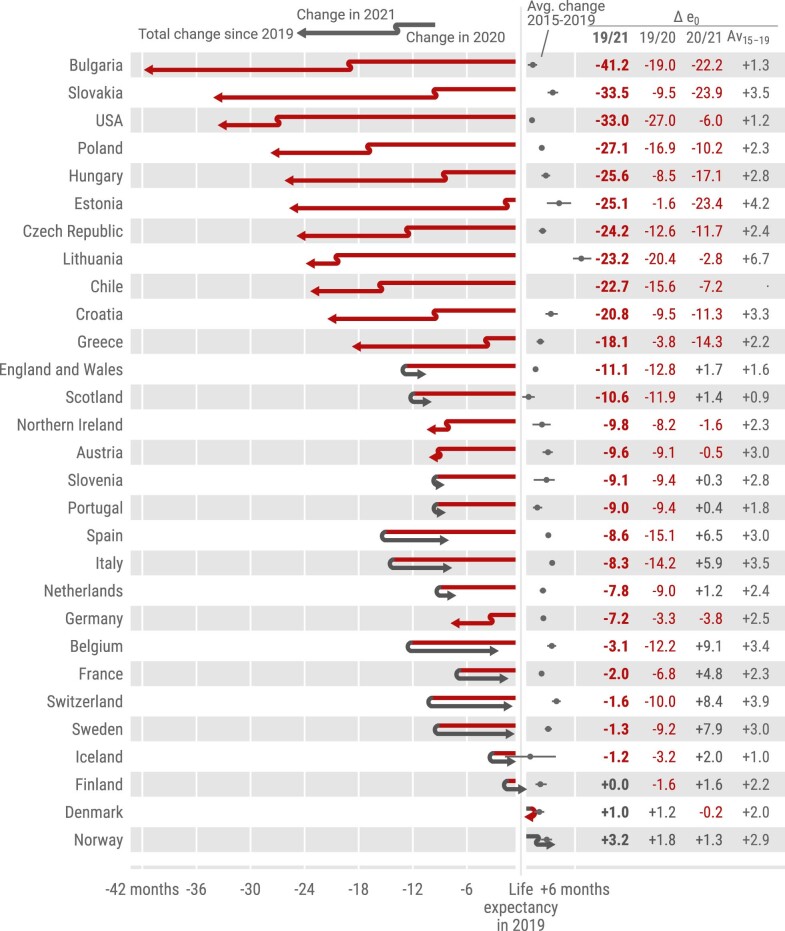
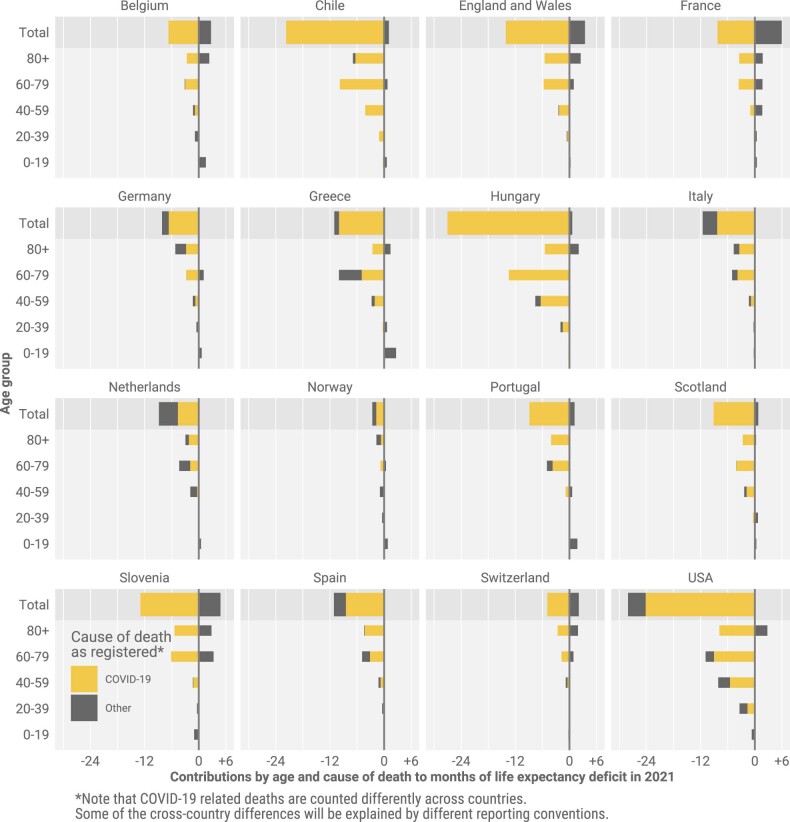
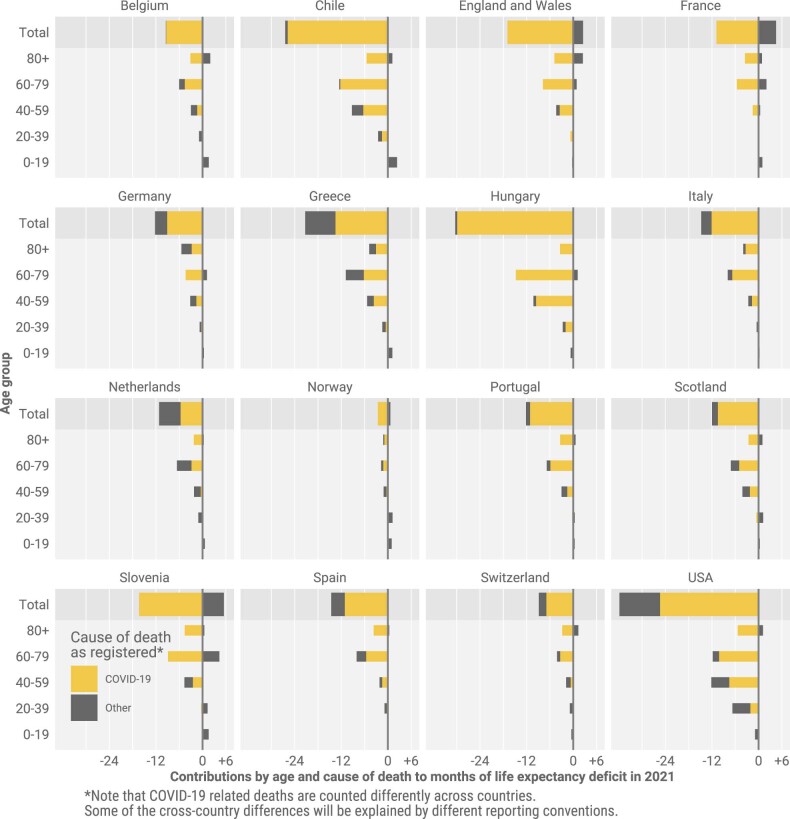
The COVID-19 pandemic triggered an unprecedented rise in mortality that translated into life expectancy losses around the world, with only a few exceptions. We estimate life expectancy changes in 29 countries since 2020 (including most of Europe, the United States and Chile), attribute them to mortality changes by age group and compare them with historic life expectancy shocks. Our results show divergence in mortality impacts of the pandemic in 2021. While countries in western Europe experienced bounce backs from life expectancy losses of 2020, eastern Europe and the United States witnessed sustained and substantial life expectancy deficits. Life expectancy deficits during fall/winter 2021 among people ages 60+ and <60 were negatively correlated with measures of vaccination uptake across countries (r60+ = -0.86; two-tailed P < 0.001; 95% confidence interval, -0.94 to -0.69; r<60 = -0.74; two-tailed P < 0.001; 95% confidence interval, -0.88 to -0.46). In contrast to 2020, the age profile of excess mortality in 2021 was younger, with those in under-80 age groups contributing more to life expectancy losses. However, even in 2021, registered COVID-19 deaths continued to account for most life expectancy losses.


Conflict of interest statement

The authors declare no competing interests.

Figures

Fig. 1
Fig. 1. LE changes in 2019–2020 and 2020–2021 across countries.
The countries are ordered by increasing cumulative LE losses since 2019. The two line segments indicate the annual changes in LE in 2020 and 2021. Red segments to the left indicate an LE drop, while grey arrows to the right indicate a rise in LE. The position of the arrowhead indicates the total change in LE from 2019 through 2021. The grey dots and lines indicate the average annual LE changes over the years 2015 through 2019 along with 95% CIs. Δe0 marks the change in period LE over the designated period.
Fig. 2
Fig. 2. Age contributions to LE changes since 2019 separated for 2020 and 2021.
The position of the arrowhead indicates the contribution of mortality changes in a given age group to the change in LE at birth since 2019. The discontinuity in the arrow indicates those contributions separately for the years 2020 and 2021. Annual contributions can compound or reverse. Red indicates negative contributions, and grey indicates positive contributions. The total LE change from 2019 to 2021 in a given country is the sum of the arrowhead positions across ages.
Fig. 3
Fig. 3. Changes in the female LE advantage from 2019 through 2021.
The blue upwards arrows indicate increases and the red downwards arrows indicate decreases in the female LE advantage. We tested the hypothesis of no change in the sex gap between 2019 and 2021. *P ≤ 0.05; ***P ≤ 0.001.
Fig. 4
Fig. 4. LE deficit in 2021 decomposed into contributions by age and cause of death.
LE deficit is defined as observed minus expected LE had pre-pandemic mortality trends continued.
Fig. 5
Fig. 5. Years of LE deficit in October through December 2021 contributed by ages <60 and 60+ against percentage of population twice vaccinated by 1 October in the respective age groups.
LE deficit is defined as the counterfactual LE from a Lee–Carter mortality forecast based on death rates for the fourth quarter of the years 2015 to 2019 minus observed LE. The points are labelled with ISO three-letter country codes.
Fig. 6
Fig. 6. Annual LE declines since 1900.
Period shocks to LE due to wars and epidemics show up as green vertical bands across countries, momentarily disrupting the dominant trend of expectancy improvements, shown in grey.
Extended Data Fig. 1
Extended Data Fig. 1. Actual and forecast total population life expectancy change since 2015.
LE forecasts are based on the Lee-Carter model based upon the assumption that pre-pandemic mortality trends would have continued into 2020 and 2021.
Extended Data Fig. 2
Extended Data Fig. 2. Actual and forecast female life expectancy change since 2015.
LE forecasts are based on the Lee-Carter model based upon the assumption that pre-pandemic mortality trends would have continued into 2020 and 2021.
Extended Data Fig. 3
Extended Data Fig. 3. Actual and forecast male life expectancy change since 2015.
LE forecasts are based on the Lee-Carter model based upon the assumption that pre-pandemic mortality trends would have continued into 2020 and 2021.
Extended Data Fig. 4
Extended Data Fig. 4. Female life expectancy changes 2019-20 and 2020-21 across countries.
The countries are ordered by increasing cumulative life expectancy losses since 2019. The two line segments indicate the annual changes in life expectancy in 2020 and 2021 respectively. Red segments to the left indicate a life expectancy drop while gray arrows to the right indicate a rise in life expectancy. The position of the arrowhead indicates the total change in life expectancy from 2019 through 2021. Grey dots and lines indicate the average annual LE changes over the years 2015 through 2019 along with 95% confidence intervals.
Extended Data Fig. 5
Extended Data Fig. 5. Male life expectancy changes 2019-20 and 2020-21 across countries.
The countries are ordered by increasing cumulative life expectancy losses since 2019. The two line segments indicate the annual changes in life expectancy in 2020 and 2021 respectively. Red segments to the left indicate a life expectancy drop while gray arrows to the right indicate a rise in life expectancy. The position of the arrowhead indicates the total change in life expectancy from 2019 through 2021. Grey dots and lines indicate the average annual LE changes over the years 2015 through 2019 along with 95% confidence intervals.
Extended Data Fig. 6
Extended Data Fig. 6. Female life expectancy deficit in 2021 decomposed into contributions by age and cause of death.
LE deficit is defined as observed minus expected life expectancy had pre-pandemic mortality trends continued.
Extended Data Fig. 7
Extended Data Fig. 7. Male life expectancy deficit in 2021 decomposed into contributions by age and cause of death.
LE deficit is defined as observed minus expected life expectancy had pre-pandemic mortality trends continued.

References

    1. Riley JC. Estimates of regional and global life expectancy, 1800–2001. Popul. Dev. Rev. 2005;31:537–543. doi: 10.1111/j.1728-4457.2005.00083.x. - DOI
    1. Raleigh, V. S. Trends in Life Expectancy in EU and Other OECD Countries: Why Are Improvements Slowing? OECD Health Working Papers (OECD, 2019); 10.1787/223159ab-en
    1. Ho JY, Hendi AS. Recent trends in life expectancy across high income countries: retrospective observational study. BMJ. 2018;362:k2562. doi: 10.1136/bmj.k2562. - DOI - PMC - PubMed
    1. Hiam L, Harrison D, McKee M, Dorling D. Why is life expectancy in England and Wales ‘stalling’? J. Epidemiol. Community Health. 2018;72:404–408. doi: 10.1136/jech-2017-210401. - DOI - PubMed
    1. Fenton L, et al. Recent adverse mortality trends in Scotland: comparison with other high-income countries. BMJ Open. 2019;9:e029936. doi: 10.1136/bmjopen-2019-029936. - DOI - PMC - PubMed

Publication types