. 2022 Oct 17;5(1):154.
doi: 10.1038/s41746-022-00697-4.

The effect of COVID-19 on the home behaviours of people affected by dementia

Affiliations

The effect of COVID-19 on the home behaviours of people affected by dementia

Alina-Irina Serban et al. NPJ Digit Med. .

Abstract

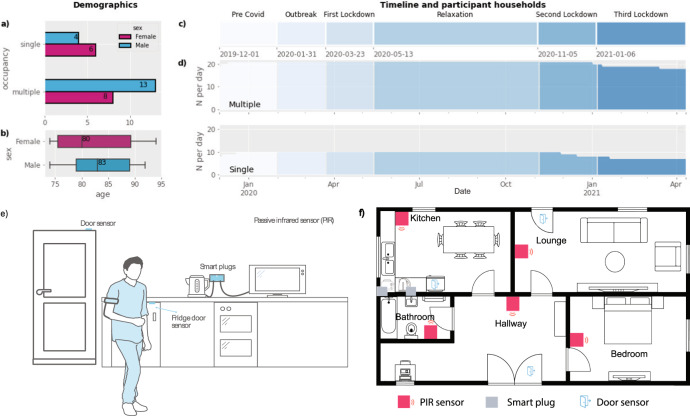
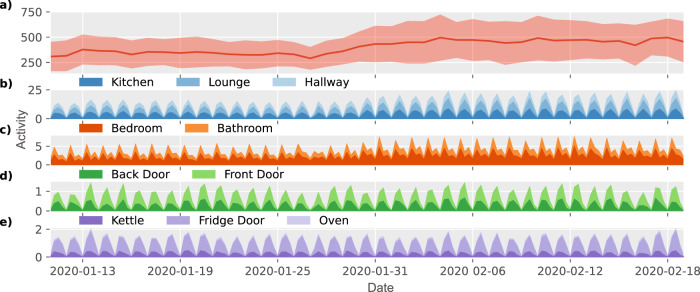
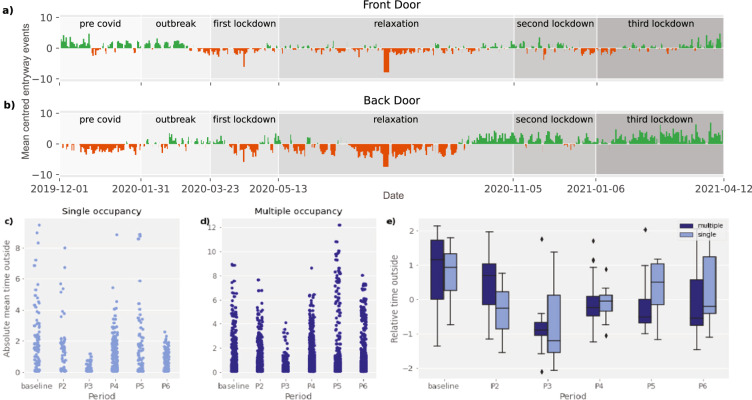
The COVID-19 pandemic has dramatically altered the behaviour of most of the world's population, particularly affecting the elderly, including people living with dementia (PLwD). Here we use remote home monitoring technology deployed into 31 homes of PLwD living in the UK to investigate the effects of COVID-19 on behaviour within the home, including social isolation. The home activity was monitored continuously using unobtrusive sensors for 498 days from 1 December 2019 to 12 April 2021. This period included six distinct pandemic phases with differing public health measures, including three periods of home 'lockdown'. Linear mixed-effects modelling is used to examine changes in the home activity of PLwD who lived alone or with others. An algorithm is developed to quantify time spent outside the home. Increased home activity is observed from very early in the pandemic, with a significant decrease in the time spent outside produced by the first lockdown. The study demonstrates the effects of COVID-19 lockdown on home behaviours in PLwD and shows how unobtrusive home monitoring can be used to track behaviours relevant to social isolation.


Conflict of interest statement

The authors declare no competing interests.

Figures

Fig. 1
Fig. 1. Cohort description and home monitoring system.
a, b Household occupancy, sex and age distributions (boxplot shows the minima and maxima values, lower and upper quartiles, and the medians); c Timeline for data collection over the COVID-19 pandemic; d Number of participant households throughout the study; e Sensors contributing to the data reported in this study: passive infra-red movement sensors on the wall and door, as well as smart plugs to monitor household appliance use; f typical layout of sensors in exemplar home.
Fig. 2
Fig. 2. Change in home activity at the transition between P1 (pre-COVID-19 baseline) and P2 (COVID-19 outbreak).
a Total mean daily activity summed across households from 10 January 2020 to 20 February 2020 demonstrating gradual increase in activity during the initial outbreak period (light pink represents standard deviation per day); be Mean activity summed across the different sensors and locations sampled at a 6 h frequency demonstrates the daily behavioural cycle across different sensors as well as the gradual increase in activity as a function of covid.
Fig. 3
Fig. 3. Changes in mean daily activity (sensor triggers) level during COVID-19.
a Mean daily activity across households according to occupancy before and during COVID-19 (boxplot shows the minima and maxima values, lower and upper quartiles, and the medians); b Mean daily activity across households according to occupancy during the different pandemic periods (boxplot shows the minima and maxima values, lower and upper quartiles, and the medians) and c Distribution of mean daily activity across households during day and night before and during COVID-19.
Fig. 4
Fig. 4. Changes in entryway events and time spent outside during COVID-19.
a, b Mean-centred daily mean entryway events across the different periods for the front and back door; c, d Raw total daily time spent outside for single and multiple occupancy households for the six pandemic periods; e Standardised mean time spent outside across households during the different periods identified (boxplot shows the minima and maxima values, lower and upper quartiles, and the medians).

References

    1. Giebel C, et al. A UK survey of COVID-19 related social support closures and their effects on older people, people with dementia, and carers. Int. J. Geriatr. Psychiatry. 2021;36:393–402. doi: 10.1002/gps.5434. - DOI - PMC - PubMed
    1. Tuijt R, et al. Life under lockdown and social restrictions—the experiences of people living with dementia and their carers during the COVID-19 pandemic in England. BMC Geriatr. 2021;21:301. doi: 10.1186/s12877-021-02257-z. - DOI - PMC - PubMed
    1. Alzheimer’s Society. Office of National Statistics figures show dementia is main underlying condition for COVID-19 deaths. https://www.alzheimers.org.uk/news/2020-05-15/ons-figures-show-dementia-... (2020).
    1. Curelaru A, Marzolf SJ, Provost J-CKG, Zeon HHH. Social isolation in dementia: the effects of COVID-19. J. Nurse Pract. 2021;17:950–953. doi: 10.1016/j.nurpra.2021.05.002. - DOI - PMC - PubMed
    1. Martins Van Jaarsveld, G. The effects of COVID-19 among the elderly population: a case for closing the digital divide. Front. Psychiatry10.3389/fpsyt.2020.577427 (2020). - PMC - PubMed