. 2023 Feb;19(2):159-167.
doi: 10.1038/s41589-022-01147-8. Epub 2022 Oct 17.

A small molecule inhibitor prevents gut bacterial genotoxin production

Affiliations

A small molecule inhibitor prevents gut bacterial genotoxin production

Matthew R Volpe et al. Nat Chem Biol. 2023 Feb.

Abstract

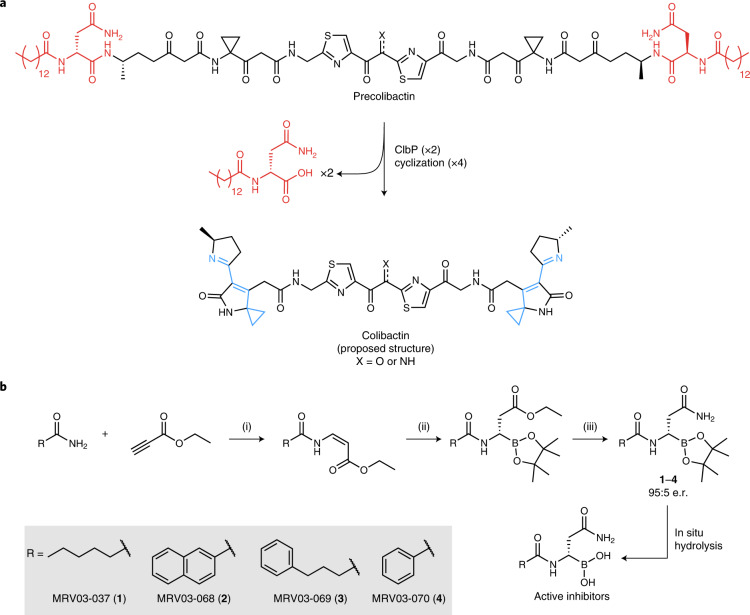
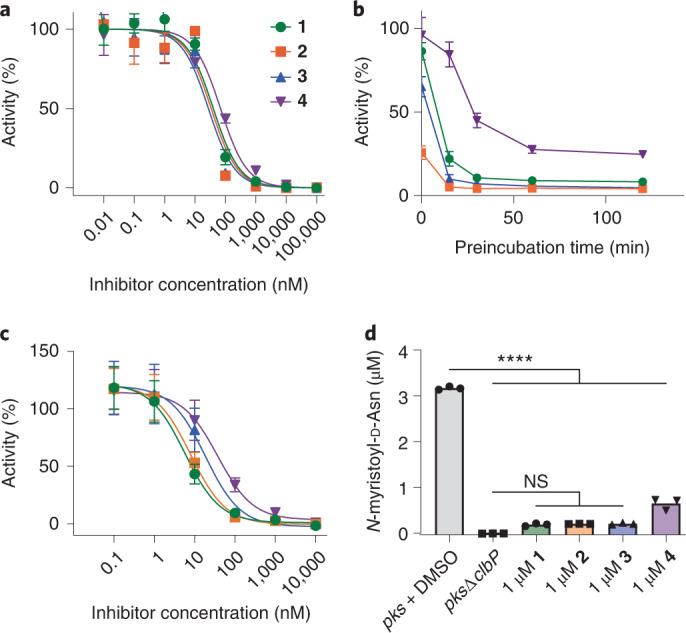
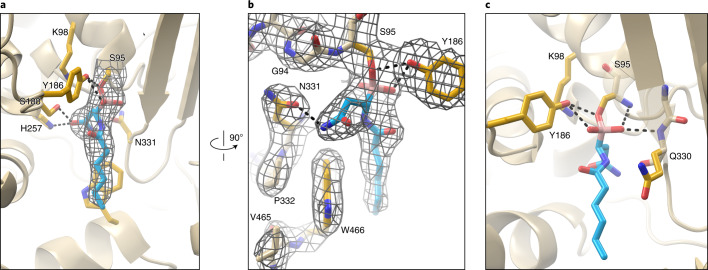
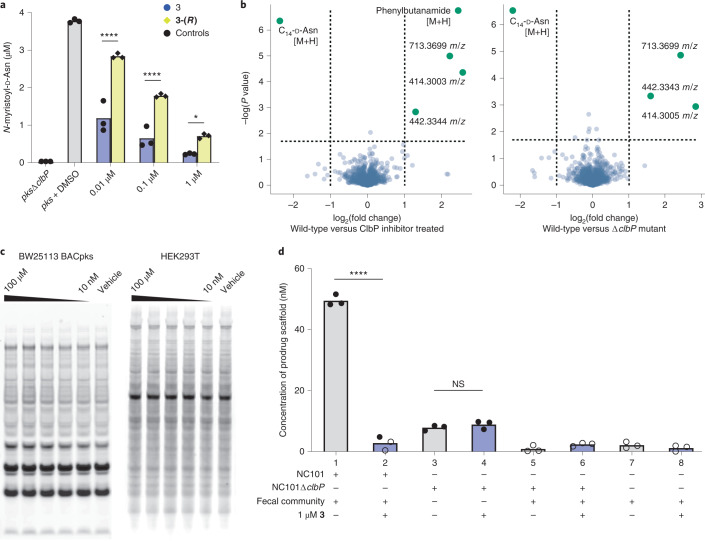
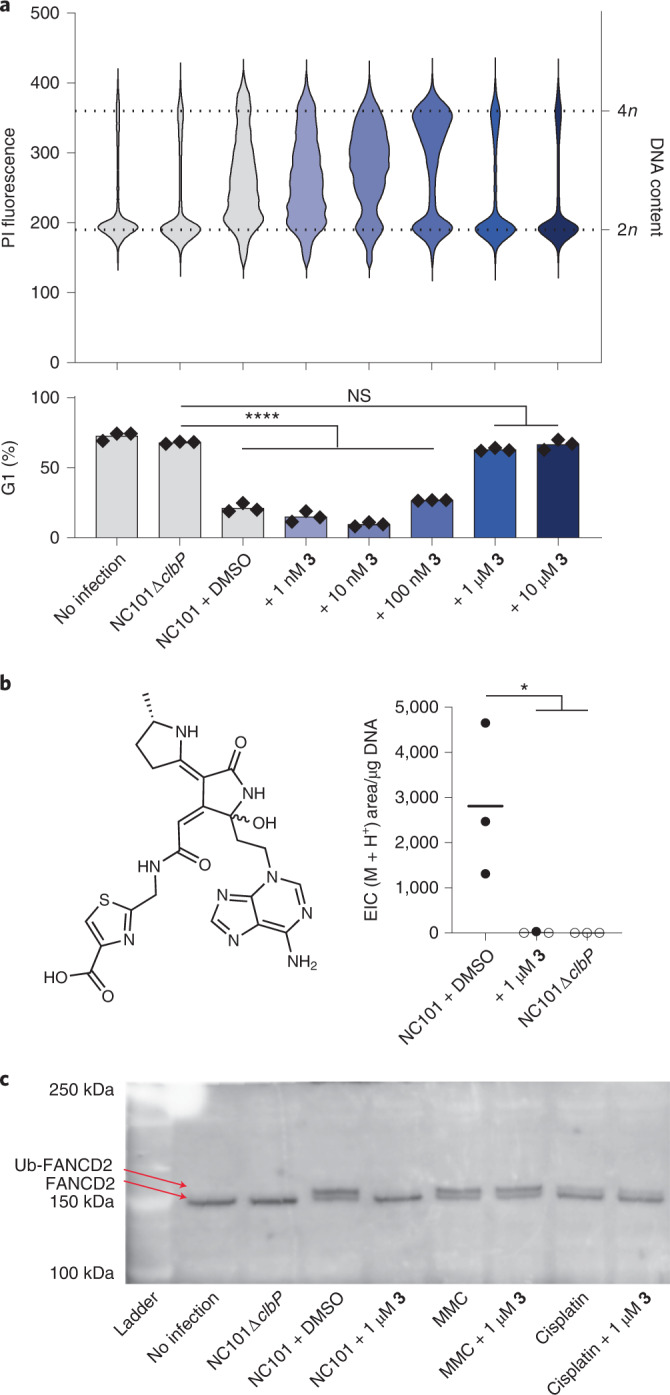
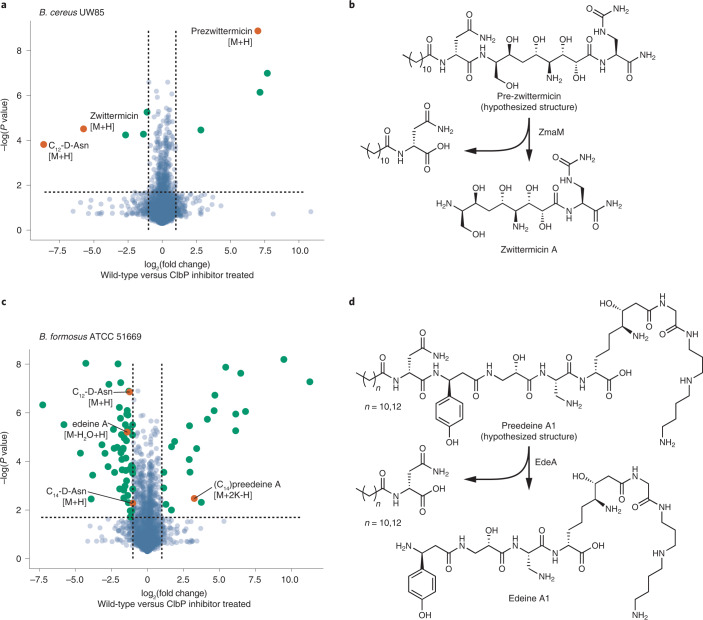
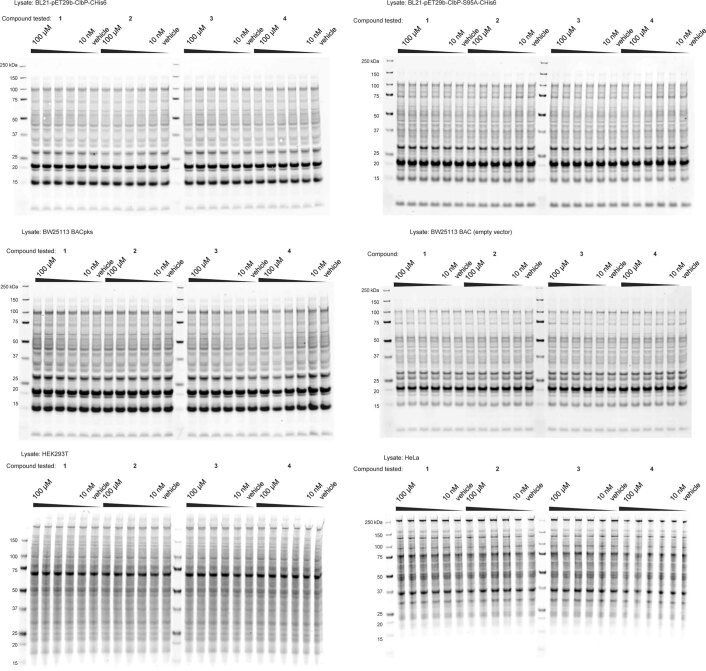
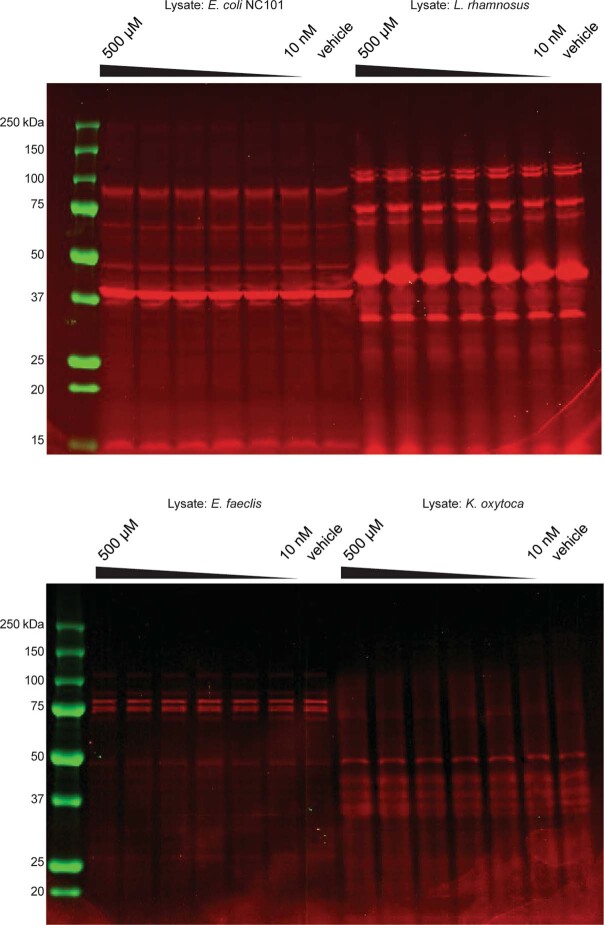
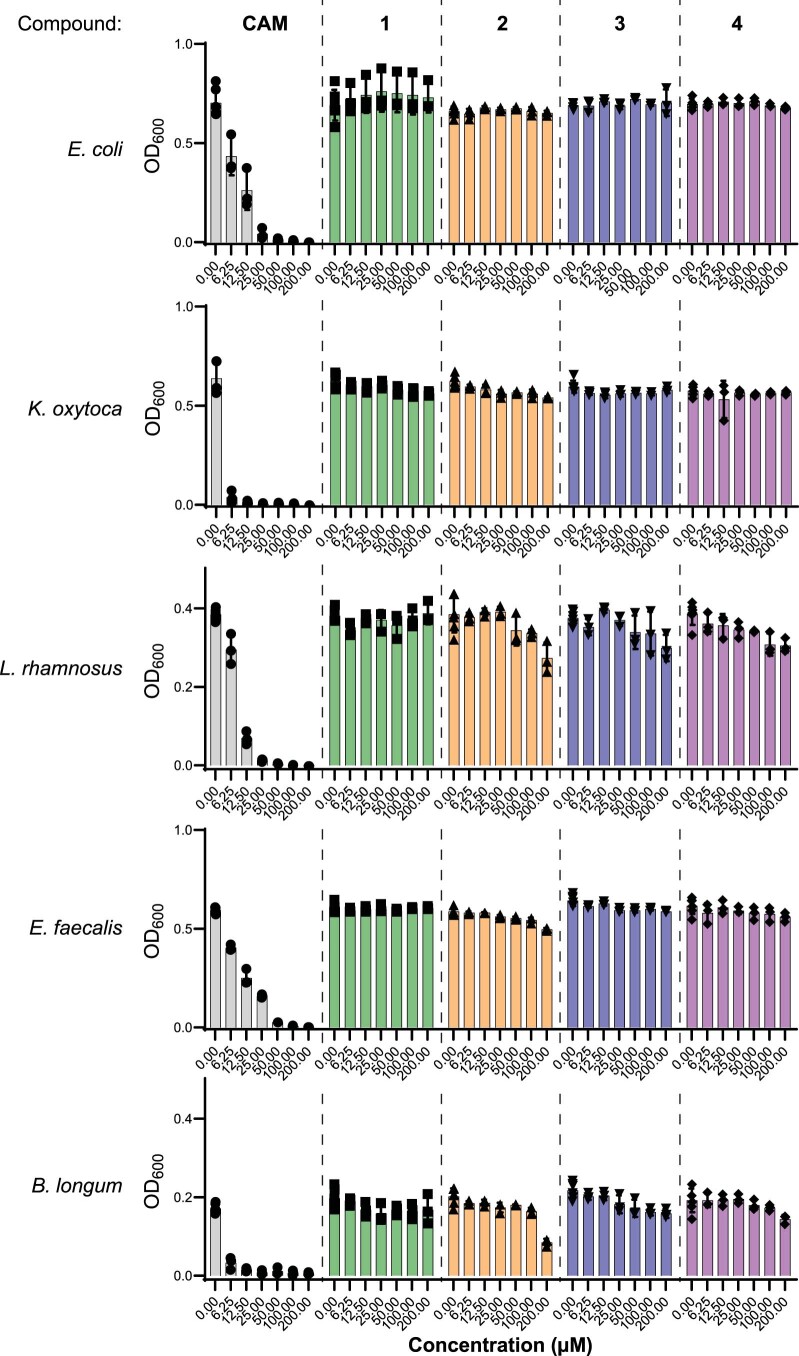
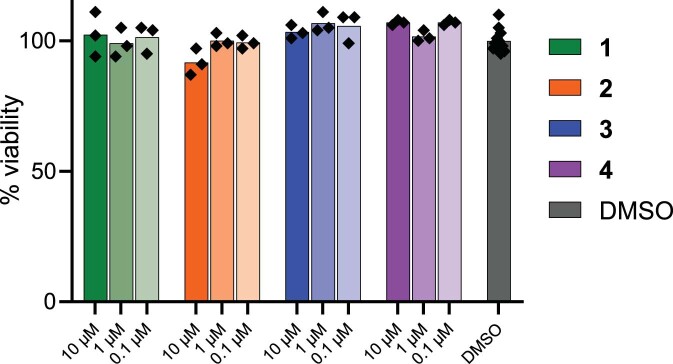
The human gut bacterial genotoxin colibactin is a possible key driver of colorectal cancer (CRC) development. Understanding colibactin's biological effects remains difficult owing to the instability of the proposed active species and the complexity of the gut microbiota. Here, we report small molecule boronic acid inhibitors of colibactin biosynthesis. Designed to mimic the biosynthetic precursor precolibactin, these compounds potently inhibit the colibactin-activating peptidase ClbP. Using biochemical assays and crystallography, we show that they engage the ClbP binding pocket, forming a covalent bond with the catalytic serine. These inhibitors reproduce the phenotypes observed in a clbP deletion mutant and block the genotoxic effects of colibactin on eukaryotic cells. The availability of ClbP inhibitors will allow precise, temporal control over colibactin production, enabling further study of its contributions to CRC. Finally, application of our inhibitors to related peptidase-encoding pathways highlights the power of chemical tools to probe natural product biosynthesis.


Conflict of interest statement

E.P.B. and M.R.V. are listed as inventors on a provisional patent (US application 63/135,825) that relates to the methods and compounds described here. The remaining authors declare no competing interests.

Figures

Fig. 1
Fig. 1. Activity of ClbP guides rational design of colibactin biosynthesis inhibitors.
a, ClbP activates colibactin by removing an N-myristoyl-d-Asn prodrug scaffold (red). Hydrolysis of two amide bonds by ClbP leads to the formation of two electrophilic warheads (cyan) capable of DNA alkylation. Inhibitor design was guided by the two key recognition features of the prodrug scaffold: a d-Asn side chain, which is essential, and a lipid group, which can be modified. b, Synthesis of ClbP inhibitors: (i) Pd(OAc)2, NaOAc, trifluoroacetic acid, PhMe, 80 °C, 12 h; (ii) CuCl (0.1 equivalent), (R)-SEGPHOS (0.11 equivalent), bis(pinacolato)diboron (1.1 equivalents), KOt-Bu (1 equivalent), MeOH (4 equivalents), tetrahydrofuran, 3 h; (iii) NaCN (0.2 equivalent), NH3, MeOH, 1 h. e.r., enantiomeric ratio.
Fig. 2
Fig. 2. Compounds 14 inhibit ClbP activity.
a, ClbP activity in vitro upon treatment with 14 using a fluorescent substrate analog. b, ClbP activity in vitro upon treatment with 14 at 100 nM and varying incubation time before initiating the assay. c, Activity of E. coli overexpressing ClbP toward a fluorescent substrate analog after treatment with 14. For panels ac, symbols show mean value of n = 4 biological replicates for each condition, error bars are 1 s.d. d, LC–MS measurement of N-myristoyl-d-asparagine released from BWpks after treatment with vehicle or 14. n = 3 biological replicates. ****P < 0.0001; not significant (NS), P > 0.05, one-way ANOVA and Dunnett’s multiple comparison test. See Methods for calculation of percent activity in fluorescence assays. Source data
Fig. 3
Fig. 3. Compound 1 binds the catalytic serine of ClbP directly.
a, A 2.7-Å resolution structure of ClbP crystallized in the presence of 1 shows the compound (cyan sticks) bound in the expected pocket of the active site near the catalytic triad. Continuous electron density in the polder difference map contoured at 7σ (gray mesh) indicates the inhibitor is covalently bound to S95. b, A 90° rotation relative to a details the 2Fo–Fc density map contoured at 1σ for the inhibitor and proximal residues. N331 mediates recognition of the d-Asn side chain. c, The boronate ester, a structural mimic of the tetrahedral intermediates in colibactin hydrolysis, is stabilized by hydrogen bonds from Q330 and Y186.
Fig. 4
Fig. 4. Compound 3 is selective for ClbP inhibition and active in a community setting.
a, LC–MS measurement of N-myristoyl-d-Asn released from BWpks after treatment with 3 or 5. n = 3 biological replicates, individual replicates shown. b, Volcano plot representation of metabolites detected by LC–MS that are altered in BWpks treated with 1 µM of compound 3 versus untreated (left) and BWΔP versus BWpks (right). Previously characterized colibactin precursor metabolites are labeled with their m/z. n = 5 biological replicates for all conditions. c, Gel-based ABPP using a FP-biotin probe to examine the reactivity of serine hydrolases in E. coli and HEK293T cell lysates does not identify any major targets of compound 3. ClbP is not detected in this assay because of a lack of interaction between it and FP. d, LC–MS measurement of the prodrug scaffold in extracts of E. coli NC101 and E. coli NC101ΔclbP cultured with and without compound 3 and with or without a community of organisms resuspended from fecal pellets of C57BL/6J mice. The levels of prodrug scaffold observed in conditions 3 and 4 are expected as a side product from the upstream enzymes in colibactin biosynthesis. n = 3 biological replicates for all conditions, individual replicates shown. Empty circles are below the limit of quantitation for this protocol (4 nM). ****P < 0.0001; *P < 0.05; NS, P > 0.05; one-way ANOVA and Bonferroni’s multiple comparison test. Source data
Fig. 5
Fig. 5. Compound 3 prevents colibactin-induced genotoxicity in human cells.
a, Flow cytometry analysis of HeLa cells infected with NC101 and treated with 3. Cells were fixed in ethanol before staining with propidium iodide (PI) for DNA content. The increase in the population fraction with >2n DNA content indicates cell-cycle arrest. Top: raw histograms for PI fluorescence intensity in the population for one representative sample for each condition. Bottom: percentage of the population in G1 phase based on fitting histograms to the Watson cell-cycle analysis model. Black symbols are individual replicates, bars show average value. All conditions were run in three biological replicates. Shading indicates the concentration of inhibitor. Gating strategy for flow cytometry is shown in Extended Data Fig. 7. b, Structure of two diastereomeric DNA adducts known to be derived from colibactin. LC–MS detection of these adducts (M+H+ = m/z 540.1772) in hydrolyzed genomic DNA extracted from HeLa cells infected with NC101, three biological replicates are shown. Empty circles indicate sample was below the detection limit. For a and b ****P < 0.0001; *P < 0.05; NS, P > 0.05; one-way ANOVA and Dunnett’s multiple comparison test. c, Western blot for FANCD2 in HeLa cell extracts. All conditions were run in three biological replicates with one representative sample shown. Source data
Fig. 6
Fig. 6. Compound 3 can be used to manipulate other natural product biosynthesis pathways.
a,c, Comparative metabolomic analysis of culture supernatants of (a) B. cereus UW85 and (c) B. formosus ATCC 51669 treated with inhibitor 3 versus untreated. Inhibitor treatment leads to a decrease in production of zwittermicin or edeines, respectively, with an accumulation of precursor metabolites in both cases. Selected mass features associated with each natural product are highlighted in orange. Significance calculated using one-sided Student’s t-test. b,d, Schemes for the reported and proposed prodrug activation steps in (b) zwittermicin and (d) edeine A1 biosynthesis, respectively, which are consistent with the observed metabolomic shifts. A complete list of the mass features identified in the experiment with B. cereus UW85 showing significant changes can be found in Supplementary Table 4, and those from B. formosus ATCC 51669 can be found in Supplementary Table 5.
Extended Data Fig. 1
Extended Data Fig. 1. Pinacol ester hydrolysis is not the rate-limiting step of ClbP inhibition.
Compounds 1-4 show typical ‘slow binding kinetics’ profiles, with potency increasing with longer incubation times and reaching a maximum at approximately 1 hour. When the inhibitors were presoaked in aqueous buffer, no change to this slow binding behavior is observed, indicating that this behavior is not a result of slow hydrolysis of the pinacol boronic ester, but of interaction with ClbP. Each condition was tested in n = 3 biological replicates. Symbols represent the mean of 3 replicates, error bars represent 1 standard deviation (s.d.). Source data
Extended Data Fig. 2
Extended Data Fig. 2. Chiral LC-MS for 3 and 5.
Curves shown are extracted ion chromatograms (EICs) for m/z 361.2308 (+/− 5 ppm) corresponding to the [M + H]+ ion of 3 and 5. The area under the curves (AUCs) for the peaks corresponding to each enantiomer indicate that each compound is a 95:5 molar ratio of major vs. minor enantiomer. Source data
Extended Data Fig. 3
Extended Data Fig. 3. Complete gel images for serine hydrolase ABPP.
For all lysates tested, no other clear targets among serine hydrolases could be identified as indicated by the uniform labeling by the fluorophosphonate probe of cellular hydrolases in presence or absence of the tested compounds. Experiments were conducted twice with similar results.
Extended Data Fig. 4
Extended Data Fig. 4. Complete gel images for BOCILLIN-FL ABPP.
Gel-based ABPP with the BOCILLIN-FL probe labels known PBPs in E. coli NC101 (top left), L. rhamnosus (top right), E. faecalis (bottom left), and K. oxytoca (bottom right) lysates, and inhibitor 3 at concentrations of 10 nM to 500 µM does not inhibit labeling of these proteins. Experiments were conducted twice with similar results.
Extended Data Fig. 5
Extended Data Fig. 5. Complete results for MIC determination assays with bacteria.
Raw OD600 measurements after 15 hours of anaerobic growth for strains tested in MIC assays with compounds 1-4 and chloramphenicol (CAM). Values shown are after subtraction of a media-only blank. Each combination of strain, compound, and concentration was tested in n = 3 biological replicates, with individual replicates shown. Bars show the mean for each condition, error bars are 1 s.d. A summary of these results is given in Supplementary Table 3. Source data
Extended Data Fig. 6
Extended Data Fig. 6. Complete results for MIC determination assays with human cell lines.
1-4 do not show cytotoxic activity toward mammalian cell lines up to 10 µM after 20 hours of exposure. No statistically significant difference was observed between any of the conditions tested (n = 3 biological replicates for each) and the DMSO control (n = 12) using an ordinary one-way ANOVA and Dunnett’s multiple comparison test (p > 0.05 in all comparisons to DMSO control). Source data
Extended Data Fig. 7
Extended Data Fig. 7. Gating strategy for flow cytometry experiments.
Images captured directly from FloJo 10.7.1. (a) After collecting at least 10,000 events for each sample, each sample was gated on a plot of FSC-A vs SSC-A to separate debris from cells (retaining 70–90% of events). (b) This cell population was then gated on SSC-W vs SSC-A to separate single cells (91–98%). (c) The single cell population was then gated on FSC-A vs propidium iodide fluorescence to remove unstained cells and other outliers (89–97%). (d) This final population was then plotted as a histogram and fit to the Watson Model. In some cases, noise in the data made automatic unconstrained fitting impossible, and the fitting process was aided by constraining the G1 peak center to the left (less fluorescent) half of the population and setting the condition that the G2 peak CV = G1 peak CV. In all cases, the same gate values were applied to every sample at each stage of gating.
Extended Data Fig. 8
Extended Data Fig. 8. Compounds 1–4 inhibit ZmaM cleavage of a fluorogenic probe in vitro.
Normalized activity in an in vitro fluorescence assay of purified ZmaM treated with 1-4 or vehicle. n = 3 biological replicates for each condition, symbols represent the mean, error bars are 1 s.d. Source data
Extended Data Fig. 9
Extended Data Fig. 9. MS/MS fragmentation and isotopic labeling of proposed prezwittermicin and preedeine A.
(a) Daughter ion spectrum of prezwittermicin metabolite 693.4142 m/z. (b) Zoom in on 280–340 m/z region of (a), with the daughter ion spectrum of 13C4-labeled prezwittermicin (697.4275 m/z) overlaid in orange. The proposed N-lauroyl-d-asparagine fragment shows the expected +4 m/z shift. (c) Fragmentation pattern of the key fragments highlighted in (a) and (b). (d) Daughter ion spectrum of preedeine metabolite 1155.5952 m/z. (e) Zoom in on 200–490 m/z region of (d), with the daughter ion spectrum of 13C4-labeled preedeine (1159.6011 m/z) overlaid in orange. Several daughter ions show the +4 m/z shift, which can be attributed to the fragmentation events summarized in (f). These data do not distinguish between the 1 and the 2 isomer. The 1 isomer is shown in part (f) for illustrative purposes only.

References

    1. Milshteyn A, Colosimo DA, Brady SF. Assessing bioactive natural products in the human microbiome. Cell Host Microbe. 2018;23:725–736. - PMC - PubMed
    1. Wong SH, Yu J. Gut microbiota in colorectal cancer: mechanisms of action and clinical applications. Nat. Rev. Gastroenterol. Hepatol. 2019;16:690–704. - PubMed
    1. Janney A, Powrie F, Mann EH. Host-microbiome maladaptation in colorectal cancer. Nature. 2020;585:509–517. - PubMed
    1. Nougayrede JP, et al. Escherichia coli induces DNA double-strand breaks in eukaryotic cells. Science. 2006;313:848–851. - PubMed
    1. Putze J, et al. Genetic structure and distribution of the colibactin genomic island among members of the family Enterobacteriaceae. Infect. Immun. 2009;77:4696–4703. - PMC - PubMed

Publication types

LinkOut - more resources