Clinical Trial
. 2022 Nov;28(11):2424-2435.
doi: 10.1038/s41591-022-02023-7. Epub 2022 Oct 17.

Early intervention with 3BNC117 and romidepsin at antiretroviral treatment initiation in people with HIV-1: a phase 1b/2a, randomized trial

Affiliations
Clinical Trial

Early intervention with 3BNC117 and romidepsin at antiretroviral treatment initiation in people with HIV-1: a phase 1b/2a, randomized trial

Jesper D Gunst et al. Nat Med. 2022 Nov.

Abstract

Attempts to reduce the human immunodeficiency virus type 1 (HIV-1) reservoir and induce antiretroviral therapy (ART)-free virologic control have largely been unsuccessful. In this phase 1b/2a, open-label, randomized controlled trial using a four-group factorial design, we investigated whether early intervention in newly diagnosed people with HIV-1 with a monoclonal anti-HIV-1 antibody with a CD4-binding site, 3BNC117, followed by a histone deacetylase inhibitor, romidepsin, shortly after ART initiation altered the course of HIV-1 infection ( NCT03041012 ). The trial was undertaken in five hospitals in Denmark and two hospitals in the United Kingdom. The coprimary endpoints were analysis of initial virus decay kinetics and changes in the frequency of CD4+ T cells containing intact HIV-1 provirus from baseline to day 365. Secondary endpoints included changes in the frequency of infected CD4+ T cells and virus-specific CD8+ T cell immunity from baseline to day 365, pre-ART plasma HIV-1 3BNC117 sensitivity, safety and tolerability, and time to loss of virologic control during a 12-week analytical ART interruption that started at day 400. In 55 newly diagnosed people (5 females and 50 males) with HIV-1 who received random allocation treatment, we found that early 3BNC117 treatment with or without romidepsin enhanced plasma HIV-1 RNA decay rates compared to ART only. Furthermore, 3BNC117 treatment accelerated clearance of infected cells compared to ART only. All groups had significant reductions in the frequency of CD4+ T cells containing intact HIV-1 provirus. At day 365, early 3BNC117 + romidepsin was associated with enhanced HIV-1 Gag-specific CD8+ T cell immunity compared to ART only. The observed virological and immunological effects of 3BNC117 were most pronounced in individuals whose pre-ART plasma HIV-1 envelope sequences were antibody sensitive. The results were not disaggregated by sex. Adverse events were mild to moderate and similar between the groups. During a 12-week analytical ART interruption among 20 participants, 3BNC117-treated individuals harboring sensitive viruses were significantly more likely to maintain ART-free virologic control than other participants. We conclude that 3BNC117 at ART initiation enhanced elimination of plasma viruses and infected cells, enhanced HIV-1-specific CD8+ immunity and was associated with sustained ART-free virologic control among persons with 3BNC117-sensitive virus. These findings strongly support interventions administered at the time of ART initiation as a strategy to limit long-term HIV-1 persistence.


Figures

Extended Data Fig. 1
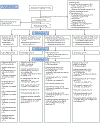
Extended Data Fig. 1. A comprehensive CONSORT Flow Diagram.
AE, adverse event; Ag, antigen; ART, antiretroviral therapy; COVID-19, coronavirus disease 2019; RMD, romidepsin; SAE, serious AE.
Extended Data Fig. 2
Extended Data Fig. 2. Distribution between self-report time of infection to study enrollment and outcome of the Asanté HIV-1 Rapid Recency Assay (n=54).
Extended Data Fig. 3
Extended Data Fig. 3. Transcriptionally (mRNA+) and transcriptionally + translationally (mRNA+p24+) active HIV-1-infected cells following ART initiation.
Changes in HIV-1-infected cells during the first 30 days of ART among the four groups shown as median (error bars represents interquartile ranges) number of CD3+CD8− T cells expressing either HIV-1 mRNA (a) or HIV-1 mRNA and Gag p24 protein (b). ART-control n=4, ART+3BNC117 n=5, ART+RMD n=4, ART+3BNC117+RMD n=5. ART, antiretroviral therapy; RMD, romidepsin.
Extended Data Fig. 4
Extended Data Fig. 4. Impact of 3BNC117 on translationally (p24+) active HIV-1-infected CD4+ T cell subsets.
Data are shown as in Fig. 3b-e, where the ART only and ART+RMD groups (who only received ART during the first 10 days) are combined into one group and compared to the two 3BNC117-treated groups. Median (error bars represent interquartile ranges) fold change in CD3+CD8− T cell subsets expressing Gag p24 among the combined ART (n=15) and ART+3BNC117 (n=18) groups. The CD3+CD8− T cells subsets are central memory T cells (TCM) (a), naïve T cells (TN) (b), effector memory T cells (TEM) (c), terminally differentiated T cells (TTD) (d), and T follicular helper cells (TFH) (e). P values comparing within group was calculated using paired two-tailed Wilcoxon test. ART, antiretroviral therapy; IQR, interquartile ranges; RMD, romidepsin.
Extended Data Fig. 5
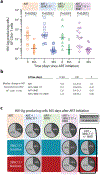
Extended Data Fig. 5. The frequency of HIV-1 antigen-producing cells.
The individual frequency of induced p24+ CD4+ T cells at ART initiation (day 0) and after 365 days of ART (lines at median) (a) and median changes in these cells between day 0 and 365 after ART initiation (b) among individuals in the four groups. P values comparing within group and between groups were calculated using paired two-tailed Wilcoxon test and two-tailed Mann-Whitney test, respectively. Pie charts showing the status of HIV-1 antigen-producing cells after 365 days of ART per group (column and upper row) and categorized according to pre-ART plasma virus sensitivity (middle row; blue shaded area) or resistance (bottom row; red shaded area) to 3BNC117 (c). A compiled group ART+3BNC117+/−RMD is shown is the last column. ART-control n=12, ART+3BNC117 n=14, ART+RMD n=10, ART+3BNC117+RMD n=13. Ag, antigen; ART, antiretroviral therapy; RMD, romidepsin.
Extended Data Fig. 6
Extended Data Fig. 6. Effect of RMD on transcriptionally (mRNA+) and transcriptionally + translationally (mRNA+p24+) active HIV-1-infected cells.
Data are shown as in Fig. 3f-g. Individual and overall median fold change (column) from pre- to post-RMD infusions in groups ART+RMD (n=8) and ART+3BNC117+RMD (n=10) on CD3+CD8− T cells expressing HIV-1 mRNA (a) or mRNA and Gag p24 (b). P values comparing within group was calculated using paired two-tailed Wilcoxon test. Due to a faulty mRNA probe in the 2nd batch of fluorescence in situ hybridization-flow cytometry analyses, mRNA data was only available for half of the study population. ART, antiretroviral therapy; RMD, romidepsin.
Extended Data Fig. 7
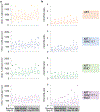
Extended Data Fig. 7. The frequency of defective HIV-1 proviruses.
The frequency of 3’ (a) and 5’ (b) defective HIV-1 proviruses at ART initiation and after 180 and 365 days of ART among individuals in the four groups (lines at median, error bars represent interquartile ranges) (c). P values comparing within group were calculated using paired two-tailed Wilcoxon test. ART only n=14, ART+3BNC117 n=14, ART+RMD n=10, ART+3BNC117+RMD n=14. ART, antiretroviral therapy; RMD, romidepsin.
Extended Data Fig. 8
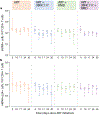
Extended Data Fig. 8. CD4+ T cell count and CD4/CD8 ratio during the study.
Tukey plots depicts the CD4+ T cell count (a) and CD4/CD8 ratio (b) in the four groups at baseline (day 0), the interventional period (day 10–30) and during follow-up (day 90–365). Lines indicates median, boxes represent interquartile ranges and whiskers drawn within the 1.5 IQR values. ART only n=15, ART+3BNC117 n=15, ART+RMD n=13, ART+3BNC117+RMD n=16. ART, antiretroviral therapy; IQR, interquartile range; RMD, romidepsin
Figure 1.
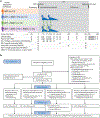
Figure 1.. The eCLEAR trial design (a) and abbreviated CONSORT Flow Diagram (b).
The Analysis section is presented in full in Extended Fig. 1. AIM, activation-induced marker; ART, antiretroviral therapy; ATI, analytical treatment interruption; COVID-19, coronavirus disease 2019; ddPCR, droplet digital polymerase chain reaction; FISH, fluorescence in situ hybridization; RMD, romidepsin; VIP-SPOT, viral protein spot.
Figure 2.
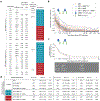
Figure 2.. 3BNC117-sensitivity at baseline and median decay of plasma HIV-1 RNA levels following ART initiation.
3BNC117-sensitivity at baseline for the ART+3BNC117 (n=15) and ART+3BNC117+RMD (n=16) groups (a). Individual (b) and group median (c) decay of plasma HIV-1 RNA levels following ART initiation. The arrows represent 3BNC117 and RMD infusion time points. The horizontal dotted line represents the limit of quantification (LOQ) at 20 copies/mL of the clinical HIV-1 viral load assay. The four vertical dotted lines at days 0, 10, 24 and 90 after ART initiation indicate the three plasma HIV-1 RNA decay phases (1st phase: 0-10 days; 2nd phase: 10-24 days; and 3rd phase: 24-90 days) (c). The percentage decline in median plasma HIV-1 RNA levels per day is presented during the three decay phases following ART initiation in the four randomization groups as well as in groups based on 3BNC117-sensitivity (d). P values calculated using mixed-effects linear regression models with a random effect for individual participants. We considered a two-sided α value of less than 0.05 significant with no adjustments made for multiple comparisons. ART, antiretroviral therapy; env, HIV-1 envelope gene; IC90, concentration of 3BNC117 required to inhibit viral replication by 90%; LOQ, limit of quantification; MPI, % inhibition observed at the highest concentration of 3BNC117 tested; RMD, romidepsin.
Figure 3.
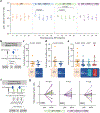
Figure 3.. Transcriptionally and/or translationally active HIV-1-infected cells following ART initiation.
Changes in HIV-1-infected cells during the first 30 days of ART among the four groups shown as median (error bars represent interquartile ranges) number of CD3+CD8− T cells expressing Gag p24 protein/106 CD4+ T cells (a, ART n=7, ART+3BNC117 n=9, ART+RMD n=9, ART+3BNC117+RMD n=10). Effect of 3BNC117 on transcriptionally and/or translationally HIV-1-infected cells from baseline to day 10 – the first decay phase defined in Figure 2c (b-e). The schematic illustration shows how data was combined from the ART only and ART+RMD groups (who only received ART during the first 10 days) compared to the two 3BNC117-treated groups (b). Median (IQR) fold change in CD3+CD8− T cells expressing either HIV-1 mRNA (c; ART n=8, ART+3BNC117 n=10), mRNA and p24 (d; ART n=8, ART+3BNC117 n=10), or p24 (e; ART n=15, ART+3BNC117 n=18) among the combined ART and ART+3BNC117 groups, and with the ART+3BNC117 group categorized according to 3BNC117-sensitivity (sensitive n=10 versus resistant n=8) (e). Due to a faulty mRNA probe in the 2nd batch of fluorescence in situ hybridization-flow cytometry analyses, mRNA data was only available for half of the study population (c-d). The schematic illustration shows how we analyzed the pre- to post-infusion effect of RMD on the translationally active HIV-1-infected cells (f). Individual and overall median fold change (gray column) from pre- to post-RMD infusions [overall median (IQR) for RMD1 1.78 (0.61-3.09), RMD2 1.00 (0.68-2.09), and RMD3 1.03 (0.56-1.70)] in groups ART+RMD (n=8) and ART+3BNC117+RMD (n=10) on CD3+CD8− T cells expressing p24 (g). P values comparing within group and between groups were calculated using paired two-tailed Wilcoxon test and two-tailed Mann-Whitney test, respectively. ART, antiretroviral therapy; IQR, interquartile ranges; RMD, romidepsin.
Figure 4.
Figure 4.. HIV-1 Gag-specific CD8+ T cell immunity and size of the intact HIV-1 reservoir.
Dot plot of the frequency of HIV-1 Gag-specific CD8+ T cells at ART initiation (day 0) and after 90 and 365 days of ART among the four groups (lines at median and interquartile ranges) (a). Dot plot of the net frequency of HIV-1 Gag-specific CD8+ T cells in groups ART+3BNC117+/−RMD categorized according to 3BNC117-sensitivity (lines at median and IQR) (b). The size of the intact HIV-1 reservoir at ART initiation (day 0) and after 180 and 365 days of ART among individuals in the four randomization groups (lines at median and IQR) (c). P values comparing within group and between groups were calculated using paired two-tailed Wilcoxon test and two-tailed Mann-Whitney test, respectively. Pie charts showing the mean percentage reduction of intact proviral DNA per 106 CD4+ T cells after 365 days of ART per group (column and upper row) and categorized according to pre-ART plasma virus sensitivity (middle row; blue shaded area) or resistance (bottom row; red shaded area) to 3BNC117 (d). P values comparing between groups were calculated using unpaired two-tailed t test with ART only as reference. A compiled group ART+3BNC117+/−RMD is shown is the last column. ART n=14, ART+3BNC117 n=14, ART+RMD n=10, ART+3BNC117+RMD n=14. ART, antiretroviral therapy; IQR, interquartile ranges; RMD, romidepsin; SD, standard deviation.
Figure 5.
Figure 5.. Time to loss of virologic control during 12 weeks of analytical treatment interruption.
Individual (n=20) plasma HIV-1 RNA levels are shown and coded by group (a). One individual (id. 125) resumed ART prior to fulfilling the restarting criteria due to national restrictions during the COVID-19 pandemic. Individual (n=11) plasma HIV-1 RNA levels for the ART+3BNC117 and ART+3BNC117+RMD groups based on 3BNC117-sensitivity (b). Kaplan-Meier curves showing percentage of individuals still interrupting ART from day 0 to day 84 during the ATI (c-d). Time to loss of virologic control for the ART+3BNC117 and ART+3BNC117+RMD groups based on 3BNC117-sensitivity (sensitive n=5 versus resistant n=6) (c) and for the 3BNC117-sensitive individuals (n=5) compared to the other ATI participants (n=15) (d) are shown. P values were calculated using log-rank test. ART, antiretroviral therapy; ATI, analytical treatment interruption; COVID-19, coronavirus disease 2019; LOQ, limit of quantification; RMD, romidepsin.

Similar articles

Cited by

References

    1. Abrahams MR et al. The replication-competent HIV-1 latent reservoir is primarily established near the time of therapy initiation. Sci. Transl. Med 11, (2019). - PMC - PubMed
    1. Brodin J et al. Establishment and stability of the latent HIV-1 DNA reservoir. Elife 5, 1–14 (2016). - PMC - PubMed
    1. Martin GE et al. Levels of Human Immunodeficiency Virus DNA Are Determined Before ART Initiation and Linked to CD8 T-Cell Activation and Memory Expansion. J. Infect. Dis 1–11 (2019). doi:10.1093/infdis/jiz563 - DOI - PMC - PubMed
    1. Jones BR et al. Phylogenetic approach to recover integration dates of latent HIV sequences within-host. Proc. Natl. Acad. Sci. U. S. A 115, E8958–E8967 (2018). - PMC - PubMed
    1. Brooks K et al. HIV-1 variants are archived throughout infection and persist in the reservoir. PLoS Pathog. 16, 1–22 (2020). - PMC - PubMed

References for Methods

    1. Estes JD et al. Defining total-body AIDS-virus burden with implications for curative strategies. Nat. Med (2017). doi:10.1038/nm.4411 - DOI - PMC - PubMed
    1. Gaebler C et al. Prolonged viral suppression with anti-HIV-1 antibody therapy. Nature (2022). doi:10.1038/s41586-022-04597-1 - DOI - PMC - PubMed
    1. Schulz KF, Altman DG & Moher D CONSORT 2010 Statement: Updated guidelines for reporting parallel group randomised trials. Trials (2010). doi:10.1186/1745-6215-11-32 - DOI - PMC - PubMed
    1. Harris P. a. et al. Research electronic data capture (REDCap)-A metadata-driven methodology and workflow process for providing translational research informatics support. J. Biomed. Inform 42, 377–381 (2009). - PMC - PubMed
    1. Harris PA et al. The REDCap consortium: Building an international community of software platform partners. Journal of Biomedical Informatics (2019). doi:10.1016/j.jbi.2019.103208 - DOI - PMC - PubMed

Publication types

Associated data