. 2022 Oct 17;21(1):200.
doi: 10.1186/s12943-022-01666-x.

The single cell transcriptional landscape of esophageal adenocarcinoma and its modulation by neoadjuvant chemotherapy

Affiliations

The single cell transcriptional landscape of esophageal adenocarcinoma and its modulation by neoadjuvant chemotherapy

Wayne Croft et al. Mol Cancer. .

Abstract

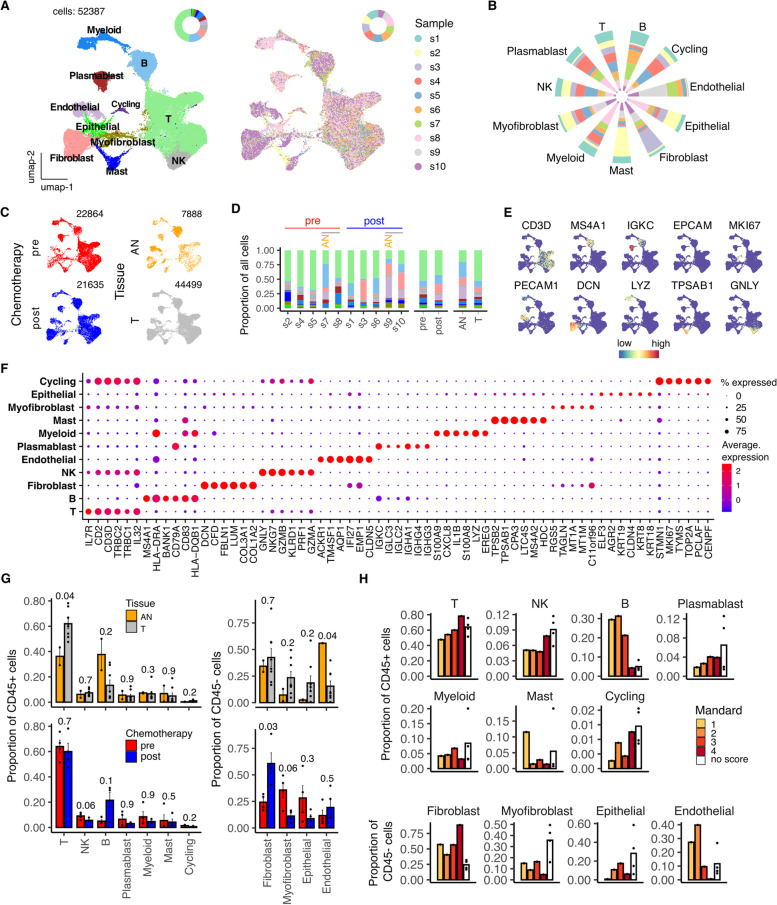
Immune checkpoint blockade has recently proven effective in subsets of patients with esophageal adenocarcinoma (EAC) but little is known regarding the EAC immune microenvironment. We determined the single cell transcriptional profile of EAC in 8 patients who were treatment-naive (n = 4) or had received neoadjuvant chemotherapy (n = 4). Analysis of 52,387 cells revealed 10 major cell subsets of tumor, immune and stromal cells. Prior to chemotherapy tumors were heavy infiltrated by T regulatory cells and exhausted effector T cells whilst plasmacytoid dendritic cells were markedly expanded. Two dominant cancer-associated fibroblast populations were also observed whilst endothelial populations were suppressed. Pathological remission following chemotherapy associated with broad reversal of immune abnormalities together with fibroblast transition and an increase in endothelial cells whilst a chemoresistant epithelial stem cell population correlated with poor response. These findings reveal features that underlie and limit the response to current immunotherapy and identify a range of novel opportunities for targeted therapy.

Keywords: Cancer-associated fibroblast; Esophageal adenocarcinoma; Plasmacytoid dendritic cell; Regulatory T cell; scRNA-Seq.


Conflict of interest statement

The authors declare no competing interests.

Figures

Fig. 1
Fig. 1
High level cell type ATLAS of Esophageal Adenocarcinoma. A UMAP embedding overlaid with unsupervised cluster cell type annotations (left) and sample label (right). B Proportional sample contributions to each cell type cluster. C UMAP embeddings split by treatment and tissue type. D Breakdown of cluster proportions by sample, chemotherapy treatment and tissue type. Grey line indicates matched tumor and Adjacent Normal (AN) samples. E UMAP embeddings overlaid with expression of canonical high level cell type marker genes. F Average expression profile of top cluster marker genes. Dot size indicates the percentage of the cluster showing expression G Comparison by Mann-Whitney test of Adjacent Normal (AN) vs Tumor (T) and pre vs post chemotherapy cluster proportions. H Cluster proportions by Mandard scores. Points represent within-sample cluster proportion of total cells and p values determined by Mann-Whitney test
Fig. 2
Fig. 2
Modulation of T cell contexture, functional signatures and key cell subtype ratios within the tumor microenvironment of Esophageal Adenocarcinoma following NACT. A UMAP embedding overlaid with cluster cell type annotations and UMAP embeddings split by treatment and tissue type. B Average expression profile of top cluster marker genes. C UMAP embeddings overlaid with selected canonical T cell type marker genes. D Scaled enrichment score calculated by GSVA for selected MSigDB Hallmark gene sets. E UMAP embeddings overlaid with selected signature module scores and distributions of module scores stratified by chemotherapy treatment. F Breakdown of cluster proportions by sample, chemotherapy treatment and tissue type. G Comparison of Adjacent Normal (AN) vs Tumor (T), pre vs post chemotherapy and Mandard score cluster proportions. Points represent within-sample cluster proportion of total T cells. H CD4:CD8, CD4:Treg and CD8:Treg ratios stratified by tissue type and chemotherapy. P values determined by Mann-Whitney test
Fig. 3
Fig. 3
NACT modulation of Myeloid cell contexture identifies shift in cDC:pDC ratio within the tumor microenvironment of Esophageal Adenocarcinoma. A UMAP embedding overlaid with cluster cell type annotations and UMAP embeddings split by treatment and tissue type. B UMAP embeddings overlaid with expression of canonical Myeloid cell type marker genes. C Average expression profile of top cluster marker genes. D Breakdown of cluster proportions by sample, chemotherapy treatment and tissue type. E Comparison by Mann-Whitney test of Adjacent Normal (AN) vs Tumor (T), pre vs post chemotherapy and Mandard score cluster proportions. Points represent within sample cluster proportion of total sample Myeloid cells. F cDC:pDC ratios stratified by tissue type and chemotherapy. P values determined by Mann-Whitney test
Fig. 4
Fig. 4
NACT modulation of B cell contexture within the tumor microenvironment of Esophageal Adenocarcinoma. A UMAP embedding overlaid with cluster cell type annotations and UMAP embeddings split by treatment and tissue type. B UMAP embeddings overlaid with expression of canonical B cell type marker genes. C Average expression profile of top cluster marker genes. D Breakdown of cluster proportions by sample, chemotherapy treatment and tissue type. E Comparison of Adjacent Normal (AN) vs Tumor (T), pre vs post chemotherapy and Mandard score cluster proportions. Points represent within sample cluster proportion of total sample B cells and p values determined by Mann-Whitney test
Fig. 5
Fig. 5
Fibroblast contexture within the tumor microenvironment of Esophageal Adenocarcinoma and gene expression profile changes following NACT. A UMAP embedding overlaid with cluster cell type annotations, UMAP embeddings split by treatment and tissue type and Automated per-cell annotations of cell type using SingleR with the hpca coarse reference dataset. B UMAP embeddings overlaid with selected canonical Fibroblast sub-type marker genes. C Average expression profile of top cluster marker genes. Dot size indicates the percentage of the cluster showing expression. D Breakdown of cluster proportions by sample, chemotherapy treatment and tissue type. E Comparison of Adjacent Normal (AN) vs Tumor (T), pre vs post chemotherapy and Mandard score cluster proportions. Points represent within sample cluster proportion of total sample Fibroblast cells and p values determined by Mann-Whitney test. F Summary of genes identified as differentially expressed in post vs pre NACT EAC tumor sample data. DEG count noted alongside cluster: (pre expresn=2654sed, post expressed). G Summary of genes identified as differentially expressed in EAC Tumor (T) vs Adjacent Normal (AN) sample data. DEG count noted alongside cluster: (AN expressed, T expressed). Coloured points indicate DEGs (BH adjusted p < 0.001 and absolute average log2FC > 0.5)
Fig. 6
Fig. 6
Characterizing Epithelial/Tumor cell subsets within the tumor microenvironment of Esophageal Adenocarcinoma. A UMAP embedding overlaid with cluster cell type annotations and UMAP embeddings split by treatment and tissue type. B UMAP embeddings overlaid with expression of canonical Epithelial cell type markers. C Average expression profile of top cluster marker genes. D Breakdown of cluster proportions by sample, chemotherapy treatment and tissue type. E Comparison of Adjacent Normal (AN) vs Tumor (T), pre vs post chemotherapy and Mandard score cluster proportions. Points represent within-sample cluster proportion of total sample epithelial cells and p values determined by Mann-Whitney test
Fig. 7
Fig. 7
Characterizing Endothelial cells within the tumor microenvironment of Esophageal Adenocarcinoma. A UMAP embedding overlaid with cluster cell type annotations and UMAP embeddings split by treatment and tissue type. B UMAP embeddings overlaid with expression of canonical Endothelial cell type markers. C Per-cell expression profile of top cluster marker genes. D Breakdown of cluster proportions by sample, chemotherapy treatment and tissue type. E Comparison of Adjacent Normal (AN) vs Tumor (T), pre vs post chemotherapy and Mandard score cluster proportions. Points represent within sample cluster proportion and p values determined by Mann-Whitney test
Fig. 8
Fig. 8
Schematic representation of major findings

References

    1. Ferlay J, Shin H-R, Bray F, Forman D, Mathers C, Parkin DM. Estimates of worldwide burden of cancer in 2008: GLOBOCAN 2008. Int J Cancer. 2010;127:2893–2917. doi: 10.1002/ijc.25516. - DOI - PubMed
    1. Sung H, Ferlay J, Siegel RL, Laversanne M, Soerjomataram I, Jemal A, et al. Global cancer statistics 2020: GLOBOCAN estimates of incidence and mortality worldwide for 36 cancers in 185 countries. CA Cancer J Clin. 2021;71:209–249. doi: 10.3322/caac.21660. - DOI - PubMed
    1. Yamamoto S, Kato K. JUPITER-06 establishes immune checkpoint inhibitors as essential first-line drugs for the treatment of advanced esophageal squamous cell carcinoma. Cancer Cell. 2022;40:238–240. doi: 10.1016/j.ccell.2022.02.009. - DOI - PubMed
    1. Nowicki-Osuch K, Zhuang L, Jammula S, Bleaney CW, Mahbubani KT, Devonshire G, et al. Molecular phenotyping reveals the identity of Barrett’s esophagus and its malignant transition. Science. 2021;373:760–767. doi: 10.1126/science.abd1449. - DOI - PubMed
    1. Al-Batran S-E, Homann N, Pauligk C, Goetze TO, Meiler J, Kasper S, et al. Perioperative chemotherapy with fluorouracil plus leucovorin, oxaliplatin, and docetaxel versus fluorouracil or capecitabine plus cisplatin and epirubicin for locally advanced, resectable gastric or gastro-oesophageal junction adenocarcinoma (FLOT4): a randomised, phase 2/3 trial. Lancet. 2019;393:1948–1957. doi: 10.1016/S0140-6736(18)32557-1. - DOI - PubMed

Publication types

MeSH terms

Substances

Supplementary concepts