. 2023 Feb;89(2):665-677.
doi: 10.1002/mrm.29481. Epub 2022 Oct 17.

Mapping the myelin bilayer with short-T2 MRI: Methods validation and reference data for healthy human brain

Affiliations

Mapping the myelin bilayer with short-T2 MRI: Methods validation and reference data for healthy human brain

Emily Louise Baadsvik et al. Magn Reson Med. 2023 Feb.

Abstract

Purpose: To explore the properties of short-T2 signals in human brain, investigate the impact of various experimental procedures on these properties and evaluate the performance of three-component analysis.

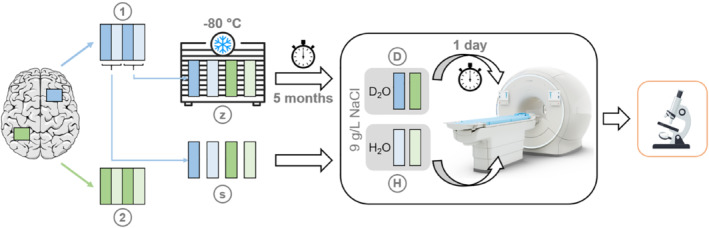
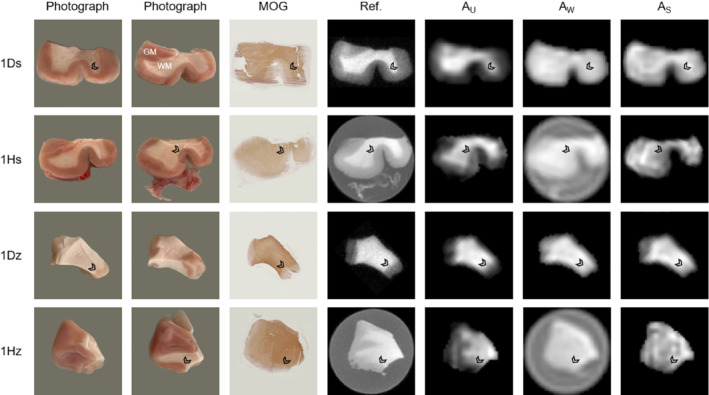
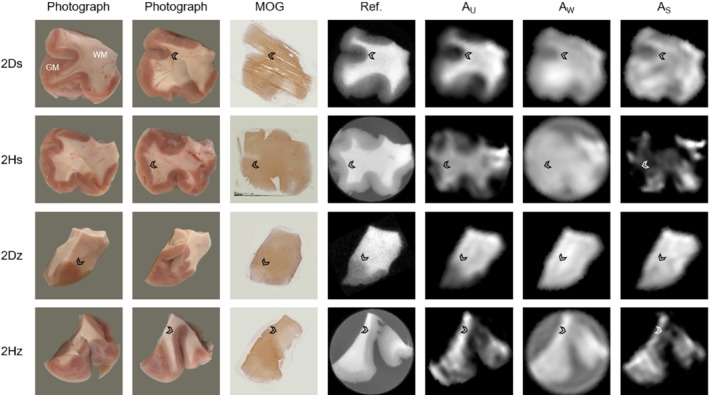
Methods: Eight samples of non-pathological human brain tissue were subjected to different combinations of experimental procedures including D2 O exchange and frozen storage. Short-T2 imaging techniques were employed to acquire multi-TE (33-2067 μs) data, to which a three-component complex model was fitted in two steps to recover the properties of the underlying signal components and produce amplitude maps of each component. For validation of the component amplitude maps, the samples underwent immunohistochemical myelin staining.

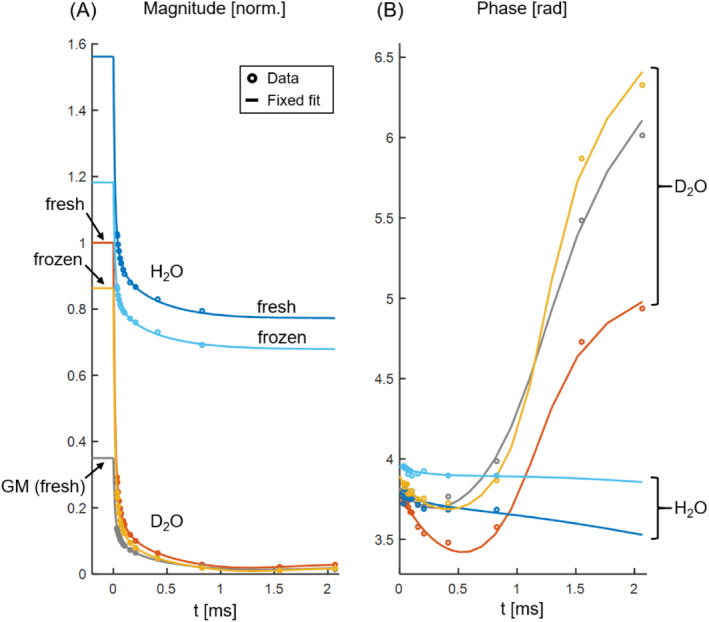
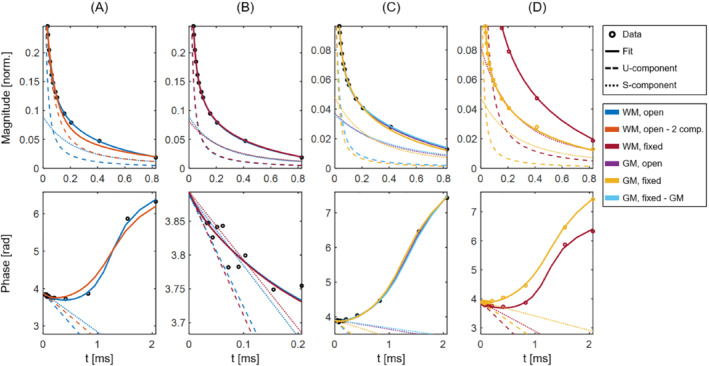
Results: The signal component representing the myelin bilayer exhibited super-exponential decay with T2,min of 5.48 μs and a chemical shift of 1.07 ppm, and its amplitude could be successfully mapped in both white and gray matter in all samples. These myelin maps corresponded well to myelin-stained tissue sections. Gray matter signals exhibited somewhat different components than white matter signals, but both tissue types were well represented by the signal model. Frozen tissue storage did not alter the signal components but influenced component amplitudes. D2 O exchange was necessary to characterize the non-aqueous signal components, but component amplitude mapping could be reliably performed also in the presence of H2 O signals.

Conclusions: The myelin mapping approach explored here produced reasonable and stable results for all samples. The extensive tissue and methodological investigations performed in this work form a basis for signal interpretation in future studies both ex vivo and in vivo.

Keywords: high-performance gradient; super-Lorentzian lineshape; tissue characterization; tissue preparation; ultrashort TE; white and gray matter.


Conflict of interest statement

Klaas Paul Pruessmann holds a research agreement with and receives research support from Philips and is a shareholder of Gyrotools LLC.

Figures

FIGURE 1
FIGURE 1
Schematic showing the processing steps for each sample. Tissue blocks from two regions (“1” and “2”) on the cerebrum were divided into four samples each, half of which were imaged directly and half of which were stored at −80°C for five months prior to imaging. Of the four samples that were arranged either fresh (“s”) or frozen–thawed (“z”), one from each tissue block underwent a 24‐h, two‐step D2O exchange (“D”) while the other was placed in H2O (“H”). After imaging, the samples were processed for myelin immunohistochemistry. Note that the placement of the tissue blocks on the cerebrum are for demonstration purposes only and are not meant to indicate the anatomical locations of the dissected tissue
FIGURE 2
FIGURE 2
Magnitude (A) and phase (B) of the SPI data and associated fixed fits for the samples from tissue block 1. Data points represent an average over large WM regions unless specified as GM data. The magnitudes are normalized by the fit magnitude at time zero in WM for the fresh D2O sample. H2O and D2O samples are clearly distinguishable in both plots. In the absence of a dominant water pool, the phase curves exhibit a characteristic shape; in contrast, the phase of the H2O data is approximately linear and, because the local resonance offset has been corrected for, relatively flat. Frozen samples have reduced magnitude with respect to their fresh counterparts but otherwise exhibit similar signal behavior. The GM region has significantly lower magnitude than the WM region from the same sample, but the general signal behavior of the two tissue types is comparable
FIGURE 3
FIGURE 3
Comparison plots of magnitude (top row, same normalization as applied in Figure 2) and phase (bottom row) for different fits to averaged WM and GM signals in a representative sample (the frozen D2O sample from tissue block 1). Note the different axes used for the different plots. The underlying data points are shown as black circles in cases in which all fits are based on the same data, and as colored circles in cases in which the fits are based on different data. The W‐component is not shown for simplicity, but would manifest as a near‐horizontal line. A, Open fits in WM using both three‐component (blue) and two‐component (orange) signal models. B, Open (blue) and fixed (maroon) fits in WM. C, Open (purple) and fixed (yellow) fits in GM, as well as an additional fixed fit (light blue) based on the average signal components found in GM (see Table 2). D, Fixed fits in WM (maroon) and GM (yellow), highlighting the differences in signal behavior
FIGURE 4
FIGURE 4
Comparison of (from left to right) photographs from both sides of the sample, tissue sections stained by myelin oligodendrocyte glycoprotein (MOG) immunohistochemistry, high‐resolution ultrashort‐T2 reference images, and fitted component amplitude maps for each sample from tissue block 1 (ordered according to Figure 1). Overall, good correspondence in terms of sample geometry and WM/GM boundaries (see arrowheads at comparable locations) is achieved for all image types. The component amplitude maps show the highest quality for D2O samples, although the map quality for H2O samples is also considered acceptable
FIGURE 5
FIGURE 5
Identical results as presented in Figure 4 but for the samples in tissue block 2. Good correspondence between image types is seen also for these samples, and the component amplitude maps are of the same quality as those presented for the samples from tissue block 1 (see Figure 4). These results further verify the performance of the component amplitude mapping procedure, particularly considering the brain‐region dependence of the signal components seen in Table 2

References

    1. Norton WT, Cammer W. Isolation and characterization of myelin. In: Morell P, ed. Myelin. 2nd ed. Springer; 1984:147‐195.
    1. Rasband MN, Macklin WB. Myelin structure and biochemistry. In: Brady ST, Siegel GJ, Albers RW, Price DL, eds. Basic Neurochemistry. 8th ed. Elsevier; 2012:180‐199.
    1. Popescu BFG, Lucchinetti CF. Pathology of demyelinating diseases. Annu Rev Pathol. 2012;7:185‐217. - PubMed
    1. Love S. Demyelinating diseases. J Clin Pathol. 2006;59:1151‐1159. - PMC - PubMed
    1. Laule C, Vavasour IM, Kolind SH, et al. Magnetic resonance imaging of myelin. Neurotherapeutics. 2007;4:460‐484. - PMC - PubMed

MeSH terms