Expression pattern of resynthesized allotetraploid Capsella is determined by hybridization, not whole-genome duplication
- PMID: 36254103
- PMCID: PMC10099941
- DOI: 10.1111/nph.18542
Expression pattern of resynthesized allotetraploid Capsella is determined by hybridization, not whole-genome duplication
Abstract
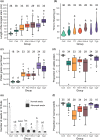
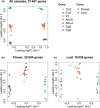
Polyploidization, the process leading to the increase in chromosome sets, is a major evolutionary transition in plants. Whole-genome duplication (WGD) within the same species gives rise to autopolyploids, whereas allopolyploids result from a compound process with two distinct components: WGD and interspecific hybridization. To dissect the instant effects of WGD and hybridization on gene expression and phenotype, we created a series of synthetic hybrid and polyploid Capsella plants, including diploid hybrids, autotetraploids of both parental species, and two kinds of resynthesized allotetraploids with different orders of WGD and hybridization. Hybridization played a major role in shaping the relative expression pattern of the neo-allopolyploids, whereas WGD had almost no immediate effect on relative gene expression pattern but, nonetheless, still affected phenotypes. No transposable element-mediated genomic shock scenario was observed in either neo-hybrids or neo-polyploids. Finally, WGD and hybridization interacted and the distorting effects of WGD were less strong in hybrids. Whole-genome duplication may even improve hybrid fertility. In summary, while the initial relative gene expression pattern in neo-allotetraploids was almost entirely determined by hybridization, WGD only had trivial effects on relative expression patterns, both processes interacted and had a strong impact on physical attributes and meiotic behaviors.
Keywords: Capsella bursa-pastoris; gene expression; hybridization; neopolyploid lines; polyploidy.
© 2022 The Authors. New Phytologist © 2022 New Phytologist Foundation.
Figures


Similar articles
-
Separating phases of allopolyploid evolution with resynthesized and natural Capsella bursa-pastoris.Elife. 2024 Jan 8;12:RP88398. doi: 10.7554/eLife.88398. Elife. 2024. PMID: 38189348 Free PMC article.
-
Hybrid origins and the earliest stages of diploidization in the highly successful recent polyploid Capsella bursa-pastoris.Proc Natl Acad Sci U S A. 2015 Mar 3;112(9):2806-11. doi: 10.1073/pnas.1412277112. Epub 2015 Feb 17. Proc Natl Acad Sci U S A. 2015. PMID: 25691747 Free PMC article.
-
Transposable element evolution in the allotetraploid Capsella bursa-pastoris.Am J Bot. 2016 Jul;103(7):1197-202. doi: 10.3732/ajb.1600103. Epub 2016 Jul 20. Am J Bot. 2016. PMID: 27440791
-
Polyploidy and interspecific hybridization: partners for adaptation, speciation and evolution in plants.Ann Bot. 2017 Aug 1;120(2):183-194. doi: 10.1093/aob/mcx079. Ann Bot. 2017. PMID: 28854567 Free PMC article. Review.
-
Polyploidy and genome evolution in plants.Curr Opin Genet Dev. 2015 Dec;35:119-25. doi: 10.1016/j.gde.2015.11.003. Epub 2015 Dec 2. Curr Opin Genet Dev. 2015. PMID: 26656231 Review.
Cited by
-
The Genomic Shock Hypothesis: Genetic and Epigenetic Alterations of Transposable Elements after Interspecific Hybridization in Plants.Epigenomes. 2023 Dec 27;8(1):2. doi: 10.3390/epigenomes8010002. Epigenomes. 2023. PMID: 38247729 Free PMC article. Review.
-
Subgenome evolutionary dynamics in allotetraploid ferns: insights from the gene expression patterns in the allotetraploid species Phegopteris decursivepinnata (Thelypteridacea, Polypodiales).Front Plant Sci. 2024 Jan 9;14:1286320. doi: 10.3389/fpls.2023.1286320. eCollection 2023. Front Plant Sci. 2024. PMID: 38264021 Free PMC article.
-
Separating phases of allopolyploid evolution with resynthesized and natural Capsella bursa-pastoris.Elife. 2024 Jan 8;12:RP88398. doi: 10.7554/eLife.88398. Elife. 2024. PMID: 38189348 Free PMC article.
-
Dominance between self-incompatibility alleles determines the mating system of Capsella allopolyploids.Evol Lett. 2024 Mar 17;8(4):550-560. doi: 10.1093/evlett/qrae011. eCollection 2024 Aug. Evol Lett. 2024. PMID: 39100231 Free PMC article.
References
-
- Ågren JA, Huang HR, Wright SI. 2016. Transposable element evolution in the allotetraploid Capsella bursa‐pastoris . American Journal of Botany 103: 1197–1202. - PubMed
-
- Allario T, Brumos J, Colmenero‐Flores JM, Tadeo F, Froelicher Y, Talon M, Navarro L, Ollitrault P, Morillon R. 2011. Large changes in anatomy and physiology between diploid Rangpur lime (Citrus limonia) and its autotetraploid are not associated with large changes in leaf gene expression. Journal of Experimental Botany 62: 2507–2519. - PubMed
-
- Andrews S. 2010. FastQC: a quality control tool for high throughput sequence data . [WWW document] URL http://www.bioinformatics.babraham.ac.uk/projects/fastqc [accessed 8 March 2022].
-
- Anneberg TJ, Segraves KA. 2020. Nutrient enrichment and neopolyploidy interact to increase lifetime fitness of Arabidopsis thaliana . Plant and Soil 456: 439–453.
Publication types
MeSH terms
LinkOut - more resources
Full Text Sources

