. 2022 Nov 18;25(11):105316.
doi: 10.1016/j.isci.2022.105316. Epub 2022 Oct 10.

Identification and differential usage of a host metalloproteinase entry pathway by SARS-CoV-2 Delta and Omicron

Affiliations

Identification and differential usage of a host metalloproteinase entry pathway by SARS-CoV-2 Delta and Omicron

Mehdi Benlarbi et al. iScience. .

Abstract

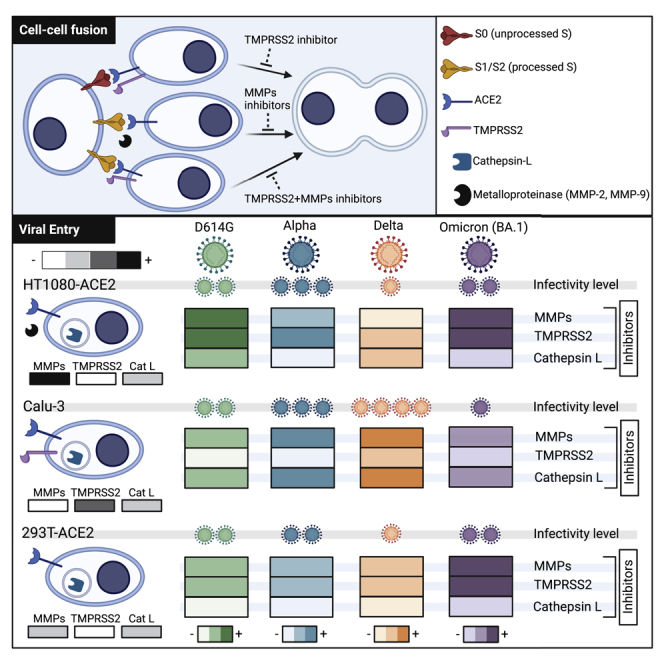
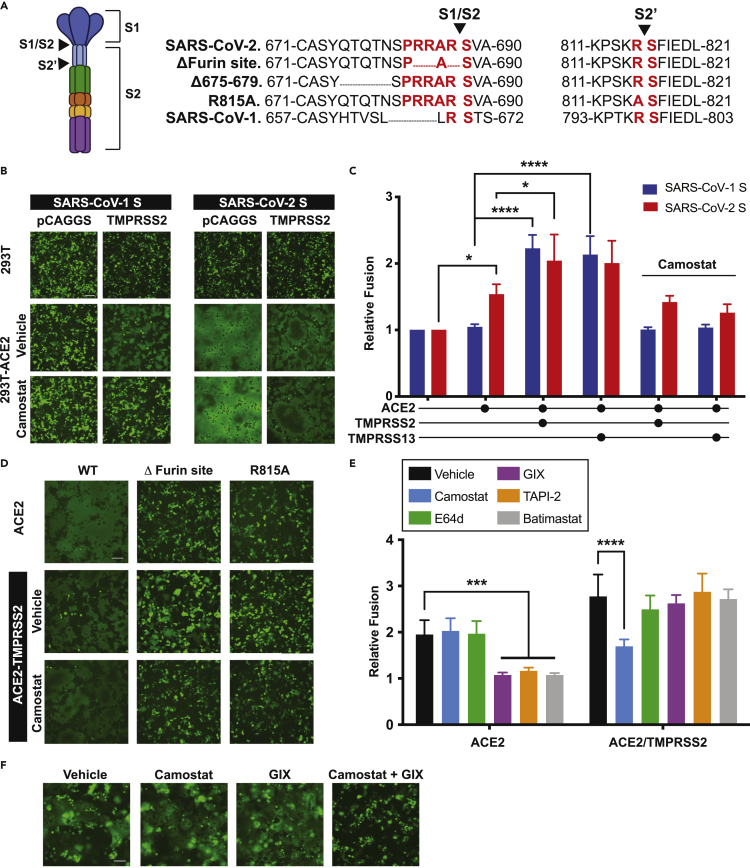
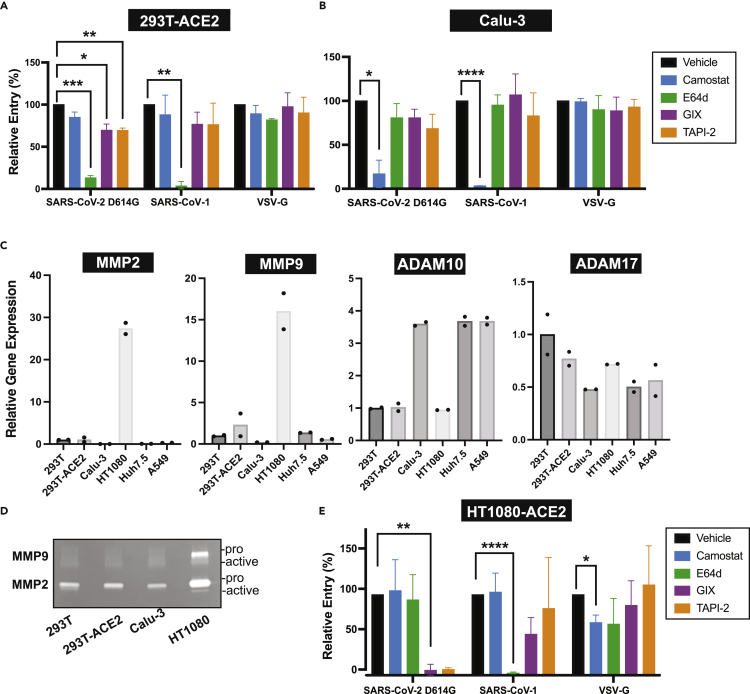
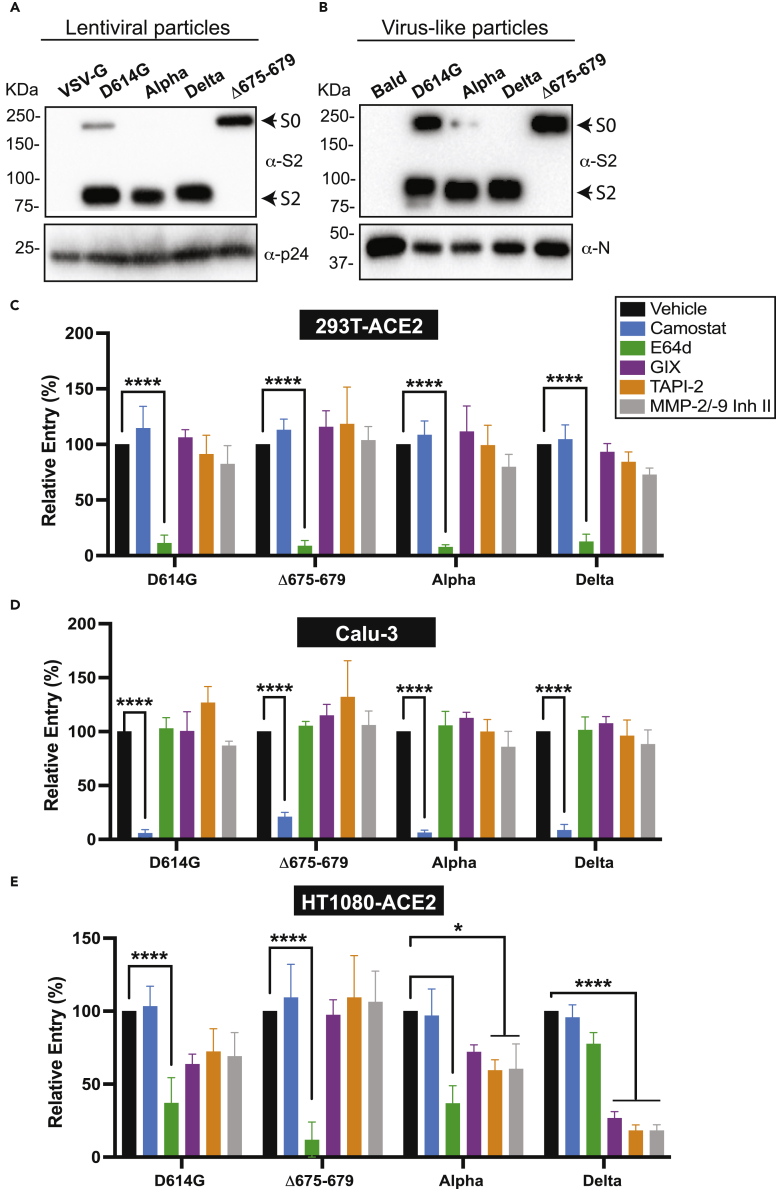
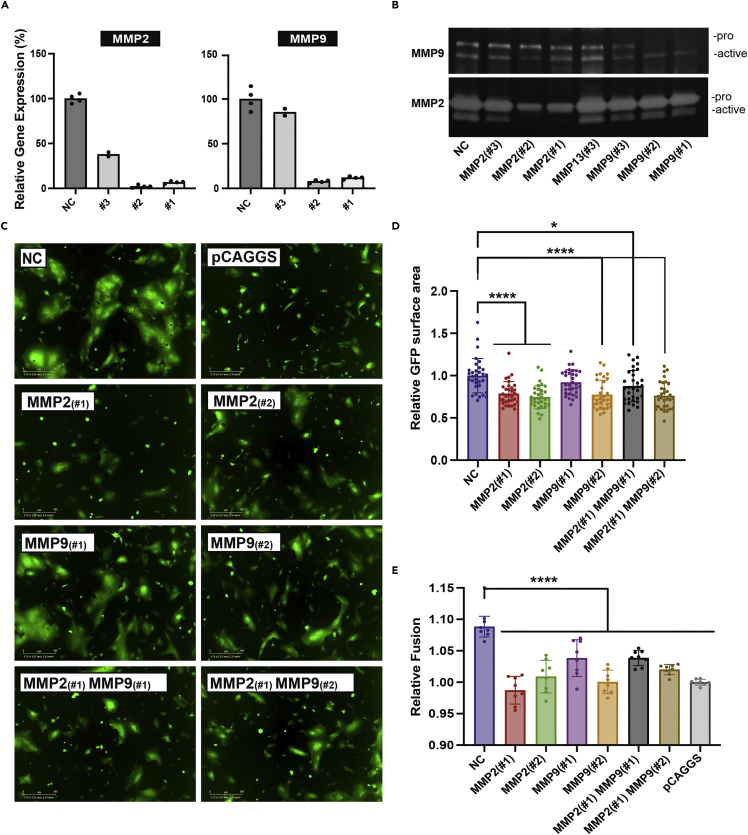
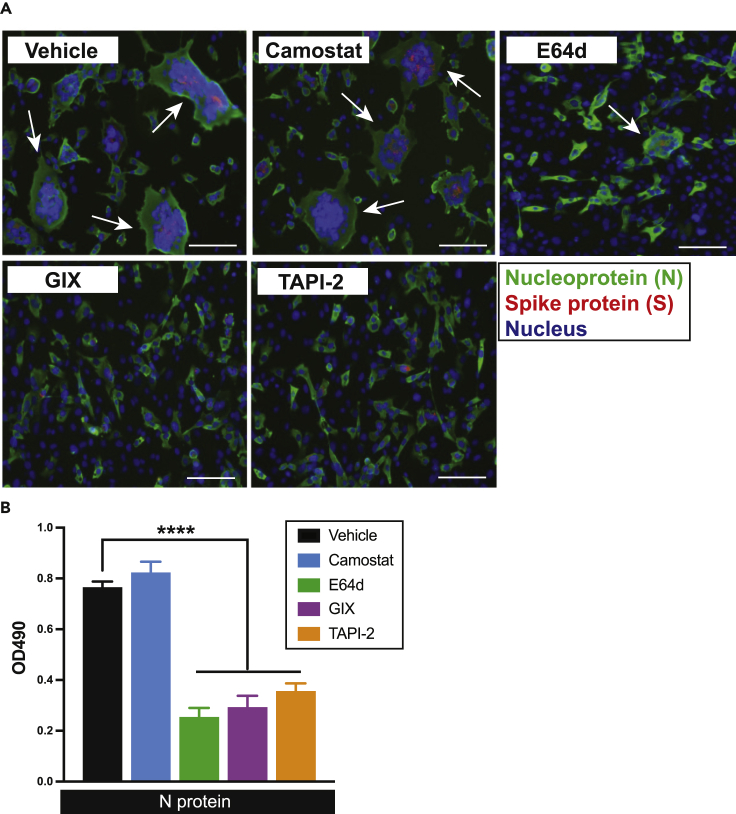
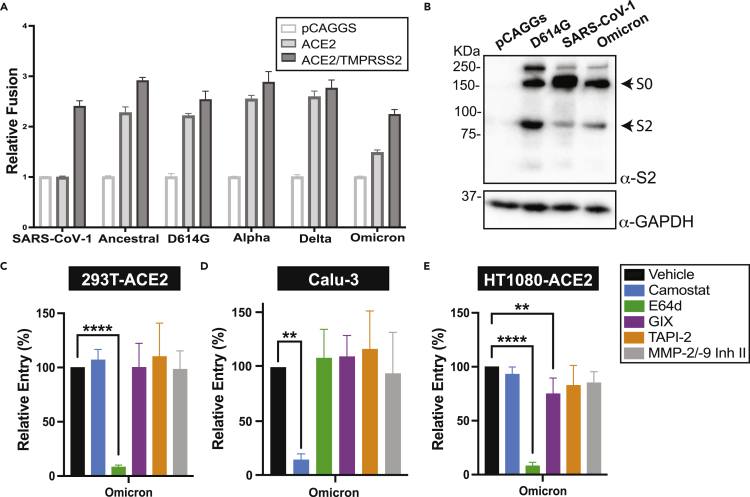
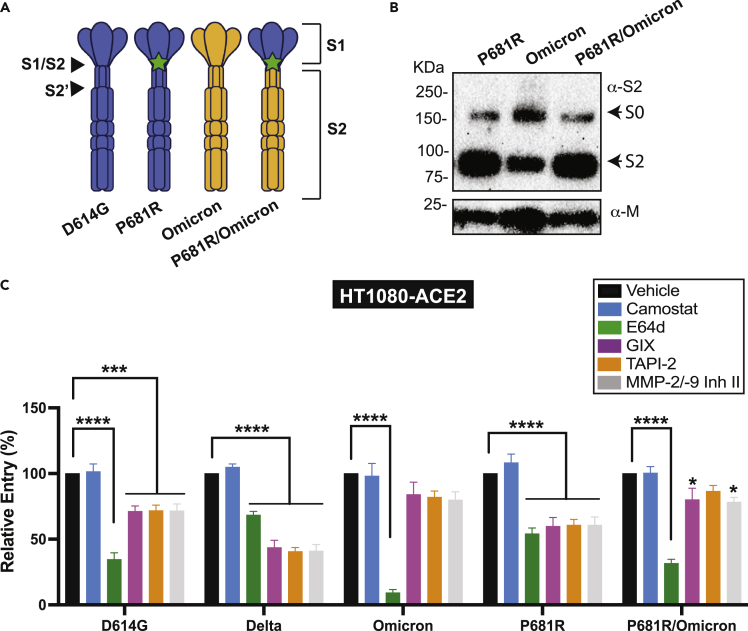
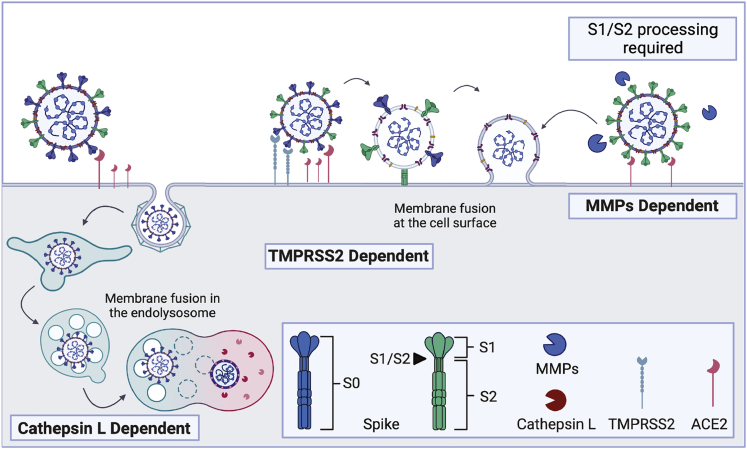
The severe acute respiratory syndrome coronavirus-2 (SARS-CoV-2) spike glycoprotein (S) binds to angiotensin-converting enzyme 2 (ACE2) to mediate membrane fusion via two distinct pathways: 1) a surface, serine protease-dependent or 2) an endosomal, cysteine protease-dependent pathway. In this study, we found that SARS-CoV-2 S has a wider protease usage and can also be activated by TMPRSS13 and matrix metalloproteinases (MMPs). We found that MMP-2 and MMP-9 played roles in SARS-CoV-2 S cell-cell fusion and TMPRSS2- and cathepsin-independent viral entry in cells expressing high MMP levels. MMP-dependent viral entry required cleavage at the S1/S2 junction in viral producer cells, and differential processing of variants of concern S dictated its usage; the efficiently processed Delta S preferred metalloproteinase-dependent entry when available, and less processed Omicron S was unable to us metalloproteinases for entry. As MMP-2/9 are released during inflammation, they may play roles in S-mediated cytopathic effects, tropism, and disease outcome.

Keywords: Biological sciences; microbiology; molecular biology; virology.


Conflict of interest statement

The authors declare that they have no conflict of interest.

Figures

None
Graphical abstract
Figure 1
Figure 1
SARS-CoV-2 S can mediate cell-cell fusion in a metalloproteinase-dependent manner (A) Schematics of the S glycoprotein and amino acid sequences at the S1/S2 and S2′ cleavage sites of mutants used in this study. In green: fusion peptide, in orange and yellow: N- and O- heptad repeats respectively, in purple: transmembrane domain, in red: amino acids surrounding the cleavage sites. Arrow heads depict the cleavage site. (B and D) (Created with BioRender) (B, D) 293T or 293T stably expressing ACE2 (293T-ACE2) were co-transfected with plasmids encoding GFP, SARS-CoV-1 or SARS-CoV-2 S WT or indicated mutants, and TMPRSS2, or with an empty vector, in the presence or absence of Camostat (25 μM). Syncytia formation was visualized 24 h post-transfection using fluorescence microscopy. (C and E) Effector 293T cells transfected with plasmids encoding SARS-CoV-1 or SARS-CoV-2 S and ZipVenus1, were co-cultured with target 293T cells transfected with plasmid encoding ZipVenus 2, ACE2 and TMPRSS2, TMPRRS13 or empty vector, in the presence or absence of indicated protease inhibitors (Camostat 25 μM, E64days 10 μM, GIX 25402X3 (GIX) 10 μM, TAPI-2 40 μM, Batimastat 10 μM). Fluorescence generated by the reconstitution of ZIPVenus upon cell-cell fusion was measured after 4 h of co-culture. (F) 293T cells transfected with plasmids encoding GFP and SARS-CoV-2 S were co-cultured (1:1 ratio) with Calu-3 cells in the presence of the indicated inhibitors (Camostat 25 μM, GIX 10 μM). Syncytia were visualized 24 h post-transfection using fluorescence microscopy. Pictures are representative images of at least 3 independent experiments (n ≤ 3). Each bar graph shows the mean of triplicate values of 3 independent experiments with error bars showing SD. Significance was determined by ANOVA (one-way ANOVA) followed by a Dunnett’s multiple comparisons test. p-value lower than 0.05 was used to indicate a statistically significant difference (∗∗∗∗, p < 0.0001, ∗∗∗, p < 0.001, ∗∗, p < 0.01, ∗, p < 0.05). The scale bar represents 300 μm. See also Figure S1.
Figure 2
Figure 2
SARS-CoV-2 S can mediate viral entry using a metalloproteinase-dependent entry route in cells expressing high levels of MMP-2 and MMP-9 (A, B, and E) 293T-ACE2, Calu-3, and HT1080 transfected with ACE2, were pre-treated for 1 h with 25 μM Camostat, 10 μM E64days, 40 μM TAPI-2, 10 μM GIX or Vehicle (DMSO) followed by the addition of lentiviral pseudoviruses encoding LacZ and bearing the SARS-CoV-2 D614G S, SARS-CoV-1 S, or VSV-G. After 48 h, cells were fixed and stained with X-gal overnight at 37°C and foci representing infected cells were counted. Relative infection was calculated as the number of foci in the indicated inhibitor treatment relative to vehicle treatment. Each bar graph shows the mean of triplicate values of 3 independent experiments with error bars showing SD. The impact of inhibitors on infection compared to vehicle was analyzed using a two-way ANOVA and Dunnett’s post-hoc analysis. P-value lower than 0.05 was used to indicate a statistically significant difference (∗∗∗∗, p < 0.0001, ∗∗∗, p < 0.001, ∗∗, p < 0.01, ∗, p < 0.05). (C) Relative mRNA levels of MMP-2, MMP-9, ADAM10, and ADAM17 in various cell lines were measured by RT-qPCR. The level of actin mRNA expression in each sample was used to standardize the data, and normalization on 293T gene expression was performed. (293T, 293T-ACE2, Calu-3, HT1080: n ≥ 3). (D) Gelatin zymogram of 40 μg of protein from conditioned media (24 h) from indicated cell lines reveals secreted MMP-2 (72 kDa) and MMP-9 (92 kDa) activity, arrows indicate the pro- and active- MMP-2 or MMP-9. Representative image of 3 independent experiments. See also Figure S2.
Figure 3
Figure 3
Delta viral-like particles preferentially use the metalloproteinase-dependent entry pathway in HT1080-ACE2 cells (A and B) S processing onto purified lentiviral (LVP) and virus-like particles (VLP) was analyzed by immunoblot using an anti-S2 antibody allowing the detection of S0 and S2. As for controls, anti-p24 and anti-N antibodies were used for LVP and VLP respectively. Representative blot of 3 independent experiment is shown. (C–E) VLP entry assay on 293T-ACE2, Calu-3, and HT1080-ACE2 cells pre-treated for 1 h with 25 μM Camostat, 10 μM E64days, 40 μM TAPI-2, 10 μM GIX, 20 μM MMP-2/9 inhibitor or Vehicle (DMSO). VLP entry was measured 24 h post-infection by measuring the activity of the luciferase reporter. Each bar shows the mean of triplicate values of 3 independent experiments (n = 3) with SD. Significance was determined by ANOVA (one-way ANOVA) followed by a Dunnett’s multiple comparisons test. P-value lower than 0.05 was used to indicate a statistically significant difference (∗∗∗∗, p < 0.0001, ∗∗∗, p < 0.001, ∗∗, p < 0.01, ∗, p < 0.05).
Figure 4
Figure 4
MMP-2/MMP-9 knockdown reduces the metalloproteinase-dependent syncytia formation (A) HT1080-ACE2 cells were transfected with the indicated DsiRNAs at a final concentration of 10nM, and relative mRNA levels of MMP-2 and MMP-9 were measured by RT-qPCR. The level of actin mRNA expression in each sample was used to standardize the data, and normalization on negative control DsiRNA gene expression was performed. (B) Gelatin zymogram of 25 μg of protein from conditioned media (24 h) from HT1080-ACE2 cells in (A), arrows indicate the pro- and active- MMP-2 or MMP-9. Representative results of 2 independent experiments are shown. (C) Representative images of syncytia formation. HT1080-ACE2 cells were transfected with the indicated DsiRNAs alone or in combination (1:1 ratio) at a final concentration of 10 nM for 20 h, followed by transfection with pLV-GFP and D614G spike protein. Images were taken 5 h post-transfection (n = 3). The scale bar represents 300 μm. (D) Quantification of GFP + surface areas (sixteen images per well) at 5 h post-transfection normalized to non-targeting negative control DsiRNA. (E) HT1080 (effector) and HT1080-ACE2 (target) cells were transfected with DsiRNAs as described. Effector cells were then transfected with plasmids encoding D614G spike protein and ZipV2 and target HT1080-ACE2 cells were transfected with plasmid encoding ZipV1. A day after transfection, effector and target cells were detached and co-cultured. Bimolecular fluorescence complementation signal was acquired at 5 h of co-culture. Relative fusion is relative to effector cells transfected with pCAGGS instead of the spike protein. Each bar shows the mean of 2-3 independent experiments done in triplicate or quadruplicate with SD. Significance was determined by ANOVA (one-way ANOVA) followed by a Dunnett’s multiple comparisons test. p-value lower than 0.05 was used to indicate a statistically significant difference (∗∗∗∗, p < 0.0001 and ∗, p < 0.05). See also Figure S3.
Figure 5
Figure 5
Native Alpha variant infection and the cell fusion of infected cells are blocked by metalloproteinase inhibitors in HT1080-ACE2 cells (A) Visualization of HT1080-ACE2 syncytia formation after infection by Alpha in presence of indicated inhibitors or vehicle. Cells were treated with Camostat (20 μM), E64days (10 μM), TAPI-2 (20 μM), GIX (10 μM), or Vehicle (DMSO) and then infected with Alpha. After 20 h, cells were washed, blocked, and stained with anti-SARS-CoV-2 spike (S), anti-SARS-CoV-2 nucleocapsid (N) followed by staining with DAPI and fluorescently labeled secondary antibodies. Nuclei, S and N proteins are shown in purple, red, and green respectively. Fluorescent images were acquired with an EVOS™ M7000 Imaging System. Images are representative of 3 independent experiments. Arrows point to syncytia. The scale bar represents 300 μm. (B) SARS-CoV-2 infection quantification following infection in presence of indicated inhibitors or vehicle. 20 h post-infection, cells were washed, blocked, permeabilized, and stained with mouse anti-SARS-CoV-2 N protein followed by an anti-mouse IgG HRP in conjunction with SIGMAFAST™ OPD developing solution. Optical density (OD) at 490 nm was measured. Each bar shows the mean of triplicate values of 3 independent experiments with error bars showing SD. Significance was determined by ANOVA (one-way ANOVA) followed by a Dunnett’s multiple comparisons test. p-value lower than 0.05 was used to indicate a statistically significant difference (∗∗∗∗, p < 0.0001, ∗∗∗, p < 0.001, ∗∗, p < 0.01, ∗, p < 0.05). See also Figure S4.
Figure 6
Figure 6
Omicron S is not effectively triggered in a metalloproteinase-dependent manner (A) Effector 293T cells transfected with plasmids encoding the indicated S, and ZipVenus1, were co-cultured with target 293T cells transfected with plasmids encoding ZipVenus 2, ACE2, and TMPRSS2 or empty vector. Fluorescence generated by the reconstitution of ZIPVenus upon cell-cell fusion was measured at 4 h of co-culture (1:1 ratio). Bar graph shows the mean of quadruplicate values of a representative experiment of 3 independent experiments with error bars showing SD. (B) S processing in effector 293T cells was analyzed by immunoblot using an anti-S2 antibody allowing the detection of S0 and S2. As for loading control, anti-GAPDH antibody was used. Representative image of 3 independent experiments. (C–E) Omicron Spike VLP entry assay on (C) 293T-ACE2, (D) Calu-3, and (E) HT1080-ACE2 cells pre-treated for 1 h with 25 μM Camostat, 10 μM E64days, 40 μM TAPI-2, 10 μM GIX, 20 μM MMP-2/9 Inhibitor or Vehicle (DMSO). VLP entry was measured 24 h post-infection by measuring the activity of the luciferase reporter. Each bar shows the mean of triplicate values of ≥3 independent experiments with error bars showing SD. Significance was determined by ANOVA (one-way ANOVA) followed by a Dunnett’s multiple comparisons test. p-value lower than 0.05 was used to indicate a statistically significant difference (∗∗∗∗, p < 0.0001, ∗∗∗, p < 0.001, ∗∗, p < 0.01, ∗, p < 0.05). See also Figure S5.
Figure 7
Figure 7
Omicron S chimera with P681R allows MMP-dependent entry (A and B) (A) Schematics of chimeric S glycoprotein (B) Processing of chimeric S glycoprotein of virus-like particles (VLP) was analyzed by immunoblot using an anti-S2 antibody allowing the detection of S0 and S2. As for control, anti-M antibody was used. (C) VLP entry assay on HT1080-ACE2 cell pre-treated for 1 h with 25 μM Camostat, 10 μM E64days, 40 μM TAPI-2, 10 μM GIX, 20 μM MMP-2/9 inhibitor or Vehicle (DMSO). VLP entry was measured 24 h post-infection by measuring the activity of the luciferase reporter. Each bar shows the mean of triplicate values of at least 3 independent experiments (n ≥ 3) with SD. Significance was determined by ANOVA (one-way ANOVA) followed by a Dunnett’s multiple comparisons test. p-value lower than 0.05 was used to indicate a statistically significant difference (∗∗∗∗, p < 0.0001, ∗∗∗, p < 0.001, ∗∗, p < 0.01, ∗, p < 0.05).
Figure 8
Figure 8
Proposed model of the different SARS-CoV-2 entry pathways SARS-CoV-2 entry is mediated by the activation of S via proteolytic cleavage by host proteases. In the cathepsin-dependent entry pathway, SARS-CoV-2 is internalized following ACE2 binding and trafficked to endosomes where cathepsin L can cleave and activate unprocessed S (S0) and processed S (S1/S2) for the activation of membrane fusion. In the TMPRSS2-dependent entry pathway, S0 and S1/S2 are activated by TMPRSS2 (or other surface serine proteases such as TMPRSS13) following ACE2 engagement, leading to membrane fusion at the cell surface. In the MMP-dependent entry pathway, only processed S (S1/S2) is activated via MMPs following ACE2 binding allowing membrane fusion.

Similar articles

Cited by

References

    1. Abers M.S., Delmonte O.M., Ricotta E.E., Fintzi J., Fink D.L., De Jesus A.A.A., Zarember K.A., Alehashemi S., Oikonomou V., Desai J.V., et al. An immune-based biomarker signature is associated with mortality in COVID-19 patients. JCI Insight. 2021;6:e144455. doi: 10.1172/jci.insight.144455. - DOI - PMC - PubMed
    1. Ardi V.C., Kupriyanova T.A., Deryugina E.I., Quigley J.P. Human neutrophils uniquely release TIMP-free MMP-9 to provide a potent catalytic stimulator of angiogenesis. Proc. Natl. Acad. Sci. USA. 2007;104:20262–20267. doi: 10.1073/pnas.0706438104. - DOI - PMC - PubMed
    1. Arora P., Sidarovich A., Krüger N., Kempf A., Nehlmeier I., Graichen L., Moldenhauer A.-S., Winkler M.S., Schulz S., Jäck H.M., et al. B.1.617.2 enters and fuses lung cells with increased efficiency and evades antibodies induced by infection and vaccination. Cell Rep. 2021;37:109825. doi: 10.1016/j.celrep.2021.109825. - DOI - PMC - PubMed
    1. Avila-Mesquita C.D., Couto A.E.S., Campos L.C.B., Vasconcelos T.F., Michelon-Barbosa J., Corsi C.A.C., Mestriner F., Petroski-Moraes B.C., Garbellini-Diab M.J., Couto D.M.S., et al. MMP-2 and MMP-9 levels in plasma are altered and associated with mortality in COVID-19 patients. Biomed. Pharmacother. 2021;142:112067. doi: 10.1016/j.biopha.2021.112067. - DOI - PMC - PubMed
    1. Belouzard S., Chu V.C., Whittaker G.R. Activation of the SARS coronavirus spike protein via sequential proteolytic cleavage at two distinct sites. Proc. Natl. Acad. Sci. USA. 2009;106:5871–5876. doi: 10.1073/pnas.0809524106. - DOI - PMC - PubMed