. 2022 Dec;13(6):3106-3121.
doi: 10.1002/jcsm.13094. Epub 2022 Oct 18.

Engineered skeletal muscle recapitulates human muscle development, regeneration and dystrophy

Affiliations

Engineered skeletal muscle recapitulates human muscle development, regeneration and dystrophy

Mina Shahriyari et al. J Cachexia Sarcopenia Muscle. 2022 Dec.

Abstract

Background: Human pluripotent stem cell-derived muscle models show great potential for translational research. Here, we describe developmentally inspired methods for the derivation of skeletal muscle cells and their utility in skeletal muscle tissue engineering with the aim to model skeletal muscle regeneration and dystrophy in vitro.

Methods: Key steps include the directed differentiation of human pluripotent stem cells to embryonic muscle progenitors followed by primary and secondary foetal myogenesis into three-dimensional muscle. To simulate Duchenne muscular dystrophy (DMD), a patient-specific induced pluripotent stem cell line was compared to a CRISPR/Cas9-edited isogenic control line.

Results: The established skeletal muscle differentiation protocol robustly and faithfully recapitulates critical steps of embryonic myogenesis in two-dimensional and three-dimensional cultures, resulting in functional human skeletal muscle organoids (SMOs) and engineered skeletal muscles (ESMs) with a regeneration-competent satellite-like cell pool. Tissue-engineered muscle exhibits organotypic maturation and function (up to 5.7 ± 0.5 mN tetanic twitch tension at 100 Hz in ESM). Contractile performance could be further enhanced by timed thyroid hormone treatment, increasing the speed of contraction (time to peak contraction) as well as relaxation (time to 50% relaxation) of single twitches from 107 ± 2 to 75 ± 4 ms (P < 0.05) and from 146 ± 6 to 100 ± 6 ms (P < 0.05), respectively. Satellite-like cells could be documented as largely quiescent PAX7+ cells (75 ± 6% Ki67- ) located adjacent to muscle fibres confined under a laminin-containing basal membrane. Activation of the engineered satellite-like cell niche was documented in a cardiotoxin injury model with marked recovery of contractility to 57 ± 8% of the pre-injury force 21 days post-injury (P < 0.05 compared to Day 2 post-injury), which was completely blocked by preceding irradiation. Absence of dystrophin in DMD ESM caused a marked reduction of contractile force (-35 ± 7%, P < 0.05) and impaired expression of fast myosin isoforms resulting in prolonged contraction (175 ± 14 ms, P < 0.05 vs. gene-edited control) and relaxation (238 ± 22 ms, P < 0.05 vs. gene-edited control) times. Restoration of dystrophin levels by gene editing rescued the DMD phenotype in ESM.

Conclusions: We introduce human muscle models with canonical properties of bona fide skeletal muscle in vivo to study muscle development, maturation, disease and repair.

Keywords: Duchenne muscular dystrophy; hypaxial dermomyotome; limb muscle; satellite cells; skeletal muscle organoid; somite; tissue engineering.


Conflict of interest statement

The University of Göttingen has filed a patent on skeletal muscle generation listing M. Shahriyari, W‐H.Z. and M.T. as inventors (WO 2021/074126A1). W‐H.Z. is founder, shareholder and advisor of myriamed GmbH, MyriaMeat GmbH and Repairon GmbH. M.T. is founder of MyriaMeat GmbH and advisor of myriamed GmbH and Repairon GmbH.

Figures

Figure 1
Figure 1
Skeletal myocyte differentiation from human pluripotent stem cells (PSCs) in 2D and 3D cultures. (A) Summary of the protocol for directed skeletal muscle differentiation from PSCs indicating the sequence and the timing of factor addition to modulate specific signalling pathways involved in skeletal myogenesis. Skeletal muscle organoids (SMOs) were generated from induced PSC (iPSC) mixed with collagen type 1 and Matrigel™ in a ring‐shaped hydrogel. After consolidation in PDMS casting moulds, SMOs were directed towards skeletal muscle using the indicated protocol established in 2D monolayer cultures. Scale bars: 5 and 1 mm (3D panels); 50 μm (2D panels). (B) Transcript levels (RNA counts measured by nCounter) of signature genes for pluripotency (POU5F1), paraxial mesoderm (TBX6), somitogenesis (PAX3, SIM1 and EN1), myogenic transcription factors (PAX7, MYOD1 and MYOG), structural assembly (MYMK and ACTN2) and secondary myogenesis (ENO3 and MYH8) during skeletal muscle differentiation from human PSCs in SMO and 2D; n = 3–5 per time point and group, * P < 0.05 by two‐way analysis of variance (ANOVA) and Sidak's multiple comparison test
Figure 2
Figure 2
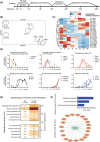
Developmental transcriptome patterns in pluripotent stem cell (PSC) skeletal myocyte differentiation. (A) Scheme of skeletal muscle differentiation from human PSCs (HES2) with sampling time points for RNA sequencing. (B) Unsupervised clustering of the samples from different time points. (C) Weighted co‐expression analysis identified 22 clusters of genes with similar expression dynamics (co‐expression clusters); a heatmap of mean eigenvalues is displayed. (D) Normalized expression levels (reads per kilobase million [RPKM]) of indicated signature genes in identified co‐expression clusters, n = 2–4 per time point. (E) Developmentally regulated genes were identified based on a published human embryonic muscle data set. The table indicates the overlap of co‐expression cluster genes to genes regulated between presomitic mesoderm (PSM) and nascent somite (SM) or presomitic mesoderm (PSM) and developed somite (Dev SM). Overlap is graded as either not significant (n.s.), * P < 0.05, ** P < 0.01 or *** P < 0.001 by Fisher's exact test. The colour codes for the number of overlapping genes. As differentially expressed genes were obtained by comparing to SM and Dev SM to PSM, preceding developmental processes (i.e., paraxial mesoderm formation and earlier) are not represented in the embryo data set and therefore cannot overlap with in vitro processes (labelled as not applicable, n.a.). Clusters that were not muscle related and did not significantly overlap were omitted. (F) Gene Ontology (GO) terms specifically enriched in co‐expression cluster #5 (top panel). List of genes associated with ‘regulation of signaling’ in co‐expression cluster #5 (bottom panel)
Figure 3
Figure 3
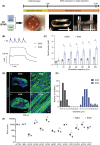
Advanced development of skeletal muscle function in human engineered skeletal muscle (ESM). (A) Scheme of ESM generation from human PSC‐derived skeletal myocytes with collagen type 1 and Matrigel™ in a ring‐shaped hydrogel. ESM formation in expansion medium for 1 week in PDMS casting moulds, functional maturation under isometric mechanical load (ESM on metal hooks). Scale bar: 5 mm. (B) Representative original recordings of single twitches at 1 Hz and tetanic contraction at 100 Hz of skeletal muscle organoid (SMO) (black lines) and ESM (blue lines). (C) Twitch tension in response to increasing stimulation frequencies of SMO (black bars) and ESM (blue bars) after 4 weeks of maturation; n = 15 for SMO and n = 11 for ESM, * P < 0.05 by two‐way analysis of variance (ANOVA) and Tukey's multiple comparison test. (D) Immunostaining of ACTIN+ muscle cells (green) in cross sections and longitudinal sections of SMO and ESM after 4 weeks of maturation. Scale bar: 500 μm (A, C) and 20 μm (B, D). (E) Myofibre diameter distribution in SMO and ESM after 4 weeks of maturation. (F) Transcript levels (RNA counts measured by nCounter) of indicated muscle genes in SMO and ESM, n = 7/3 (SMO/ESM), * P < 0.05 by two‐way ANOVA and Sidak's multiple comparison test
Figure 4
Figure 4
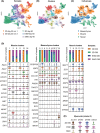
Cellular composition of differentiated skeletal myogenic cultures in 2D and 3D. (A) Unsupervised clustering (Uniform Manifold Approximation and Projection [UMAP]) of single‐nucleus transcriptomes. Colour coding indicates different input samples (2D Day 22 skeletal muscle cultures, 2D Day 60 skeletal muscle cultures, 3D Day 60 engineered skeletal muscle (ESM) and Day 60 skeletal muscle organoid (SMO). (B) Unsupervised clustering (UMAP) of single‐nucleus transcriptomes identifies 19 cell clusters. (C) Unsupervised clustering (UMAP) of single‐nucleus transcriptomes to identify major cell groups based on enrichment of muscle, neural and mesenchymal genes. Muscle clusters are further specified as myogenic progenitors (MP), myoblasts (MB), satellite‐like cell (SLC) and myonuclei (MN) based on transcriptional profiles indicated in (D). (D) Transcriptional profiles of the clusters separated by major cell groups (muscle, mesenchyme and neural). The relative contribution of the different samples to each cluster is indicated in the bar graphs. (E) Comparison of genes associated with secondary myogenesis and maturation in the myonuclei cluster (#3) between 2D Day 60, ESM Day 60 and SMO Day 60 samples.
Figure 5
Figure 5
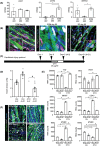
Advancing engineered skeletal muscle (ESM) function by thyroid hormone treatment. (A) Experimental design: ESM maturation for 9 weeks with or without additional application of 0.1 μmol/L triiodo‐l‐thyronine (T3) for 4 weeks. (B) Twitch tension in response to increasing stimulation frequencies of 9‐week‐old ESM cultured with (blue bars) or without T3 (black bars); n = 7–10 per group. (C) Quantification of contraction (T1) and relaxation (T2) time of single twitches of 9‐week‐old control (black bars) or +T3 (blue bars) ESM at 1 Hz (first panel); normalized representative traces of single twitches of 9‐week‐old control (black line) or +T3 (blue line) ESM at 1 Hz (second panel); n = 5–11 per group, * P < 0.05 by unpaired, two‐sided Student's t test. (D) Rate of force development (RFD; rate of contraction: dTT/dt+ and rate of relaxation: dTT/dt−) of 9‐week‐old control (black bars) or +T3 (blue bars) ESM at 100 Hz tetanus (first panel); representative traces of twitch tension of 9‐week‐old control (black line) or +T3 (blue line) ESM at 100 Hz tetanus (fourth panel); n = 4–11 per group, * P < 0.05 by unpaired, two‐tailed Student's t test. (E) Immunoblot for fast myosin heavy chain (MHC) isoforms, slow MHC (MYH7), embryonic MHC (MYH3) and loading control vinculin (VCL). Protein abundance of fast MHC (left panel), MYH7 (middle panel) and MYH3 (right panel) in 9‐week‐old ESM cultured with (blue bars) or without T3 (black bars); n = 3 per group, * P < 0.05 by unpaired, two‐tailed Student's t test
Figure 6
Figure 6
Maturation of muscle structure in engineered skeletal muscle (ESM). (A) Immunostaining of β‐dystroglycan (magenta) in the sarcolemma of actin+ muscle fibres (green) in an ESM cross section. Scale bar: 40 μm. (B) Immunostaining of dystrophin (magenta) in the sarcolemma of actinin+ muscle fibres (green) in an ESM cross section. Scale bar: 30 μm. (C) Transmission electron microscopy (TEM) images of sarcomere ultrastructure, T‐tubular triads and mitochondria along the muscle fibres in ESM. M, M line; Mt, mitochondria; TT, T‐tubule. Scale bar: 1 μm (left and middle panels) and 250 nm (right panel)
Figure 7
Figure 7
Regenerative capacity of human engineered skeletal muscle. (A) RNA transcript (reads per kilobase million [RPKM]) of indicated muscle stem cell markers in 2D monolayer cells at Day 22 and Day 60, plus Day 60 ESM; n = 3–4 per group, * P < 0.05 by one‐way analysis of variance (ANOVA) and Tukey's multiple comparison test. (B) Immunostaining of longitudinal sections of Day 60 ESM for laminin (magenta), Ki67 (magenta), actin (green), PAX7 (grey) and nuclei (blue). Scale bars: 10 μm. Immunostaining of laminin (magenta), PAX7 (grey), actin (green) and nuclei (blue) in 2D monolayer cultures at Day 60. Scale bar: 50 μm. (C) Experimental design of cardiotoxin (CTX) injury model. ESMs were incubated with 25 μg/mL CTX for 24 h. (D) Tetanic twitch tension at 100 Hz stimulation frequency of ESM at indicated time points after CTX (25 μg/mL) injury or control (Ctrl) condition; n = 7–8 per group, * P < 0.05 versus the respective Ctrl Day +2, by one‐way ANOVA and Tukey's multiple comparison test, # P < 0.05 CTX Day +2 versus CTX Day +21. (E) RNA transcript abundance for indicated genes at early (d+2) and late (d+21) time points after CTX (25 μg/mL) injury or control (Ctrl) conditions; n = 3, * P < 0.05 by one‐way ANOVA and Tukey's multiple comparison test. (F) Immunostaining of sarcomeric α‐actinin (green), PAX7 (grey) and nuclei (blue) in ESM at indicated time points. Scale bars: 50 μm
Figure 8
Figure 8
Modelling Duchenne muscular dystrophy in engineered skeletal muscle (ESM). (A) Immunostaining of sarcomeric α‐actinin (green) and nuclei of 2D monolayer skeletal muscle cells at Day 22 from Del and Del‐Cor lines. Scale bar: 50 μm. (B) Immunoblot for dystrophin in WT, Del and Del‐Cor skeletal myocytes. Vinculin serves as loading control. (C) Immunostaining of 5‐week‐old ESM cross sections for dystrophin (magenta), α‐actinin (green) and nuclei. Scale bar: 20 μm. (D) Immunoblot of ESM for α‐actinin, dystrophin and fast myosin heavy chain. Vinculin serves as loading control. Quantification of protein data, n = 3, * P < 0.05 by unpaired, two‐sided Student's t test. (E) Twitch tension in response to increasing stimulation frequencies of 5‐week‐old Del‐ESM (black bars) and Del‐Cor ESM (blue bars), n = 8 per group, * P < 0.05 by two‐way analysis of variance (ANOVA) and Tukey's multiple comparison test. (F) Quantification of contraction (T1) and relaxation (T2) times of single twitches of 5‐week‐old Del‐ESM (black bars) or Del‐Cor ESM (blue bars) ESM at 1 Hz. * P < 0.05 by unpaired, two‐sided Student's t test

References

    1. Davis RL, Weintraub H, Lassar AB. Expression of a single transfected cDNA converts fibroblasts to myoblasts. Cell 1987;51:987–1000. - PubMed
    1. Striedinger K, Barruet E, Pomerantz JH. Purification and preservation of satellite cells from human skeletal muscle. STAR Protoc 2021;2:100302. - PMC - PubMed
    1. Mamchaoui K, Trollet C, Bigot A, Negroni E, Chaouch S, Wolff A, et al. Immortalized pathological human myoblasts: towards a universal tool for the study of neuromuscular disorders. Skelet Muscle 2011;1:34. - PMC - PubMed
    1. Kim J, Magli A, Chan SSK, Oliveira VKP, Wu J, Darabi R, et al. Expansion and purification are critical for the therapeutic application of pluripotent stem cell‐derived myogenic progenitors. Stem Cell Rep 2017;9:12–22. - PMC - PubMed
    1. Darabi R, Arpke RW, Irion S, Dimos JT, Grskovic M, Kyba M, et al. Human ES‐ and iPS‐derived myogenic progenitors restore DYSTROPHIN and improve contractility upon transplantation in dystrophic mice. Cell Stem Cell 2012;10:610–619. - PMC - PubMed

Publication types

MeSH terms