. 2023 May;18(5):1139-1146.
doi: 10.4103/1673-5374.355765.

Ocular manifestations of central insulin resistance

Affiliations

Ocular manifestations of central insulin resistance

Muneeb A Faiq et al. Neural Regen Res. 2023 May.

Abstract

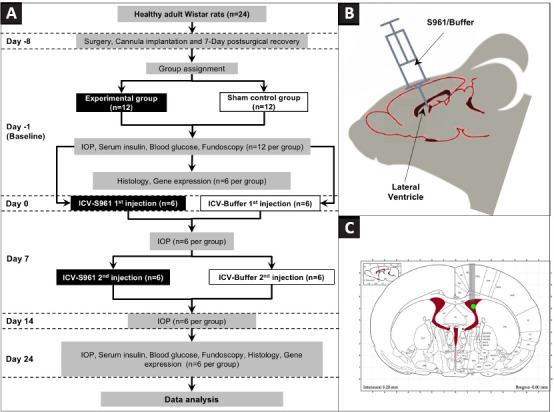
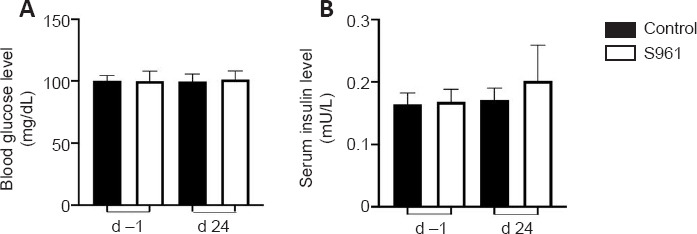
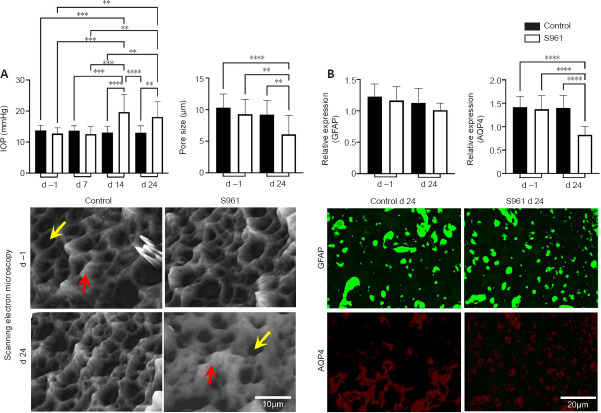
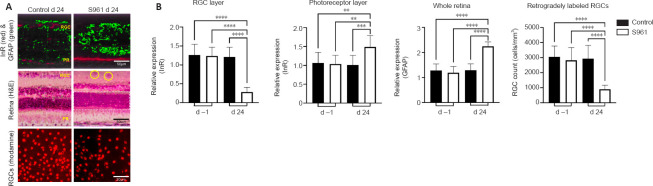
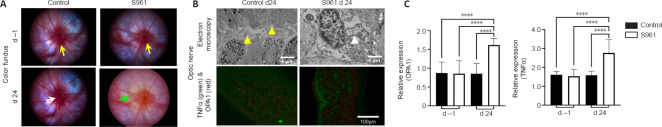
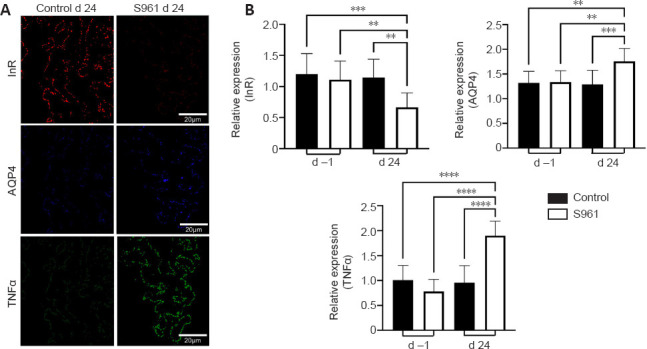
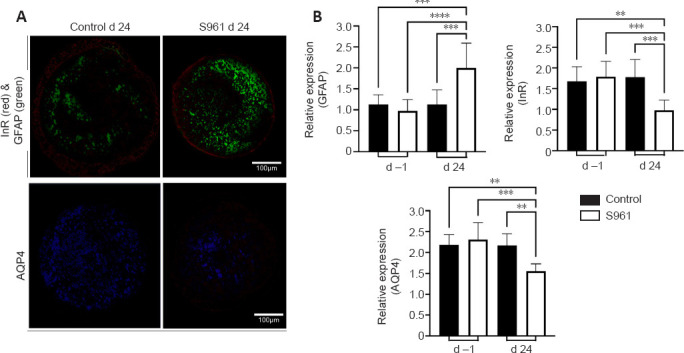
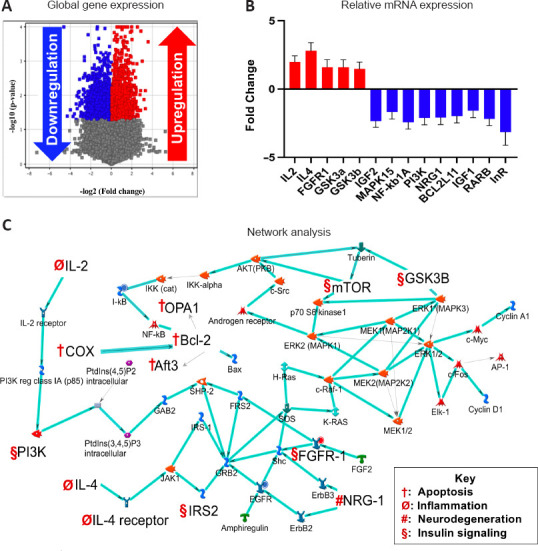
Central insulin resistance, the diminished cellular sensitivity to insulin in the brain, has been implicated in diabetes mellitus, Alzheimer's disease and other neurological disorders. However, whether and how central insulin resistance plays a role in the eye remains unclear. Here, we performed intracerebroventricular injection of S961, a potent and specific blocker of insulin receptor in adult Wistar rats to test if central insulin resistance leads to pathological changes in ocular structures. 80 mg of S961 was stereotaxically injected into the lateral ventricle of the experimental group twice at 7 days apart, whereas buffer solution was injected to the sham control group. Blood samples, intraocular pressure, trabecular meshwork morphology, ciliary body markers, retinal and optic nerve integrity, and whole genome expression patterns were then evaluated. While neither blood glucose nor serum insulin level was significantly altered in the experimental or control group, we found that injection of S961 but not buffer solution significantly increased intraocular pressure at 14 and 24 days after first injection, along with reduced porosity and aquaporin 4 expression in the trabecular meshwork, and increased tumor necrosis factor α and aquaporin 4 expression in the ciliary body. In the retina, cell density and insulin receptor expression decreased in the retinal ganglion cell layer upon S961 injection. Fundus photography revealed peripapillary atrophy with vascular dysregulation in the experimental group. These retinal changes were accompanied by upregulation of pro-inflammatory and pro-apoptotic genes, downregulation of anti-inflammatory, anti-apoptotic, and neurotrophic genes, as well as dysregulation of genes involved in insulin signaling. Optic nerve histology indicated microglial activation and changes in the expression of glial fibrillary acidic protein, tumor necrosis factor α, and aquaporin 4. Molecular pathway architecture of the retina revealed the three most significant pathways involved being inflammation/cell stress, insulin signaling, and extracellular matrix regulation relevant to neurodegeneration. There was also a multimodal crosstalk between insulin signaling derangement and inflammation-related genes. Taken together, our results indicate that blocking insulin receptor signaling in the central nervous system can lead to trabecular meshwork and ciliary body dysfunction, intraocular pressure elevation, as well as inflammation, glial activation, and apoptosis in the retina and optic nerve. Given that central insulin resistance may lead to neurodegenerative phenotype in the visual system, targeting insulin signaling may hold promise for vision disorders involving the retina and optic nerve.

Keywords: brain; ciliary bodies; gene expression; inflammation; insulin receptor; insulin resistance; intraocular pressure; neurodegeneration; optic nerve; retina; retinal ganglion cells; trabecular meshwork.


Conflict of interest statement

None

Figures

Figure 1
Figure 1
Overall experimental paradigm. (A) Experimental procedure flow chart before and after intracerebroventricular (ICV) S961 or buffer solution injection on day 0. (B) Schematic diagram of the site of S961 or buffer injection in the lateral ventricle of the rat brain in the sagittal view. (C) Rat brain atlas (http://labs.gaidi.ca/rat-brain-atlas/) at the level of the lateral ventricles (red) in the coronal view. The grey bar represents the location of cannula implantation for S961 or buffer delivery. The green dot indicates the site of injection in the right lateral ventricle. IOP: Intraocular pressure.
Figure 2
Figure 2
Blood glucose and serum insulin levels. (A) Blood glucose levels (mg/dL) at 1 day before (d –1) and 24 days (d 24) after buffer control (black) or experimental S961 injection (white). There was no significant difference in blood glucose levels between experimental and control groups or between time points. (B) Serum insulin levels (mU/L) at –1 and 24 days. There was no statistically significant difference in serum insulin levels between experimental and control groups or between time points, despite a slight increase in the serum insulin level in the S961-injected group at 24 days post-injection. Results are expressed as the mean ± SEM with n = 6 per group per time point (two-way analysis of variance followed by Tukey’s honest significant difference post hoc test; experiments were run in triplicate).
Figure 3
Figure 3
Changes in intraocular pressure and trabecular meshwork. (A) (Top left) Intraocular pressure (IOP) of the buffer control (black) and experimental S961 groups (white) at –1 (baseline), 7, 14 and 24 days after intracerebroventricular injection. There was a significant IOP increase at 14 and 24 days relative to –1 and 7 days in the S961-injected group. No significant IOP change was observed in the control group. (Top right) Pore size of the trabecular meshwork at –1 and 24 days in the two groups using scanning electron microscopy (Bottom). At 24 days, the pores (yellow arrows) were apparently decreased in size while the bordering tissues representing the meshwork beams (red arrows) were thickened in the S961-injected animals compared with baseline. No apparent change was observed in the porosity or beam thickness in the trabecular meshwork of the control group between –1 and 24 days. (B) Relative expression of glial fibrillary acidic protein (GFAP) and aquaporin 4 (AQP4) in the trabecular meshwork of both groups at –1 and 24 days. GFAP expression did not show any significant change in either group despite a downward trend for the S961 group. Immunofluorescence images demonstrate similar level of GFAP expression (green) at 24 days in the S961 and control groups. There was, however, a significant decrease in the expression of AQP4 (red) in the trabecular meshwork of the S961 group at 24 days. Results are presented as the mean ± SEM with n = 6 per group per time point (two-way analysis of variance followed by Tukey’s honest significant difference post hoc test: **P < 0.01, ***P < 0.001, ****P < 0.0001; n.s.: not significant; experiments were run in triplicate).
Figure 4
Figure 4
Immunohistochemical and cellular alterations in the retina. (A) (Top row) Immunofluorescence images showing glial fibrillary acidic protein (GFAP) (green) and insulin receptor (InR) (red) expression of retinal cross sections between buffer control (left column) and S961-injected animals (right column) at 24 days after injection. There was a decrease in InR expression in the retinal ganglion cell (RGC) layer and an increase in InR expression in photoreceptor (PR) layer were observed at 24 days in the S961 group. A pan-retinal increase in GFAP expression was also observed in the S961 group compared with the control group. (Middle row) Histological hematoxylin & eosin (H&E) staining of the retinal cross sections revealed a decrease in cell density in the RGC layer in the S961 group compared with the control group at 24 days. Note the dense, enlarged nuclei in the S961 group at 24 days (yellow circles) indicating apoptosis. The outer nuclear layer also showed edema in the S961 group at 24 days (white dotted box) with disorganized cellular architecture in the PR layer. (Bottom row) RGCs retrogradely labeled from the optic nerve using rhodamine labeled dextran amine (red) showed cell count decrease in the S961 group (right) at 24 days compared with the control group. (B) (Leftmost) Relative expression of InR in the RGC layer in the experimental S961 group (white) and buffer control group (black) at –1 day (baseline) and 24 days. There was a significant decrease in InR expression in the RGC layer for the S961 group at 24 days. (Middle left) Relative expression of InR in the PR layer of both groups at –1 and 24 days, with a significant increase in InR expression in PR layer in the S961 group. (Middle right) Relative expression of GFAP in the whole retina in the experimental and control groups at –1 and 24 days, with a significant increase in GFAP expression after S961 injection. (Rightmost) Absolute cell number counts in RGCs using rhodamine labelled dextran amine showed significant RGC loss in the S961 group at 24 days compared with baseline and the control group at 24 days. Results are presented as the mean ± SEM with n = 6 per group (two-way analysis of variance followed by Tukey’s honest significant difference post hoc test: **P < 0.01, ***P < 0.001, ****P < 0.0001; experiments were run in triplicate).
Figure 5
Figure 5
Color fundus photography and electron microscopy of the optic nerve. (A) Color fundus photographs of the control (left column) and S961-injected (right column) animals at –1 day (d –1; baseline; upper row) and 24 days (d 24; lower row). At –1 day, the images showed distinct boundaries of the optic nerve head (yellow arrows) and a reddish flush (white arrow) indicative of intact microvasculature in both groups. At 24 days, the S961 group showed a lack of distinct boundary in the retina (green arrow) at the peripapillary region, suggestive of optic nerve edema in agreement with histology in Figure 4. The reddish flush was also less apparent in the S961 group at 24 days indicative of disruption of microvascular integrity. (B) (Upper row) Transmission electron micrographs showed intact cellular architecture (yellow arrowheads) in the optic nerve head of control group (left) at 24 days while there were degenerative changes with fibroblast infiltration (white arrowhead) in the S961 group at 24 days (right). (Lower row) Immunofluorescence images showed the differential expression of tumor necrosis factor alpha (TNFα) (green) and optic atrophic factor 1 (OPA1) (red) near the optic nerve head, with higher expression in the S961 group (right) than the control group (left) at 24 days. (C) Quantitative analysis of the relative expression of OPA1 (left) and TNFα (right) in the optic nerve head at –1 (baseline) and 24 days in the control (black) and S961 groups (white), showing a significant increase in both OPA1 and TNFα expression in the S961 group at 24 days. Results are presented as the mean ± SEM with n = 6 per group (two-way analysis of variance followed by Tukey’s honest significant difference post hoc test: ****P < 0.0001; experiments were run in triplicate).
Figure 6
Figure 6
Immunohistochemical changes in the ciliary bodies. (A) Immunofluorescence images of the ciliary bodies showing the expression of insulin receptor (InR) (top row; red), aquaporin-4 (AQP4) (middle row; blue) and tumor necrosis factor alpha (TNFα) (bottom row; green) in the buffer control group (left column) and the experimental S961 group (right column) at 24 days. A marked decrease in InR and increases in AQP4 and TNFα expression were apparent in the S961 group as compared to the buffer control. (B) Quantitative analysis of the relative expression of InR (top), AQP4 (middle), and TNFα (bottom) in the ciliary bodies of the control (black) and S961 groups (white) at –1 day (baseline) and 24 days, showing a significant decrease in InR and increases in AQP4 and TNFα expression in the S961 group at 24 days. Results are presented as the mean ± SEM with n = 6 per group. (Two-way analysis of variance followed by Tukey’s honest significant difference post hoc test: **P < 0.01, ***P < 0.001, ****P < 0.0001; experiments were run in triplicate).
Figure 7
Figure 7
Immunohistochemical changes in the optic nerve. (A) Immunofluorescence images of optic nerve cross section showing the expression of InR (top row, red), GFAP (top row, green), and AQP4 (bottom row, blue) in the control group (left column) and the S961 group (right column) at 24 days, with higher GFAP, and lower InR and AQP4 expression being observed in the S961 group relative to the buffer control. (B) Quantitative analysis of the relative expression of GFAP (top left), InR (top right), and AQP4 (bottom) in the optic nerve of the experimental S961 group (white) and buffer control group (black) at –1 day (baseline) and 24 days. There was a significant increase in GFAP expression and significant decreases in InR and AQP4 expression being detected in the optic nerve in the S961 group at 24 days. Results are presented as the mean ± SEM with n = 6 per group (two-way analysis of variance followed by Tukey’s honest significant difference post hoc test: **P < 0.01, ***P < 0.001, ****P < 0.0001; experiments were run in triplicate). AQP4: Aquaporin 4; GFAP: glial fibrillary acidic protein.
Figure 8
Figure 8
Gene expression and network analyses. (A) Volcano plot showing the gene expression pattern in terms of fold change in the retina at 24 days after intracerebroventricular S961 injection. Each dot represents a gene with blue (downregulation) and red (upregulation) indicating genes that had significantly changed expression (unpaired t-tests, P < 0.05). Out of the 17,295 genes mapped using the Affymetrix RaGene-1_0-st-v1-type arrays, 65 were upregulated (red) and 47 were downregulated (blue). (B) A selected cohort of 14 dysregulated genes from A was further validated with real-time polymerase chain reaction analysis where interleukin 2 (IL2), interleukin 4 (IL4), fibroblast growth factor receptor 1 (FGFR1), glycogen synthase kinase 3a (GSK3a), and glycogen synthase kinase 3b (GSK3b) were upregulated (red) and insulin like growth factor 2 (IGF2), mitogen-activated protein kinase 15 (MAPK15), nuclear factor kappa B1A (NF-κb1A), phosphatidylinositol 3-kinase (PI3K), neuregulin 1 (NRG1), BCL2L11, insulin like growth factor 1 (IGF1), retinoic acid receptor beta (RARB) and insulin receptor (InR) were downregulated (blue) (all P < 0.05). Results are expressed as the mean ± SEM. (C) Network analysis showing highly scored network from statistical analysis for MetaCore with thick cyan lines indicating parts of canonical pathways (n = 6). Aft3: Activating transcription factor 3; COX: cyclooxygenase; IRS2: insulin receptor substrate 2; mTOR: mechanistic target of rapamycin kinase; OPA1: optic atrophy factor 1.

Similar articles

Cited by

References

    1. Agostinone J, Alarcon-Martinez L, Gamlin C, Yu WQ, Wong ROL, Di Polo A. Insulin signalling promotes dendrite and synapse regeneration and restores circuit function after axonal injury. Brain. 2018;141:1963–1980. - PMC - PubMed
    1. Al Hussein Al Awamlh S, Wareham LK, Risner ML, Calkins DJ. Insulin signaling as a therapeutic target in glaucomatous neurodegeneration. Int J Mol Sci. 2021;22:4672. - PMC - PubMed
    1. Arnold SE, Arvanitakis Z, Macauley-Rambach SL, Koenig AM, Wang HY, Ahima RS, Craft S, Gandy S, Buettner C, Stoeckel LE, Holtzman DM, Nathan DM. Brain insulin resistance in type 2 diabetes and Alzheimer disease: concepts and conundrums. Nat Rev Neurol. 2018;14:168–181. - PMC - PubMed
    1. Bao YK, Yan Y, Wilson B, Gordon MO, Semenkovich CF, Rajagopal R. Association of retinopathy and insulin resistance: NHANES 2005-2008. Curr Eye Res. 2020;45:173–176. - PMC - PubMed
    1. Barishak YR. Embryology of the eye and its adnexae. Dev Ophthalmol. 1992;24:1–142. - PubMed