

Lack of ownership of mobile phones could hinder the rollout of mHealth interventions in Africa
- PMID: 36255055
- PMCID: PMC9640192
- DOI: 10.7554/eLife.79615
Lack of ownership of mobile phones could hinder the rollout of mHealth interventions in Africa
Abstract
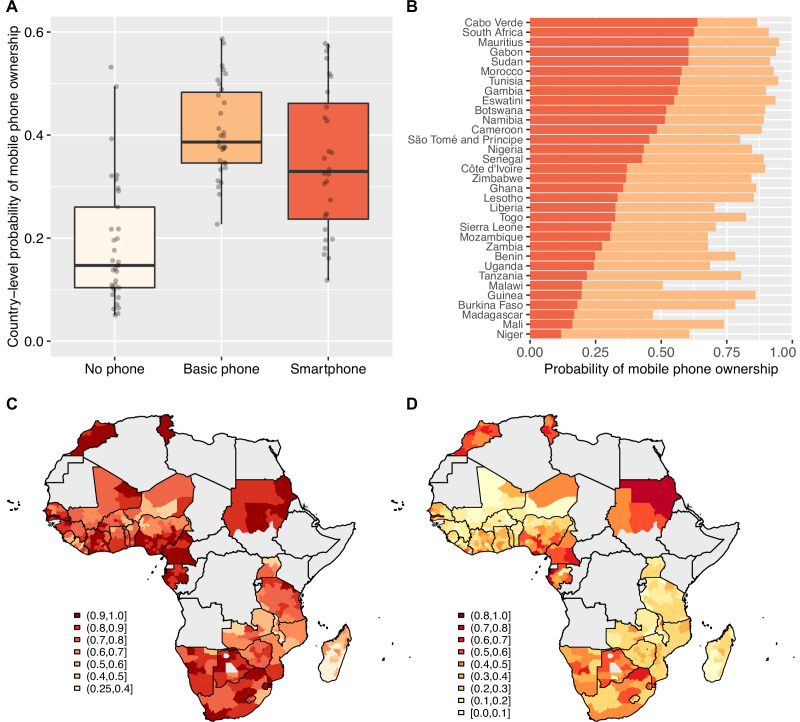
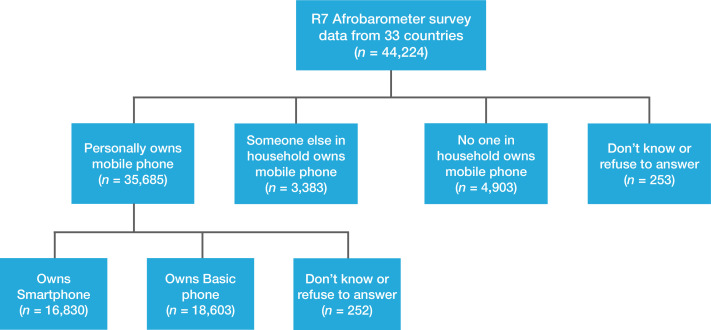
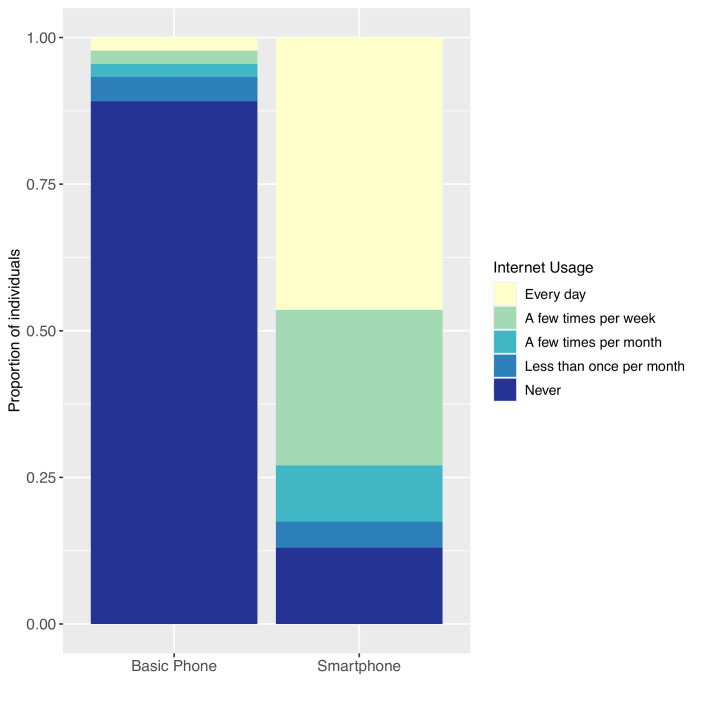
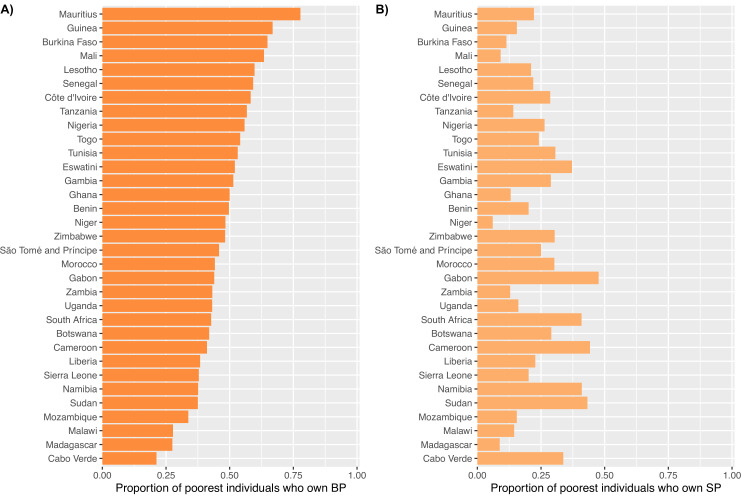
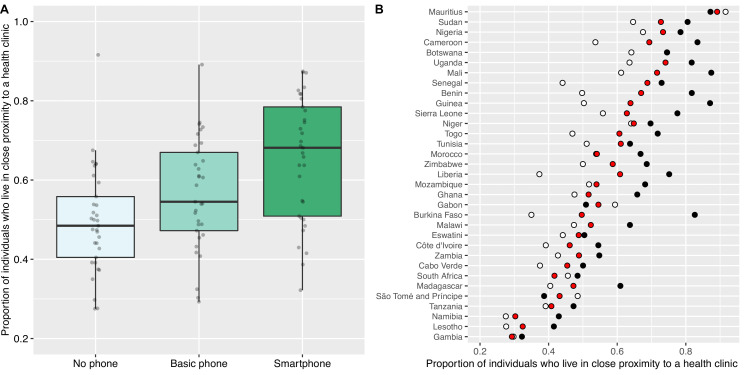
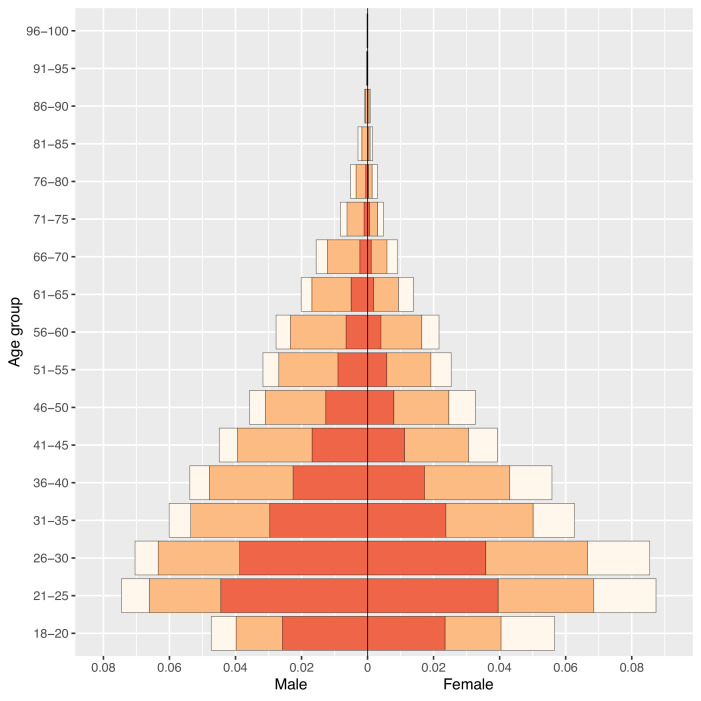
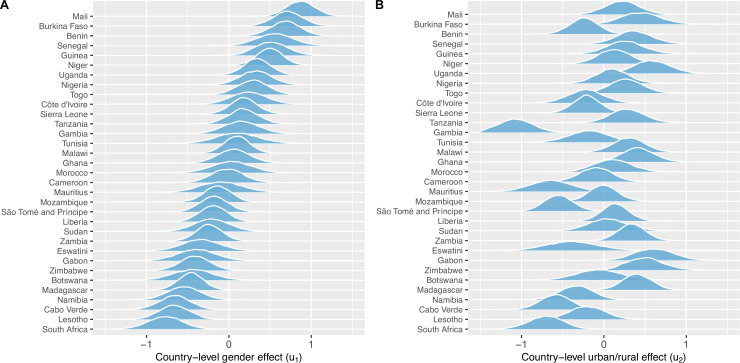
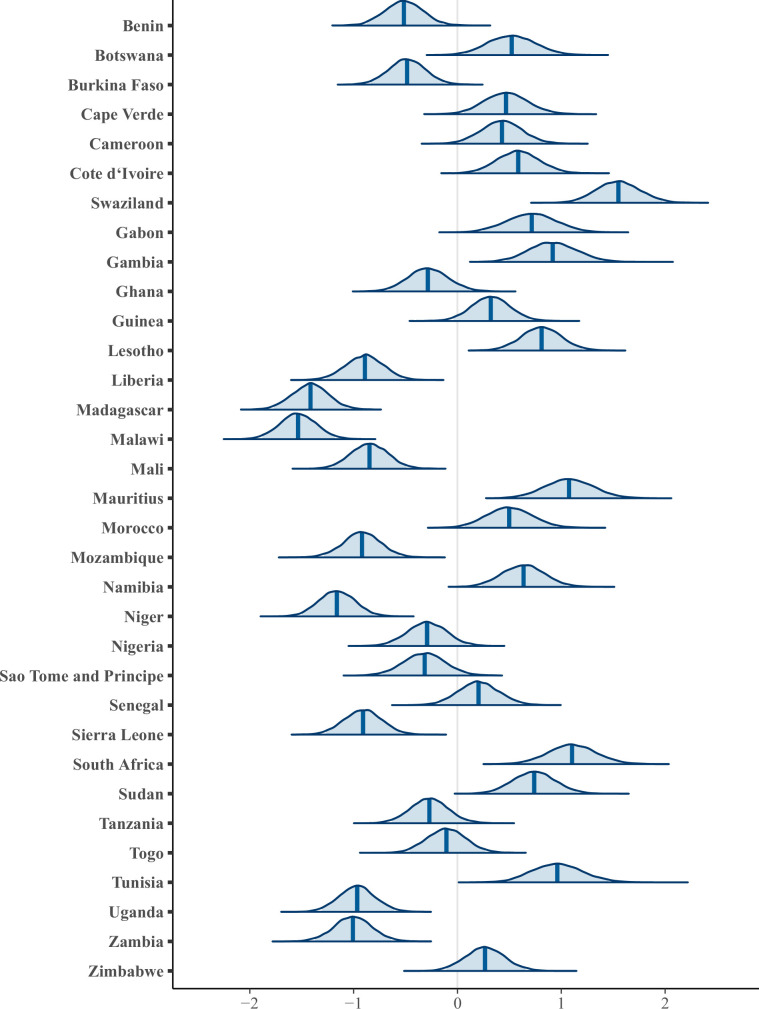
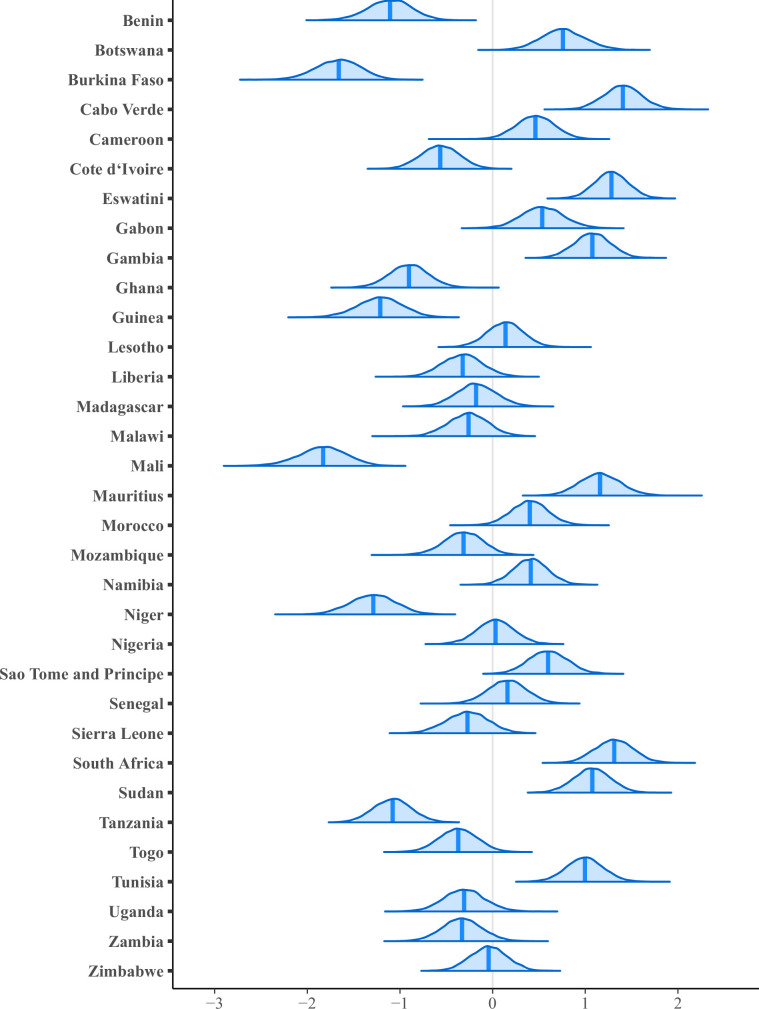
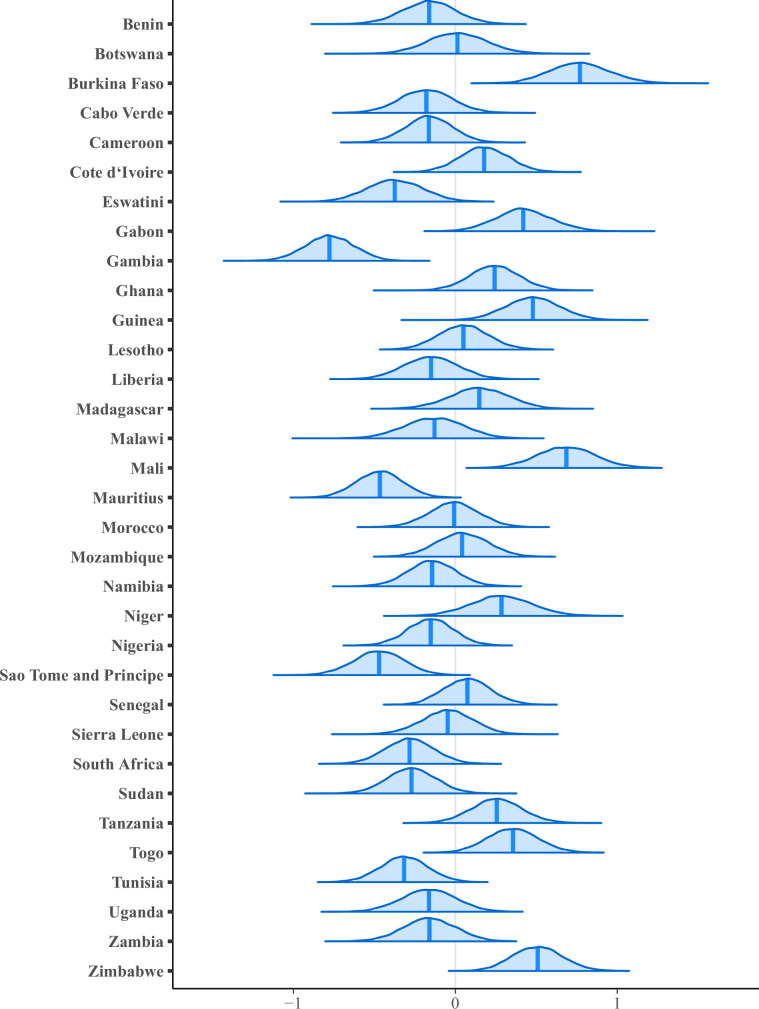
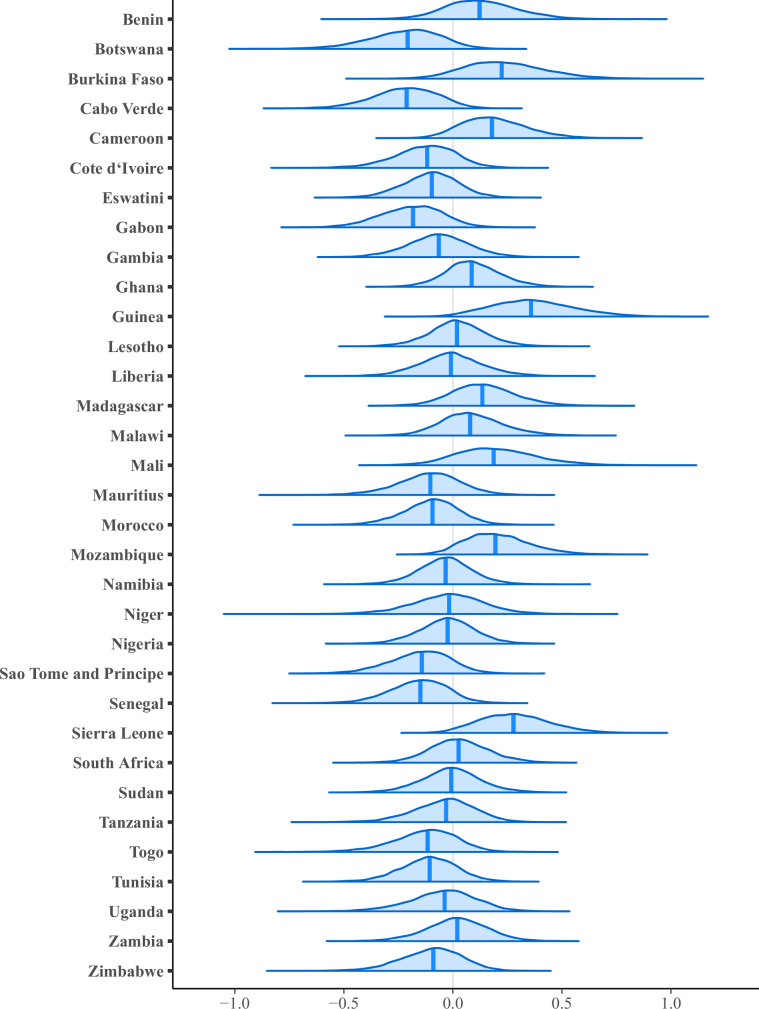
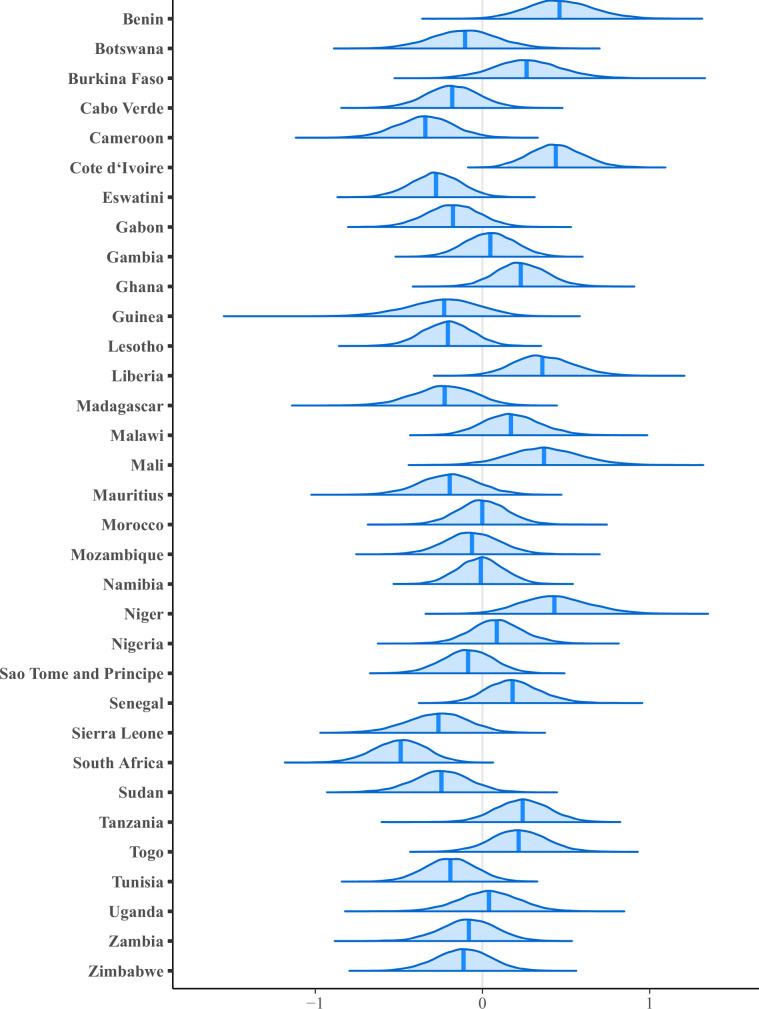
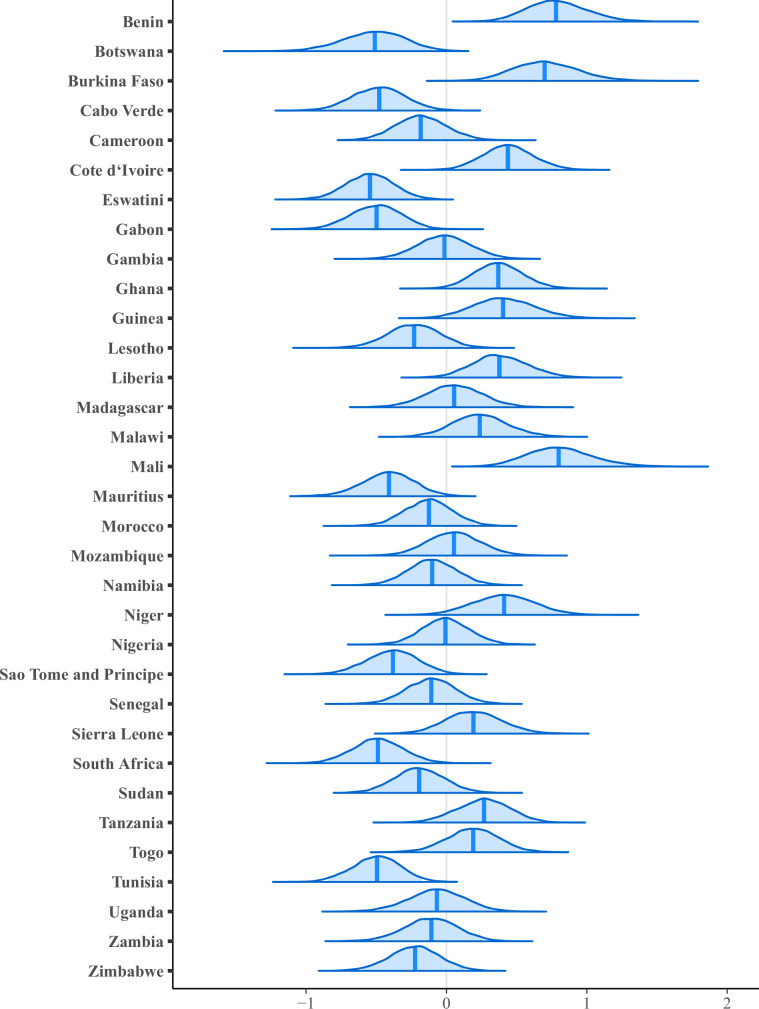
Mobile health (mHealth) interventions, which require ownership of mobile phones, are being investigated throughout Africa. We estimate the percentage of individuals who own mobile phones in 33 African countries, identify a relationship between ownership and proximity to a health clinic (HC), and quantify inequities in ownership. We investigate basic mobile phones (BPs) and smartphones (SPs): SPs can connect to the internet, BPs cannot. We use nationally representative data collected in 2017-2018 from 44,224 individuals in Round 7 of the Afrobarometer surveys. We use Bayesian multilevel logistic regression models for our analyses. We find 82% of individuals in 33 countries own mobile phones: 42% BPs and 40% SPs. Individuals who live close to an HC have higher odds of ownership than those who do not (aOR: 1.31, Bayesian 95% highest posterior density [HPD] region: 1.24-1.39). Men, compared with women, have over twice the odds of ownership (aOR: 2.37, 95% HPD region: 1.96-2.84). Urban residents, compared with rural residents, have almost three times the odds (aOR: 2.66, 95% HPD region: 2.22-3.18) and, amongst mobile phone owners, nearly three times the odds of owning an SP (aOR: 2.67, 95% HPD region: 2.33-3.10). Ownership increases with age, peaks in 26-40 year olds, then decreases. Individuals under 30 are more likely to own an SP than a BP, older individuals more likely to own a BP than an SP. Probability of ownership decreases with the Lived Poverty Index; however, some of the poorest individuals own SPs. If the digital devices needed for mHealth interventions are not equally available within the population (which we have found is the current situation), rolling out mHealth interventions in Africa is likely to propagate already existing inequities in access to healthcare.
Keywords: Africa; epidemiology; global health; human; inequities; mHealth; medicine; mobile phones; smartphones; telemedicine.
Plain language summary
Many healthcare systems in African countries are under-resourced. As a result, people, particularly those living in rural areas, often have to travel large distances to access the medical care they need. Mobile phone-based interventions (also known as mHealth) could make a substantial difference. In Africa, mHealth is already used to diagnose and treat diseases, increase adolescents’ use of sexual and reproductive health services, boost HIV prevention and treatment, and improve maternal and child healthcare. However, using mHealth services requires owning a basic mobile phone or, in some cases, a smartphone that can access the internet. While mobile phone ownership in Africa is increasing rapidly, data on who has them and what types of phones they have are limited. If geographic, income, or gender-based inequities exist, mHealth interventions may not be able to reach those who would benefit the most. To close this knowledge gap, Okano et al. analyzed data on the mobile phone ownership of people living in 33 of the 54 countries in Africa. They used mathematical models and data collected from 44,224 people in Afrobarometer, a continent-wide survey conducted between 2017 and 2018. Okano et al. estimated that 80% of African adults in these 33 countries owned a mobile phone, and half of these devices were smartphones. Although ownership levels varied between the 33 countries, there were substantial inequities that appeared across all of them. More men than women owned a mobile phone. Residents in urban areas and wealthy individuals were also more likely to have a mobile phone than people living in rural areas and poorer individuals, respectively. However, in some countries, the least wealthy were also found to sometimes own smartphones. Okano et al. also found that people living closer to a health clinic were more likely to have a mobile phone than those living further away. Mobile phone ownership was also higher between 26 to 40 year olds, and then decreased with age. In addition, people under 30 were more likely to have a smartphone, whereas older individuals were more likely to own a mobile phone that does not connect to the internet. These findings suggest that there are large inequities in mobile phone ownership. If these are not addressed, rolling out mHealth interventions could worsen existing health disparities in African countries. Efforts need to be made across the continent to expand access to phone devices and reduce substantial internet costs. This will ensure that mHealth interventions benefit everyone across Africa, particularly those who need them most.
© 2022, Okano et al.
Conflict of interest statement
JO, JP, MK, SB No competing interests declared
Figures
Similar articles
-
Smartphone Ownership and Usage Among Pregnant Women Living With HIV in South Africa: Secondary Analysis of CareConekta Trial Data.JMIR Form Res. 2023 Jun 22;7:e43855. doi: 10.2196/43855. JMIR Form Res. 2023. PMID: 37347521 Free PMC article.
-
Mobile Phone Access and Implications for Digital Health Interventions Among Adolescents and Young Adults in Zimbabwe: Cross-Sectional Survey.JMIR Mhealth Uhealth. 2021 Jan 13;9(1):e21244. doi: 10.2196/21244. JMIR Mhealth Uhealth. 2021. PMID: 33439136 Free PMC article.
-
Mobile Device Usage by Gender Among High-Risk HIV Individuals in a Rural, Resource-Limited Setting.Telemed J E Health. 2021 Jun;27(6):615-624. doi: 10.1089/tmj.2020.0218. Epub 2020 Aug 21. Telemed J E Health. 2021. PMID: 32835638 Free PMC article.
-
Does women's mobile phone ownership matter for health? Evidence from 15 countries.BMJ Glob Health. 2020 May;5(5):e002524. doi: 10.1136/bmjgh-2020-002524. BMJ Glob Health. 2020. PMID: 32424014 Free PMC article. Review.
-
Health workers' perceptions and experiences of using mHealth technologies to deliver primary healthcare services: a qualitative evidence synthesis.Cochrane Database Syst Rev. 2020 Mar 26;3(3):CD011942. doi: 10.1002/14651858.CD011942.pub2. Cochrane Database Syst Rev. 2020. PMID: 32216074 Free PMC article.
Cited by
-
Enhancing maternal health in Zambia: a comprehensive approach to addressing postpartum hemorrhage.Front Glob Womens Health. 2024 Aug 6;5:1362894. doi: 10.3389/fgwh.2024.1362894. eCollection 2024. Front Glob Womens Health. 2024. PMID: 39165380 Free PMC article. No abstract available.
-
Smartphone Ownership and Usage Among Pregnant Women Living With HIV in South Africa: Secondary Analysis of CareConekta Trial Data.JMIR Form Res. 2023 Jun 22;7:e43855. doi: 10.2196/43855. JMIR Form Res. 2023. PMID: 37347521 Free PMC article.
-
Impact of a Mobile Money-Based Conditional Cash Transfer Intervention on Health Care Utilization in Southern Madagascar: Mixed-Methods Study.JMIR Mhealth Uhealth. 2025 Mar 3;13:e60811. doi: 10.2196/60811. JMIR Mhealth Uhealth. 2025. PMID: 40029333 Free PMC article.
-
Effect of Clinic-Based and Asynchronous Video-Based Exercise on Clinic and Psychosocial Outcomes in Patients With Knee Osteoarthritis: Quasi-Experimental Study.J Med Internet Res. 2025 Mar 26;27:e58393. doi: 10.2196/58393. J Med Internet Res. 2025. PMID: 40138680 Free PMC article.
-
Beyond Digital Interventions: Human-Centered Design for Adolescents' Type 1 Diabetes Management in LMICs.ICTD. 2024;2024:132-142. doi: 10.1145/3700794.3700808. Epub 2025 Mar 11. ICTD. 2024. PMID: 40401305 Free PMC article.
References
-
- African Union Digital Transformation Strategy for Africa (2020-2030) 2020. [February 24, 2022]. https://au.int/sites/default/files/documents/38507-doc-dts-english.pdf
-
- Afrobarometer Afrobarometer Data, [34 countries], [Round 7], [2016-2018] 2021. [January 12, 2021]. http://www.afrobarometer.org/
-
- Alliance for Affordable Internet From luxury to lifeline: Reducing the cost of mobile devices to reach universal internet access. 2020. [August 9, 2022]. https://a4ai.org/wp-content/uploads/2020/08/Alliance-for-Affordable-Inte...
Publication types
MeSH terms
Grants and funding
LinkOut - more resources
Full Text Sources
Medical
Research Materials
Miscellaneous
