. 2022 Dec 21;10(6):e0146622.
doi: 10.1128/spectrum.01466-22. Epub 2022 Oct 18.

Statistical Evaluation of Metaproteomics and 16S rRNA Amplicon Sequencing Techniques for Study of Gut Microbiota Establishment in Infants with Cystic Fibrosis

Affiliations

Statistical Evaluation of Metaproteomics and 16S rRNA Amplicon Sequencing Techniques for Study of Gut Microbiota Establishment in Infants with Cystic Fibrosis

Claudia Saralegui et al. Microbiol Spectr. .

Abstract

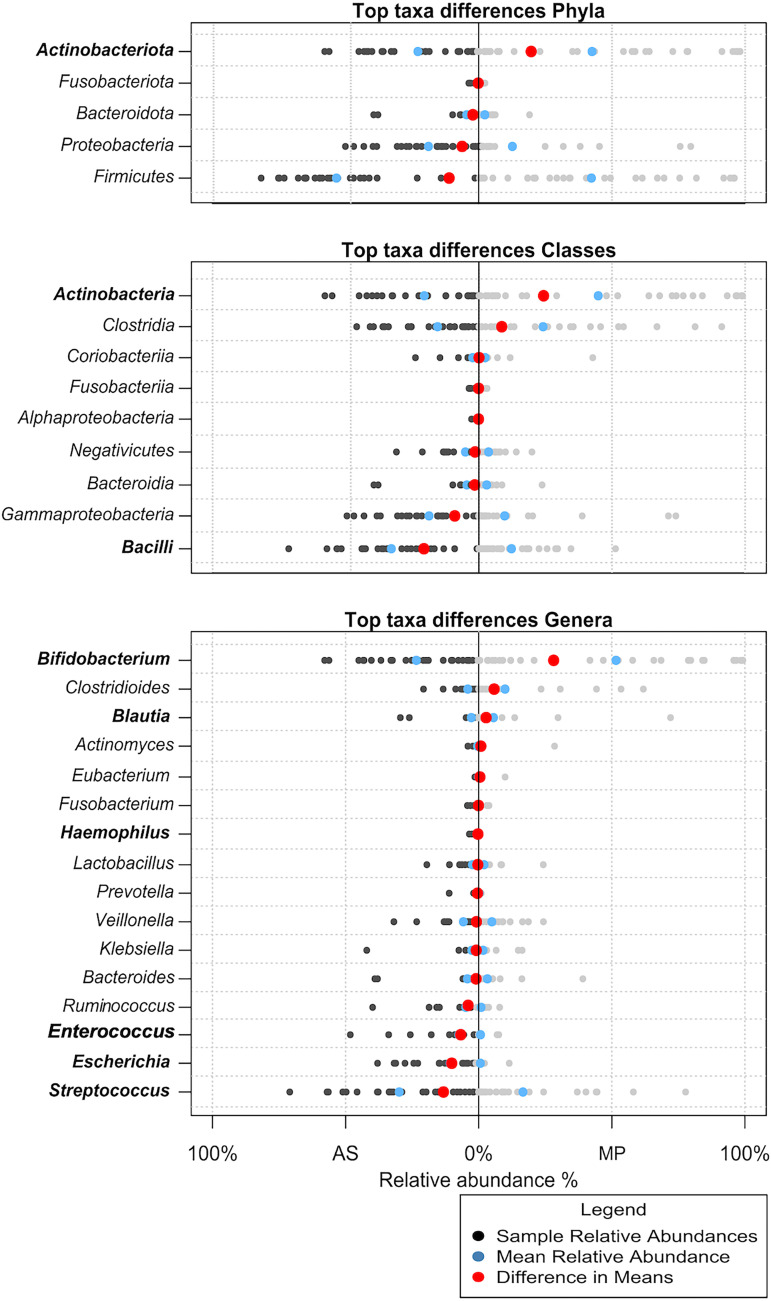
Newborn screening for cystic fibrosis (CF) can identify affected but asymptomatic infants. The selection of omic technique for gut microbiota study is crucial due to both the small amount of feces available and the low microorganism load. Our aims were to compare the agreement between 16S rRNA amplicon sequencing and metaproteomics by a robust statistical analysis, including both presence and abundance of taxa, to describe the sequential establishment of the gut microbiota during the first year of life in a small size sample (8 infants and 28 fecal samples). The taxonomic assignations by the two techniques were similar, whereas certain discrepancies were observed in the abundance detection, mostly the lower predicted relative abundance of Bifidobacterium and the higher predicted relative abundance of certain Firmicutes and Proteobacteria by amplicon sequencing. During the first months of life, the CF gut microbiota is characterized by a significant enrichment of Ruminococcus gnavus, the expression of certain virulent bacterial traits, and the detection of human inflammation-related proteins. Metaproteomics provides information on composition and functionality, as well as data on host-microbiome interactions. Its strength is the identification and quantification of Actinobacteria and certain classes of Firmicutes, but alpha diversity indices are not comparable to those of amplicon sequencing. Both techniques detected an aberrant microbiota in our small cohort of infants with CF during their first year of life, dominated by the enrichment of R. gnavus within a human inflammatory environment. IMPORTANCE In recent years, some techniques have been incorporated for the study of microbial ecosystems, being 16S rRNA gene sequencing being the most widely used. Metaproteomics provides the advantage of identifying the interaction between microorganisms and human cells, but the available databases are less extensive as well as imprecise. Few studies compare the statistical differences between the two techniques to define the composition of an ecosystem. Our work shows that the two methods are comparable in terms of microorganism identification but provide different results in alpha diversity analysis. On the other hand, we have studied newborns with cystic fibrosis, for whom we have described the establishment of an intestinal ecosystem marked by the inflammatory response of the host and the enrichment of Ruminococcus gnavus.

Keywords: Bland-Altman test; Ruminococcus gnavus; amplicon sequencing; cystic fibrosis; gut microbiota establishment; metaproteomics.


Conflict of interest statement

The authors declare a conflict of interest. Rosa del Campo is recipient of a Vertex grant. The remaining authors have no conflict of interest.

Figures

FIG 1
FIG 1
Workflow and main results obtained from the two methodologies used in this study.
FIG 2
FIG 2
Bacterial phyla, classes, and genera uniquely identified by each of the methodologies. AS, amplicon sequencing; MP, metaproteomics. White spaces correspond to taxa correctly identified by both methods.
FIG 3
FIG 3
Relative abundances of the main taxa detected by both methodologies. Taxa in bold are those for which the paired Wilcoxon test result was significant (P < 0.05).
FIG 4
FIG 4
Compositional change of the major genera in each of the methodologies. (A) Evolution of the relative abundance of the main bacterial genera (n = 16). (B) Evolution of bacterial genera with a significant change over time detected by AS (Ruminococcus and Eubacterium) and by MP (Fusobacterium, Haemophilus, and Veillonella). (C) Graphs obtained by the permuspliner function (999 permutations) showing the temporal evolution of relative abundance in those genera with significant differences between the two methodologies. (D) Plots of distances between both methodologies. The difference (solid red line) is not significant if it is not above 95% of the permuted values (translucent gray). (E) Plots obtained by sliding spliner showing the P value at each specified interval (shown with 100 intervals by default). The dotted line indicates a P value of 0.05. At certain intervals, the differences became significant.
FIG 5
FIG 5
Evolution of alpha diversity (measured by Shannon index and richness) detected by one method and the other. The P value was obtained with the trendyspliner spliner function (shown with 100 intervals by default), which evaluates the differences over time for each group of samples, separately.
FIG 6
FIG 6
Functional analysis of bacterial proteins from this cohort, comparing the group of initial and final samples (early CF). (A) Relative intensity of each of the COG functional categories in each group of samples. (B) Correlation between the most enriched functional categories and the bacterial species to which they are assigned. The color gradient indicates higher relative intensity (light green). (C) Proportions of COG functional categories of proteins assigned to R. gnavus. COG category nomenclature: A, RNA processing and modification; B, chromatin structure and dynamics; C, energy production and conversion; D, cell cycle control, cell division, and chromosome partitioning; E, amino acid transport and metabolism; F, nucleotide transport and metabolism; G, carbohydrate transport and metabolism; H, coenzyme transport and metabolism; I, lipid transport and metabolism; J, translation, ribosomal structure, and biogenesis; K, transcription; L, replication, recombination, and repair; M, cell wall/membrane/envelope biogenesis; N, cell motility; O, posttranslational modification, protein turnover, and chaperones; P, inorganic ion transport and metabolism; Q, secondary-metabolite biosynthesis, transport, and catabolism; R, general function prediction only; S, function unknown; T, signal transduction mechanisms; U, intracellular trafficking, secretion, and vesicular transport; V, defense mechanisms; W, extracellular structures; X, mobilome: prophages and transposons; Z, cytoskeleton; NA, not assigned to any category.
FIG 7
FIG 7
Human proteins found interacting with the gut microbiome of the cohort. (A) Group of proteins unique to the initial samples; (B) group of proteins unique to the early-CF samples; (C) proteins shared by both groups.

References

    1. Selma-Royo M, Calatayud Arroyo M, García-Mantrana I, Parra-Llorca A, Escuriet R, Martínez-Costa C, Collado MC. 2020. Perinatal environment shapes microbiota colonization and infant growth: impact on host response and intestinal function. Microbiome 8:167. doi: 10.1186/s40168-020-00940-8. - DOI - PMC - PubMed
    1. Cuthbertson L, Walker AW, Oliver AE, Rogers GB, Rivett DW, Hampton TH, Ashare A, Elborn JS, De Soyza A, Carroll MP, Hoffman LR, Lanyon C, Moskowitz SM, O’Toole GA, Parkhill J, Planet PJ, Teneback CC, Tunney MM, Zuckerman JB, Bruce KD, van der Gast CJ. 2020. Lung function and microbiota diversity in cystic fibrosis. Microbiome 8:45. doi: 10.1186/s40168-020-00810-3. - DOI - PMC - PubMed
    1. Dayama G, Priya S, Niccum DE, Khoruts A, Blekhman R. 2020. Interactions between the gut microbiome and host gene regulation in cystic fibrosis. Genome Med 12:12. doi: 10.1186/s13073-020-0710-2. - DOI - PMC - PubMed
    1. Andrinopoulou ER, Clancy JP, Szczesniak RD. 2020. Multivariate joint modeling to identify markers of growth and lung function decline that predict cystic fibrosis pulmonary exacerbation onset. BMC Pulm Med 20:142. doi: 10.1186/s12890-020-1177-z. - DOI - PMC - PubMed
    1. Burke DG, Fouhy F, Harrison MJ, Rea MC, Cotter PD, O’Sullivan O, Stanton C, Hill C, Shanahan F, Plant BJ, Ross RP. 2017. The altered gut microbiota in adults with cystic fibrosis. BMC Microbiol 17:58. doi: 10.1186/s12866-017-0968-8. - DOI - PMC - PubMed

Publication types

Substances

Supplementary concepts