

Benthic studies adjacent to Sakhalin Island, Russia 2015 III: benthic energy density spatial models in the nearshore gray whale feeding area
- PMID: 36255557
- PMCID: PMC9579071
- DOI: 10.1007/s10661-022-10018-7
Benthic studies adjacent to Sakhalin Island, Russia 2015 III: benthic energy density spatial models in the nearshore gray whale feeding area
Abstract
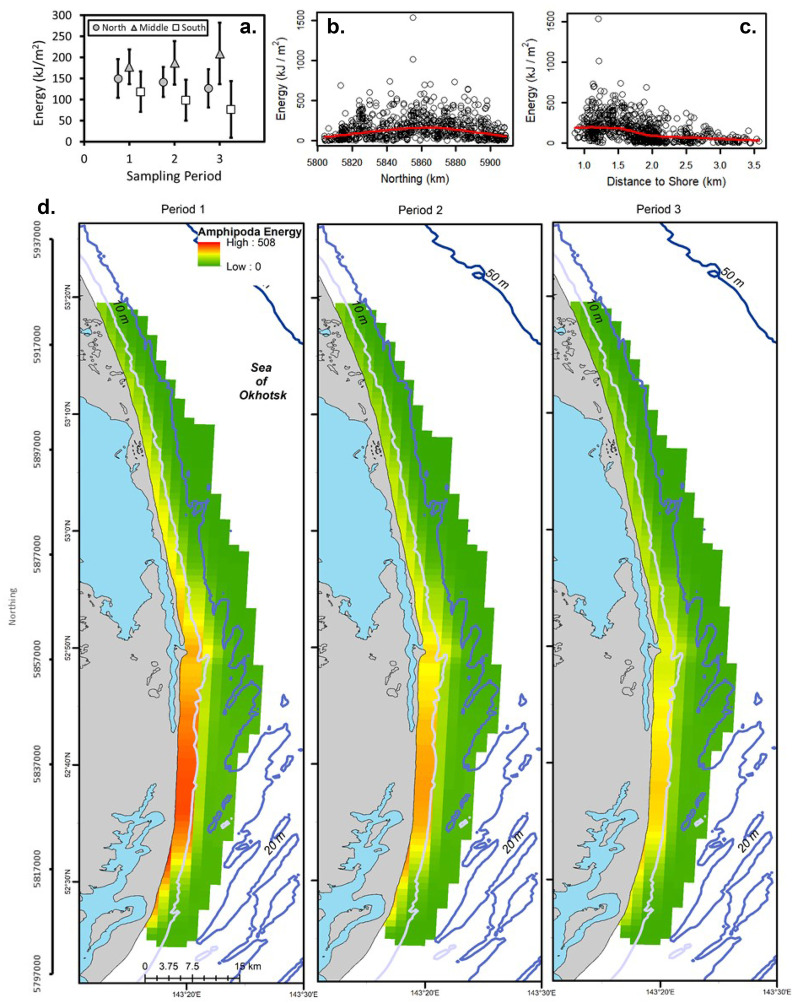
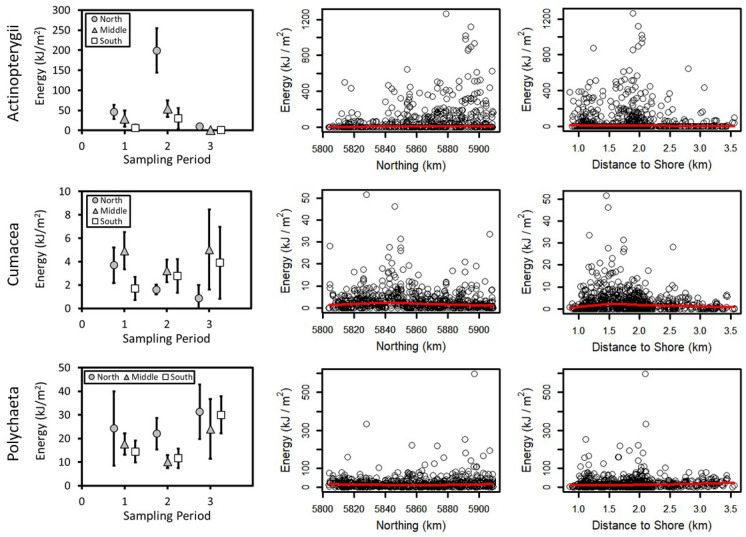
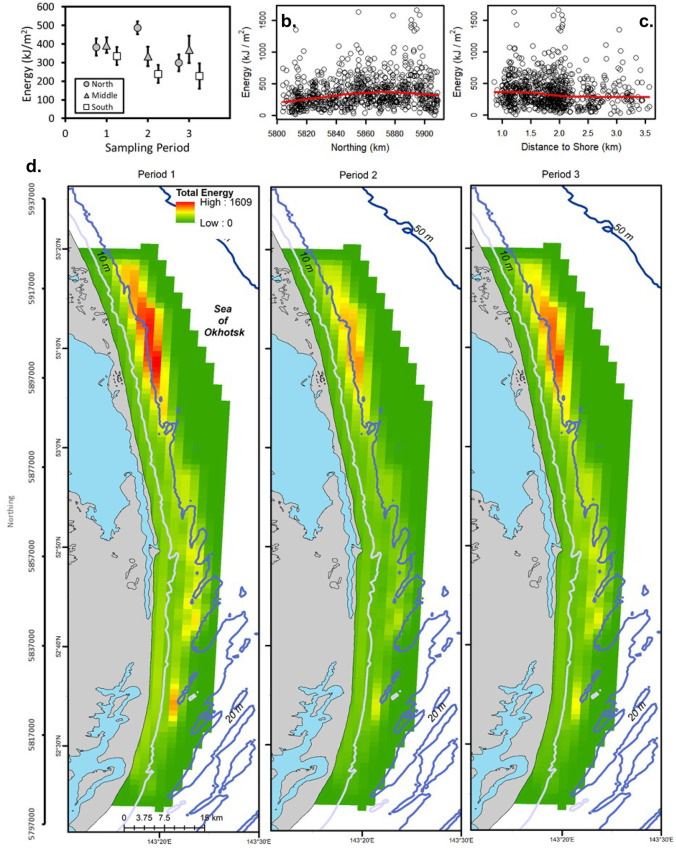
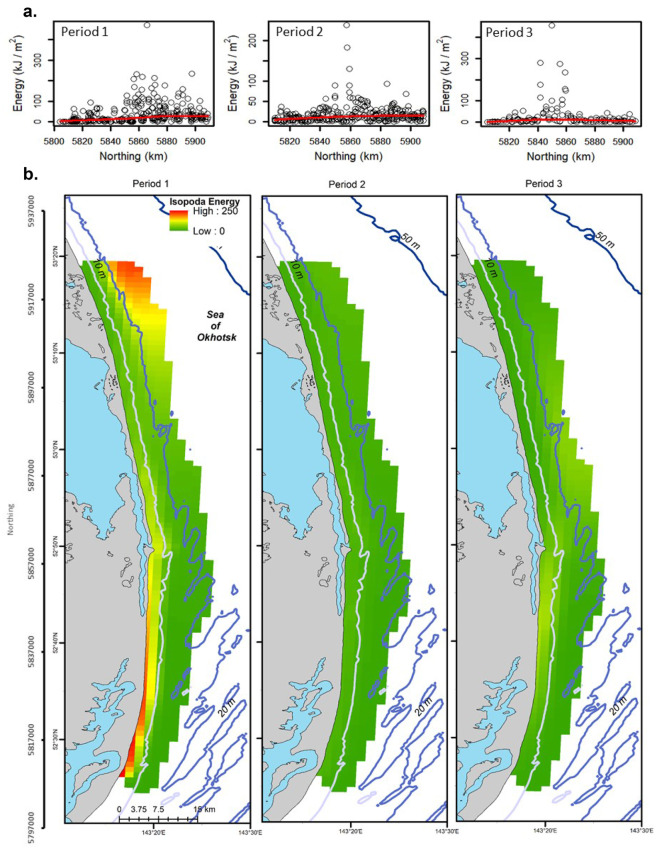
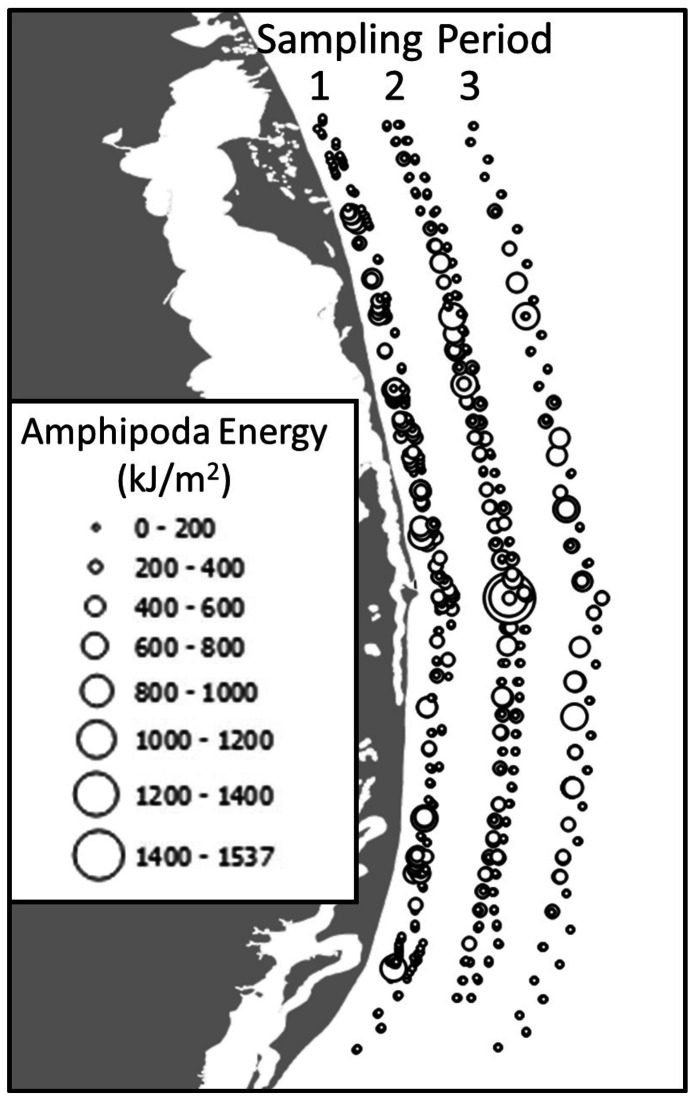
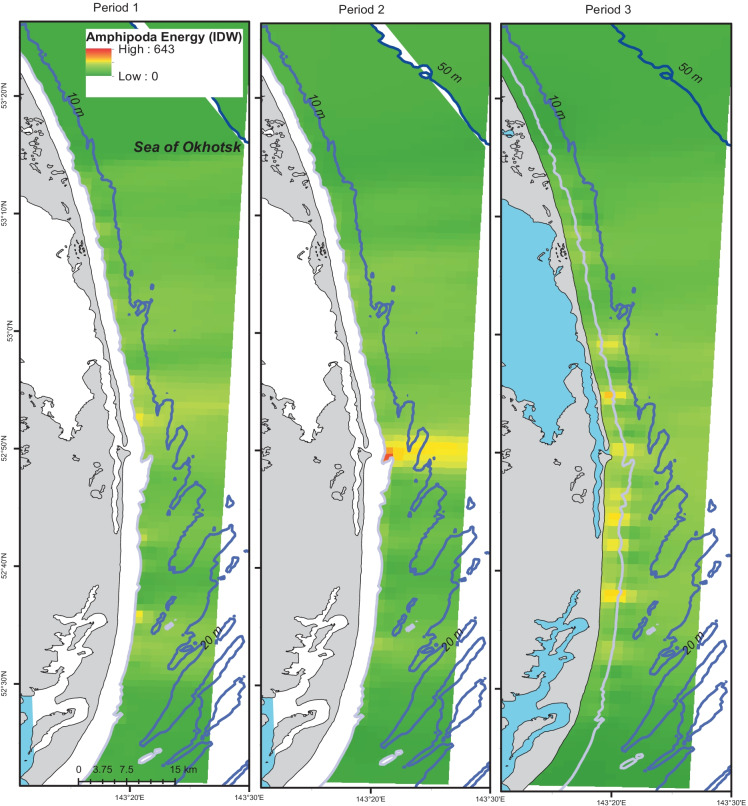
Energy densities of six dominant benthic groups (Actinopterygii, Amphipoda, Bivalvia, Cumacea, Isopoda, and Polychaeta) and total prey energy were modeled for the nearshore western gray whale feeding area, Sakhalin Island, Russia, as part of a multi-disciplinary research program in the summer of 2015. Energy was modeled using generalized additive mixed models (GAMM) with accommodations for zero-inflation (logistic regression and hurdle models) and regression predictions combined with kriging to interpolate energy densities across the nearshore feeding area. Amphipoda energy density was the highest nearshore and in the south whereas Bivalvia energy density was the highest offshore and in the northern portion of the study area. Total energy was the highest in mid-range distances from shore and in the north. Amphipoda energy density was higher than minimum energy estimates defining gray whale feeding habitats (312-442 kJ/m2) in 13% of the nearshore feeding area whereas total prey energy density was higher than the minimum energy requirement in 49% of the habitat. Inverse distance-weighted interpolations of Amphipoda energy provided a broader scale representation of the data whereas kriging estimates were spatially limited but more representative of higher density in the southern portion of the study area. Both methods represented the general trend of higher Amphipoda energy density nearshore but with significant differences that highlight the value of using multiple methods to model patterns in highly complex environments.
Keywords: Benthic ecology; Ecosystem variability; Macrobenthos; Marine ecology; Sea of Okhotsk.
© 2022. The Author(s).
Figures


References
-
- Aerts, L. A. M., Jenkerson, M. R., Nechayuk, V. E., Gailey, G., Racca, R., Blanchard, A. L., Schwarz, L. K., & Melton, H. R. (2022). Seismic surveys near gray whale feeding areas off Sakhalin Island, Russia: Assessing impact and mitigation effectiveness. Environmental Monitoring and Assessment, 194. 10.1007/s10661-022-10016-9 - DOI - PMC - PubMed
-
- Ambrose WG, Jr, Renaud PE. Benthic response to water column productivity patterns: Evidence for benthic-pelagic coupling in the Northeast Water Polynya. Journal of Geophysical Research. 1995;100(C3):4411–4421. doi: 10.1029/94jc01982. - DOI
-
- Armonies W. On the spatial scale needed for benthos community monitoring in the coastal North Sea. Journal of Sea Research. 2000;43(2):121–133. doi: 10.1016/s1385-1101(00)00008-3. - DOI
-
- Bard SM. Global transport of anthropogenic contaminants and the consequences for the Arctic marine ecosystem. Marine Pollution Bulletin. 1999;38(5):356–379. doi: 10.1016/s0025-326x(99)00041-7. - DOI
-
- Barry SC, Welsh AH. Generalized additive modelling and zero inflated count data. Ecological Modelling. 2002;157(2–3):179–188. doi: 10.1016/s0304-3800(02)00194-1. - DOI
MeSH terms
LinkOut - more resources
Full Text Sources
