

Venglustat combined with imiglucerase for neurological disease in adults with Gaucher disease type 3: the LEAP trial
- PMID: 36256599
- PMCID: PMC9924909
- DOI: 10.1093/brain/awac379
Venglustat combined with imiglucerase for neurological disease in adults with Gaucher disease type 3: the LEAP trial
Abstract
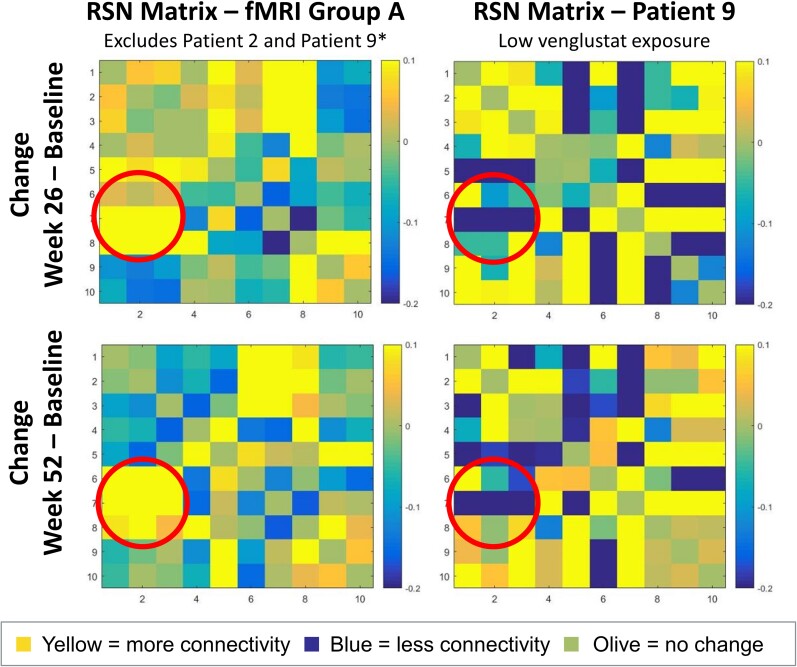
Gaucher disease type 3 is a chronic neuronopathic disorder with wide-ranging effects, including hepatosplenomegaly, anaemia, thrombocytopenia, skeletal disease and diverse neurological manifestations. Biallelic mutations in GBA1 reduce lysosomal acid β-glucosidase activity, and its substrates, glucosylceramide and glucosylsphingosine, accumulate. Enzyme replacement therapy and substrate reduction therapy ameliorate systemic features of Gaucher disease, but no therapies are approved for neurological manifestations. Venglustat is an investigational, brain-penetrant, glucosylceramide synthase inhibitor with potential to improve the disease by rebalancing influx of glucosylceramide with impaired lysosomal recycling. The Phase 2, open-label LEAP trial (NCT02843035) evaluated orally administered venglustat 15 mg once-daily in combination with maintenance dose of imiglucerase enzyme replacement therapy during 1 year of treatment in 11 adults with Gaucher disease type 3. Primary endpoints were venglustat safety and tolerability and change in concentration of glucosylceramide and glucosylsphingosine in CSF from baseline to Weeks 26 and 52. Secondary endpoints included change in plasma concentrations of glucosylceramide and glucosylsphingosine, venglustat pharmacokinetics in plasma and CSF, neurologic function, infiltrative lung disease and systemic disease parameters. Exploratory endpoints included changes in brain volume assessed with volumetric MRI using tensor-based morphometry, and resting functional MRI analysis of regional brain activity and connectivity between resting state networks. Mean (SD) plasma venglustat AUC0-24 on Day 1 was 851 (282) ng•h/ml; Cmax of 58.1 (26.4) ng/ml was achieved at a median tmax 2.00 h. After once-daily venglustat, plasma concentrations (4 h post-dose) were higher compared with Day 1, indicating ∼2-fold accumulation. One participant (Patient 9) had low-to-undetectable venglustat exposure at Weeks 26 and 52. Based on mean plasma and CSF venglustat concentrations (excluding Patient 9), steady state appeared to be reached on or before Week 4. Mean (SD) venglustat concentration at Week 52 was 114 (65.8) ng/ml in plasma and 6.14 (3.44) ng/ml in CSF. After 1 year of treatment, median (inter-quartile range) glucosylceramide decreased 78% (72, 84) in plasma and 81% (77, 83) in CSF; median (inter-quartile range) glucosylsphingosine decreased 56% (41, 60) in plasma and 70% (46, 76) in CSF. Ataxia improved slightly in nine patients: mean (SD, range) total modified Scale for Assessment and Rating of Ataxia score decreased from 2.68 [1.54 (0.0 to 5.5)] at baseline to 1.55 [1.88 (0.0 to 5.0)] at Week 52 [mean change: -1.14 (95% CI: -2.06 to -0.21)]. Whole brain volume increased slightly in patients with venglustat exposure and biomarker reduction in CSF (306.7 ± 4253.3 mm3) and declined markedly in Patient 9 (-13894.8 mm3). Functional MRI indicated stronger connectivity at Weeks 26 and 52 relative to baseline between a broadly distributed set of brain regions in patients with venglustat exposure and biomarker reduction but not Patient 9, although neurocognition, assessed by Vineland II, deteriorated in all domains over time, which illustrates disease progression despite the intervention. There were no deaths, serious adverse events or discontinuations. In adults with Gaucher disease type 3 receiving imiglucerase, addition of once-daily venglustat showed acceptable safety and tolerability and preliminary evidence of clinical stability with intriguing but intrinsically inconsistent signals in selected biomarkers, which need to be validated and confirmed in future research.
Keywords: CNS; Gaucher disease type 3; glycosphingolipids; substrate reduction therapy; venglustat.
© The Author(s) 2022. Published by Oxford University Press on behalf of the Guarantors of Brain.
Figures


References
-
- Grabowski GA, Petsko GA, Kolodny EH, et al. . Gaucher disease. In: Valle DBeaudet AL and Vogelstein B, eds. OMMBID: The online metabolic and molecular bases of inherited disease. McGraw-Hill; 2013. Available at: https://ommbid.mhmedical.com/content.aspx?bookid=2709§ionid=225546056
-
- Vellodi A, Tylki-Szymanska A, Davies EH, et al. . Management of neuronopathic Gaucher disease: Revised recommendations. J Inherit Metab Dis. 2009;32:660–664. - PubMed
-
- Tylki-Szymanska A, Vellodi A, El-Beshlawy A, Cole JA, Kolodny E. Neuronopathic Gaucher disease: Demographic and clinical features of 131 patients enrolled in the International Collaborative Gaucher Group Neurological Outcomes Subregistry. J Inherit Metab Dis. 2010;33:339–346. - PubMed
-
- Grabowski GA, Zimran A, Ida H. Gaucher disease types 1 and 3: Phenotypic characterization of large populations from the ICGG Gaucher Registry. Am J Hematol. 2015;90(Suppl 1):S12–S18. - PubMed
