. 2022 Oct 18;17(10):e0264126.
doi: 10.1371/journal.pone.0264126. eCollection 2022.

A novel approach for modelling and classifying sit-to-stand kinematics using inertial sensors

Affiliations

A novel approach for modelling and classifying sit-to-stand kinematics using inertial sensors

Maitreyee Wairagkar et al. PLoS One. .

Abstract

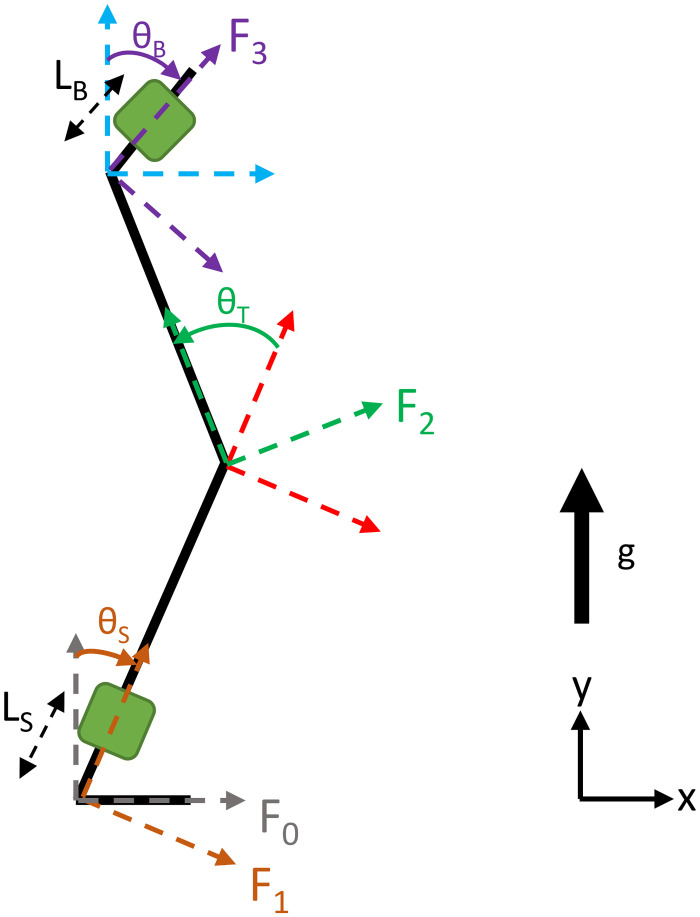
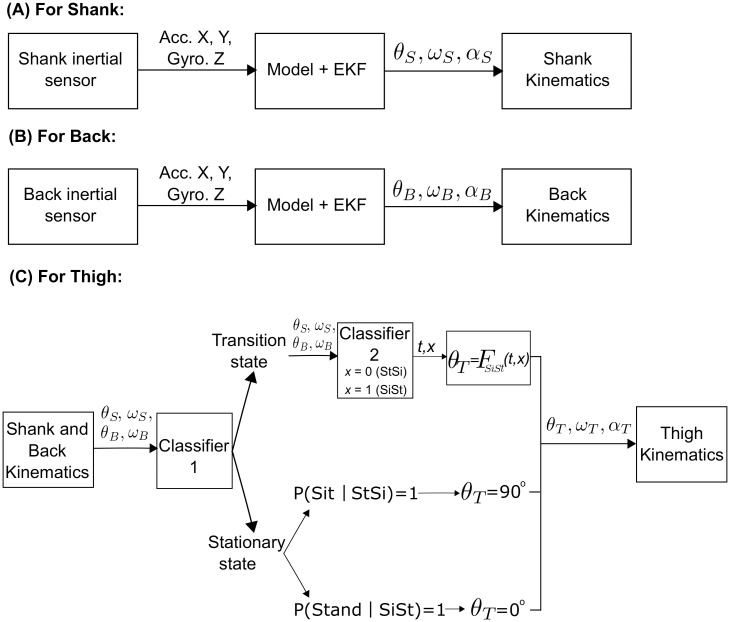
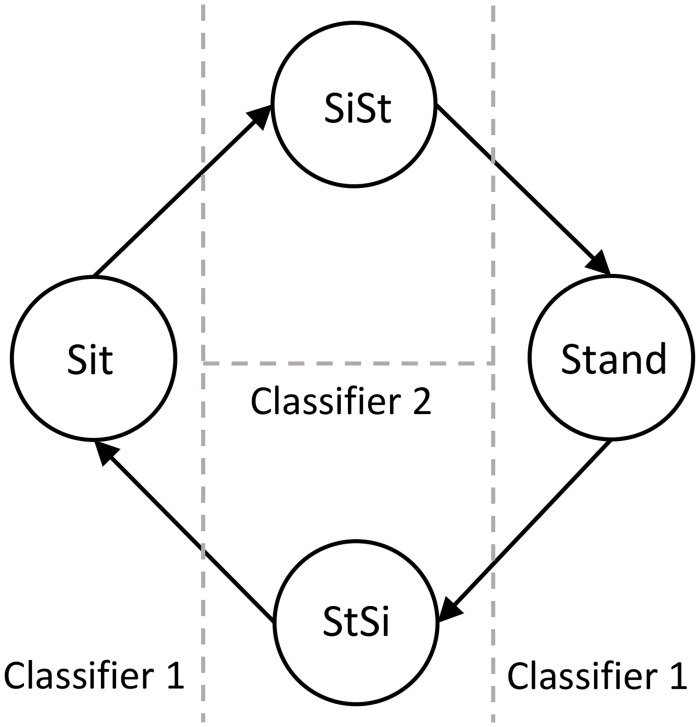
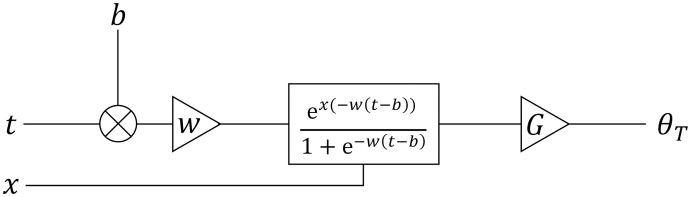
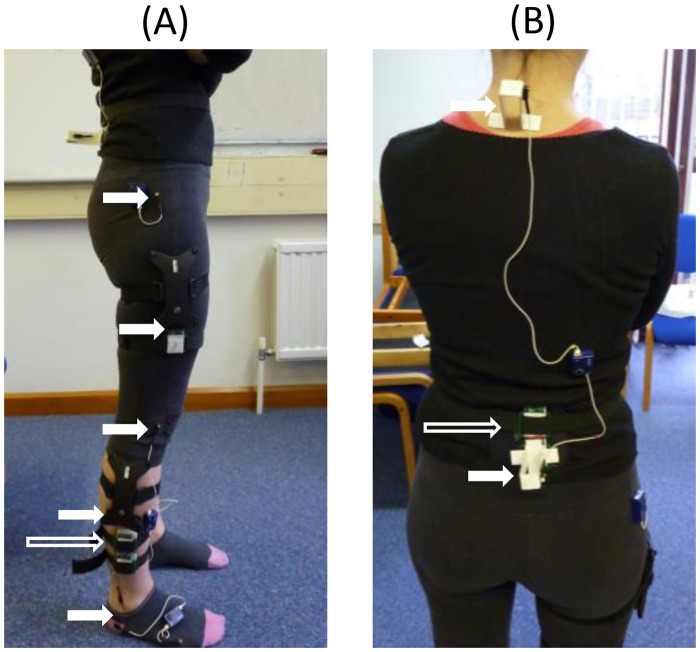
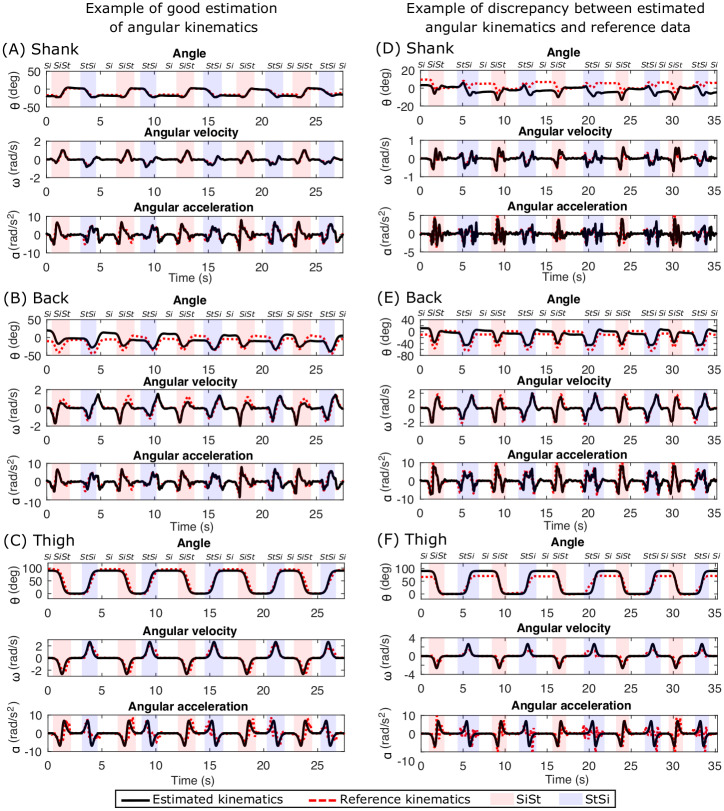
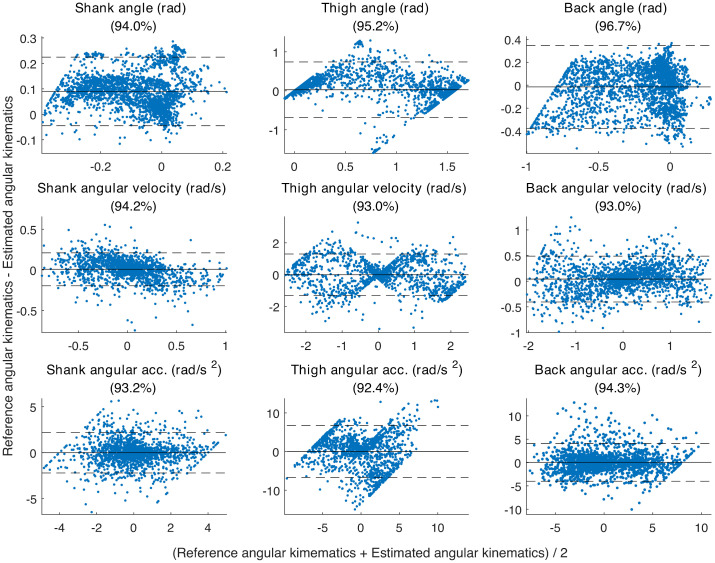
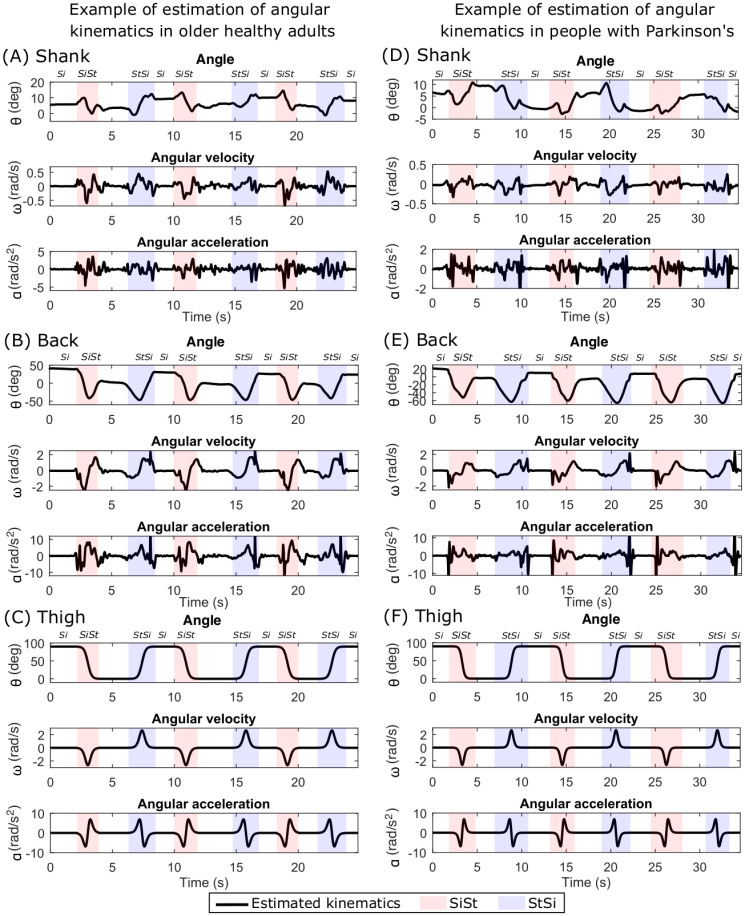
Sit-to-stand transitions are an important part of activities of daily living and play a key role in functional mobility in humans. The sit-to-stand movement is often affected in older adults due to frailty and in patients with motor impairments such as Parkinson's disease leading to falls. Studying kinematics of sit-to-stand transitions can provide insight in assessment, monitoring and developing rehabilitation strategies for the affected populations. We propose a three-segment body model for estimating sit-to-stand kinematics using only two wearable inertial sensors, placed on the shank and back. Reducing the number of sensors to two instead of one per body segment facilitates monitoring and classifying movements over extended periods, making it more comfortable to wear while reducing the power requirements of sensors. We applied this model on 10 younger healthy adults (YH), 12 older healthy adults (OH) and 12 people with Parkinson's disease (PwP). We have achieved this by incorporating unique sit-to-stand classification technique using unsupervised learning in the model based reconstruction of angular kinematics using extended Kalman filter. Our proposed model showed that it was possible to successfully estimate thigh kinematics despite not measuring the thigh motion with inertial sensor. We classified sit-to-stand transitions, sitting and standing states with the accuracies of 98.67%, 94.20% and 91.41% for YH, OH and PwP respectively. We have proposed a novel integrated approach of modelling and classification for estimating the body kinematics during sit-to-stand motion and successfully applied it on YH, OH and PwP groups.


Conflict of interest statement

The authors have declared that no competing interests exist.

Figures

Fig 1
Fig 1. Leg and trunk three-segment 2-dimensional model in the sagittal plane.
θS is the angle for the shank, θT is the angle for the thigh and θB is the angle for the back. Green squares on the shank and back segment represent the inertial sensors. LS and LB denote the distance of the sensor placement on the shank from the ankle and the back from the hip respectively.
Fig 2
Fig 2. Processing steps for estimation of shank, back and thigh kinematics.
(A) Shank kinematics estimation process using the model and EKF. (B) Back kinematics estimation process using the model and EKF. (C) Thigh kinematics estimation process by integrating the results of (A) and (B) and two-tiered classification scheme to segment and identify sit-to-stand (SiSt), stand-to-sit (StSi), sitting and standing states.
Fig 3
Fig 3. Classification scheme for sit, stand, sit-to-stand and stand-to-sit.
State diagram representing the classification scheme for sit, stand, sit-to-stand and stand-to-sit. The vertical dashed line represents the threshold for the Classifier 1 to classify the stationary state and the transition state. The horizontal dashed line represents the classification boundary for Classifier 2 to classify the transition state into sit-to-stand and stand-to-sit.
Fig 4
Fig 4. Model to estimate thigh angle.
A model based on an artificial neuron with a sigmoid activation function to estimate stand-to-sit thigh angle where, t is the input time segment of stand-to-sit transition, weight w determines the speed of transition, bias b determines the centre of transition, x is classifier 2 output where x = 0 for stand-to-sit and x = 1 for sit-to-stand transition, gain G scales the output of activation function between 0° and 90° and the thigh angle θT is the output.
Fig 5
Fig 5. Full inertial wearable sensors and Codamotion marker setup.
(A) Shank and thigh inertial sensors and Codamotion markers positions (B) Back inertial sensor and Codamotion marker positions. The long hollow arrows show the position of the inertial sensors placed on the shank and back. The solid short arrows show the position of Codamotion markers on the leg and the back.
Fig 6
Fig 6. Comparison of estimated kinematics with Codamotion reference kinematics in young healthy participants.
An example of good angular kinematics estimation (left column) is shown for (A) Shank, (B) Back and (C) Thigh. The segmentation of sit-to-stand, stand-to-sit, sit and stand (no label on the top) is also shown with different background colours and labels at the top. An example of discrepancies between estimated kinematics and reference kinematics from Codamotion data (right column) is shown for (D) Shank, (E) Back and (F) Thigh.
Fig 7
Fig 7. Bland-Altman plots.
The Bland-Altman plots showing comparison between the reference Codamotion angular kinematics and estimated angular kinematics using the proposed integrated approach of modelling and classification for the shank, thigh and back. The x-axis shows the mean of the two measures and the y-axis shows the difference between the two measures. The solid horizontal represents the mean difference between the reference and estimated kinematics and the dotted horizontal lines show the ±2 standard deviation boundaries. A Bland-Altman plot typically looks for points to be within ±2 standard deviations of the mean difference, the title of each sub-figure has this as percentage.
Fig 8
Fig 8. Estimated angular kinematics in older healthy adults (OH) and people with Parkinson’s (PwP).
An example of estimated angular kinematics in OH participants (left column) is shown for (A) Shank, (B) Back and (C) Thigh. The segmentation of sit-to-stand, stand-to-sit, sit and stand (no label on the top) is also shown with different background colours and labels at the top. An example of estimated angular kinematics in PwP participants (right column) is shown for (D) Shank, (E) Back, and (F) Thigh.
Fig 9
Fig 9. Timings of sit-to-stand and stand-to-sit in younger healthy (YH) adults, older healthy (OH) adults and people with Parkinsons (PwP).
The time taken by participants to perform sit-to-stand and stand-to-sit from all the three YH, OH and PwP groups. The black triangle shows the mean time. Statistically significant differences (Mann-Whitney U test with Bonferroni correction for multiple tests) in the timings among the three groups for sit-to-stand and stand-to-sit are shown by the stars indicting the p-values (one star indicates p < 0.5, two stars indicate p < 0.01 and three stars indicate p < 0.001).
Fig 10
Fig 10. Variability in the posture during sitting and standing in the shank and back in younger healthy (YH) adults, older healthy (OH) adults and people with Parkinson’s (PwP).
(A) The average angles of the shank and back in YH, OH and PwP participants during sitting. The black triangle shows the mean angle. (B) The average angles of the shank and back in YH, OH and PwP participants during standing. Statistically significant differences (Mann-Whitney U test with Bonferroni correction for multiple tests) in the angles of the shank and back among the three groups during sitting and standing are shown by the stars indicting the p-values (one star indicates p < 0.5, two stars indicate p < 0.01 and three stars indicate p < 0.001).
Fig 11
Fig 11. Grand average shank and back velocity and angles during sit-to-stand and stand-to-sit in younger healthy (YH) adults, older healthy (OH) adults and people with Parkinson’s (PwP).
(A) Grand average shank velocities in the three participant groups during sit-to-stand. (B) Shank velocities during stand-to-sit. (C) Back velocities during sit-to-stand. (D) Back velocities during stand-to-sit. (E) Shank angles during sit-to-stand. (F) Shank angles during stand-to-sit. (G) Back angles during sit-to-stand. (H) Back angles during stand-to-sit.

References

    1. Yang CCC, Hsu YLL. A review of accelerometry-based wearable motion detectors for physical activity monitoring; 2010. Available from: http://www.mdpi.com/1424-8220/10/8/7772. - PMC - PubMed
    1. Fong D, Chan YY, Fong DTP, Chan YY. The Use of Wearable Inertial Motion Sensors in Human Lower Limb Biomechanics Studies: A Systematic Review. Sensors. 2010;10(12):11556–11565. doi: 10.3390/s101211556 - DOI - PMC - PubMed
    1. Janssen WG, Bussmann HB, Stam HJ. Determinants of the Sit-to-Stand Movement: A Review. Physical Therapy. 2002;82(9):866–879. doi: 10.1093/ptj/82.9.866 - DOI - PubMed
    1. Guarrera-Bowlby PL, Gentile AM. Form and Variability During Sit-to-Stand Transitions: Children Versus Adults. Journal of Motor Behavior. 2004;36(1):104–114. doi: 10.3200/JMBR.36.1.104-114 - DOI - PubMed
    1. Van Lummel RC, Ainsworth E, Lindemann U, Zijlstra W, Chiari L, Van Campen P, et al.. Automated approach for quantifying the repeated sit-to-stand using one body fixed sensor in young and older adults. Gait & Posture. 2013;38(1):153–156. doi: 10.1016/j.gaitpost.2012.10.008 - DOI - PubMed

Publication types