. 2022 Dec 5;154(12):e202213098.
doi: 10.1085/jgp.202213098. Epub 2022 Oct 18.

Lack of evidence for participation of TMEM150C in sensory mechanotransduction

Affiliations

Lack of evidence for participation of TMEM150C in sensory mechanotransduction

Julia Ojeda-Alonso et al. J Gen Physiol. .

Abstract

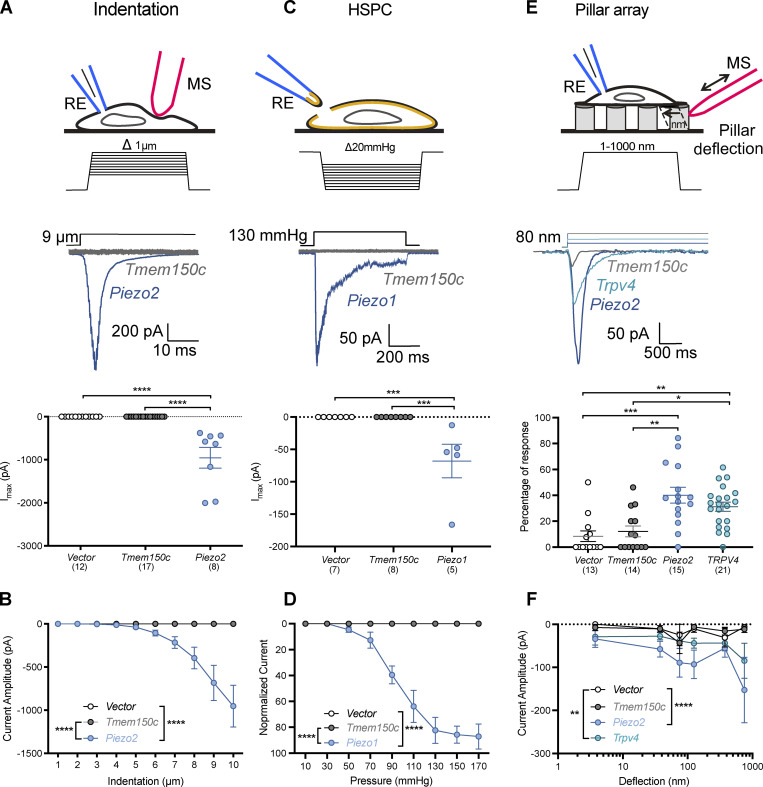
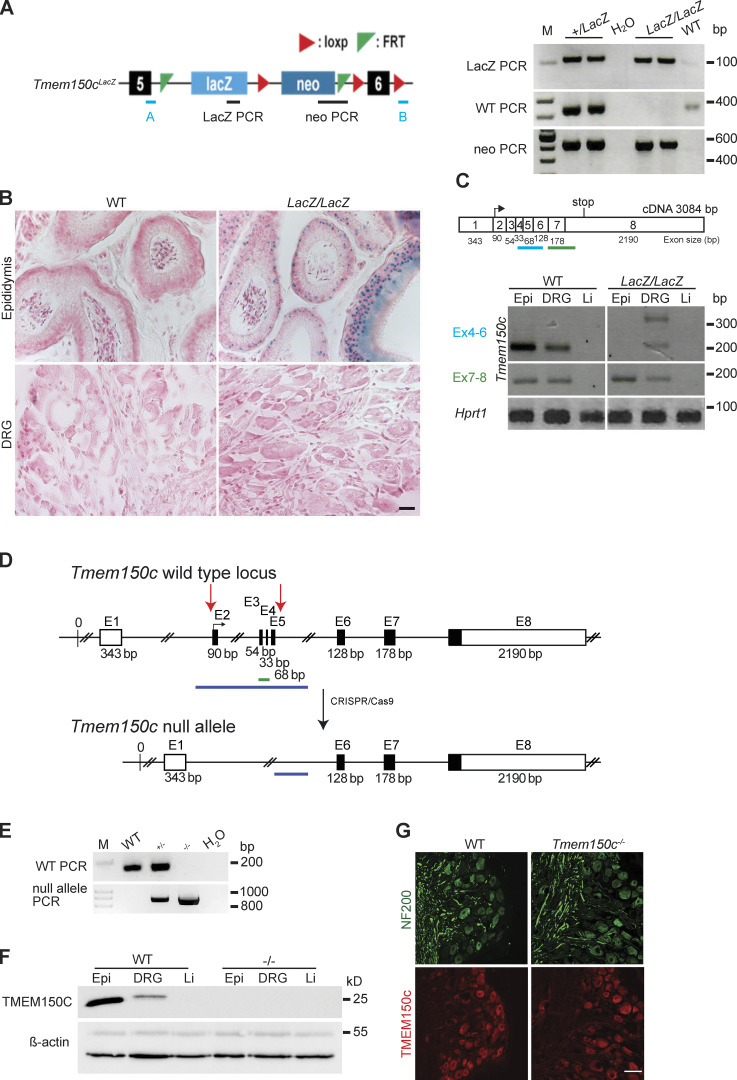
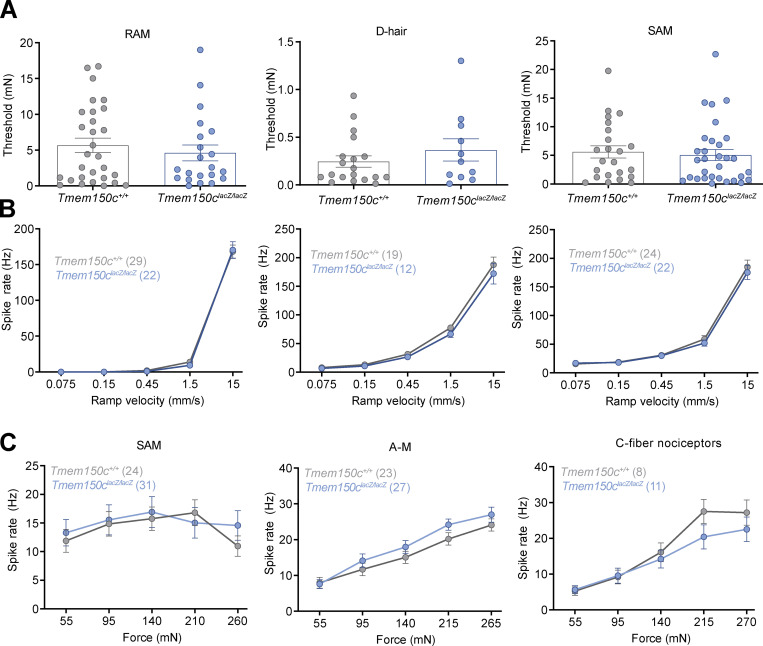
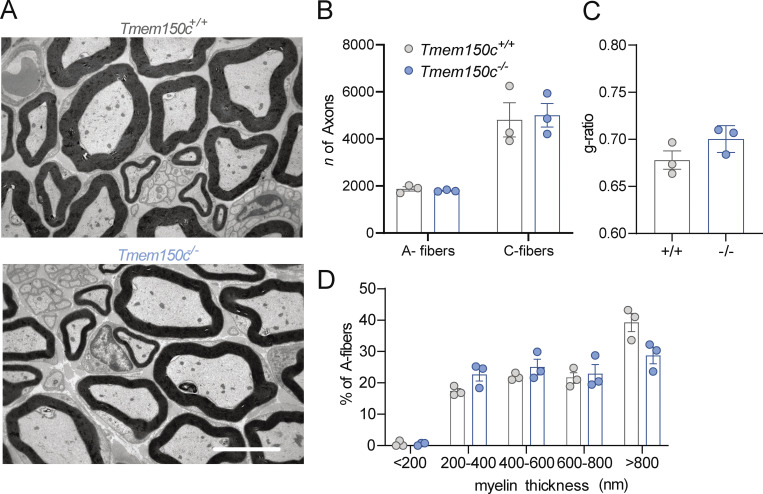
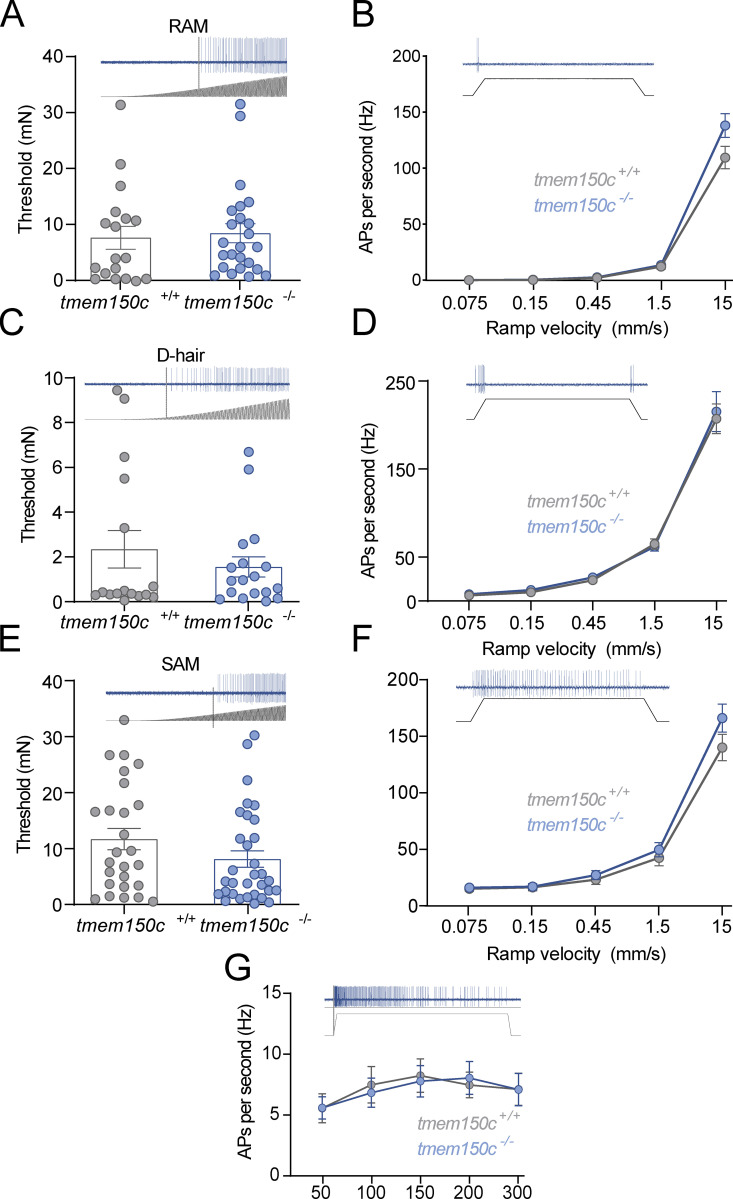
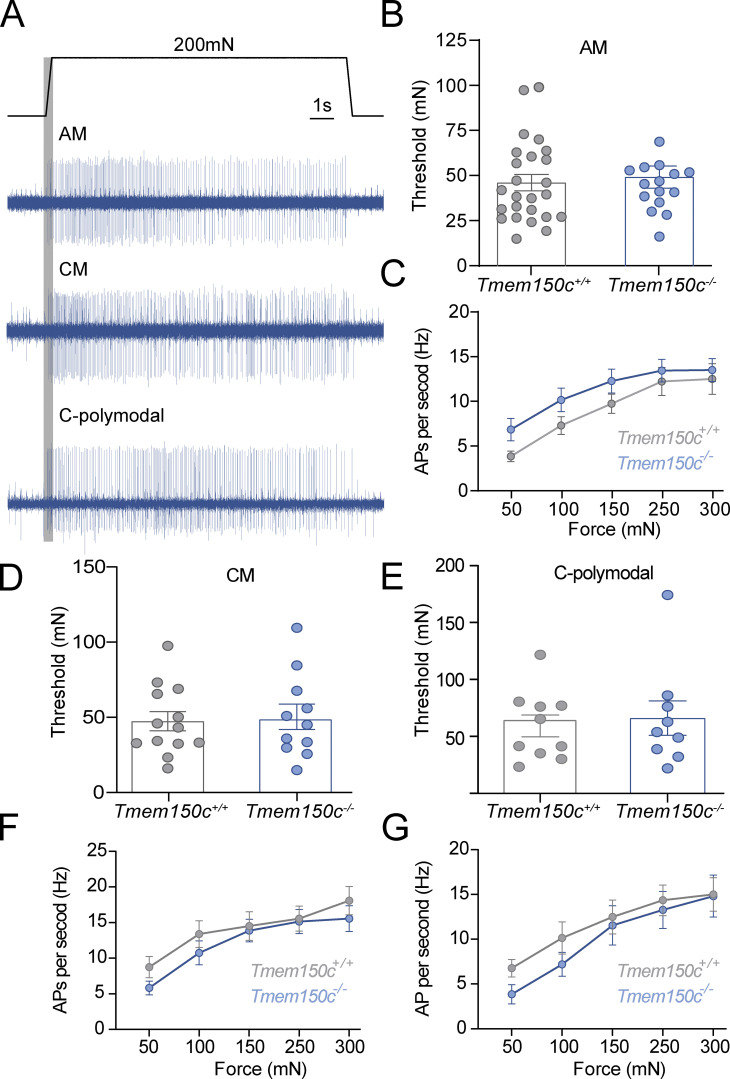
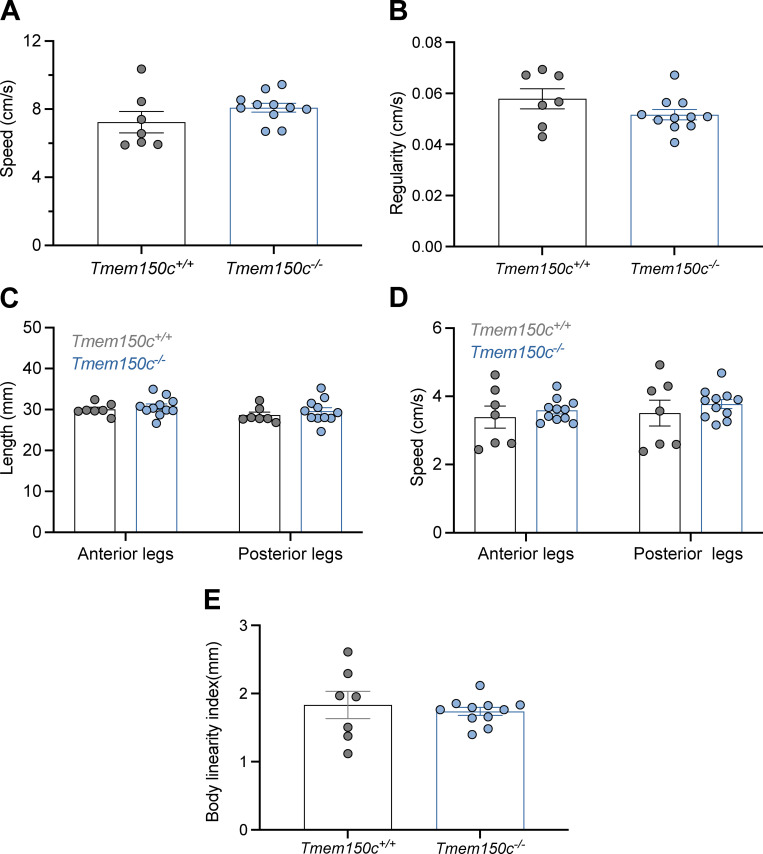
The membrane protein TMEM150C has been proposed to form a mechanosensitive ion channel that is required for normal proprioceptor function. Here, we examined whether expression of TMEM150C in neuroblastoma cells lacking Piezo1 is associated with the appearance of mechanosensitive currents. Using three different modes of mechanical stimuli, indentation, membrane stretch, and substrate deflection, we could not evoke mechanosensitive currents in cells expressing TMEM150C. We next asked if TMEM150C is necessary for the normal mechanosensitivity of cutaneous sensory neurons. We used an available mouse model in which the Tmem150c locus was disrupted through the insertion of a LacZ cassette with a splice acceptor that should lead to transcript truncation. Analysis of these mice indicated that ablation of the Tmem150c gene was not complete in sensory neurons of the dorsal root ganglia (DRG). Using a CRISPR/Cas9 strategy, we made a second mouse model in which a large part of the Tmem150c gene was deleted and established that these Tmem150c-/- mice completely lack TMEM150C protein in the DRGs. We used an ex vivo skin nerve preparation to characterize the mechanosenstivity of mechanoreceptors and nociceptors in the glabrous skin of the Tmem150c-/- mice. We found no quantitative alterations in the physiological properties of any type of cutaneous sensory fiber in Tmem150c-/- mice. Since it has been claimed that TMEM150C is required for normal proprioceptor function, we made a quantitative analysis of locomotion in Tmem150c-/- mice. Here again, we found no indication that there was altered gait in Tmem150c-/- mice compared to wild-type controls. In summary, we conclude that existing mouse models that have been used to investigate TMEM150C function in vivo are problematic. Furthermore, we could find no evidence that TMEM150C forms a mechanosensitive channel or that it is necessary for the normal mechanosensitivity of cutaneous sensory neurons.


Figures

Figure 1.
Figure 1.
Overexpression of TMEM150C in N2APiezo1−/− cells does not evoke mechanosensitive currents. (A−C, and E) Top: Cartoons of the different mechanical stimuli applied in this study together with representative traces from mechanosensitive currents evoked using indentation (A), HSPC (C), or pillar arrays (E) methods. Piezo and Trpv4 were used as positive controls. Cells overexpressing Tmem150c did not display mechanosensitive currents in any of the assays that differed from cells transfected with the empty expression vector. RE, recording electrode; MS, mechanical stimulator. A, C, and E quantified for all stimulus strengths in B, D, and F. (A and B) Scatter plots showing the maximal peak (Imax) from mechanosensitive currents observed in N2aPiezo1−/− cells transfected with vector, Tmem150c or Piezo2. No mechanosensitive currents were observed for N2APiezo1−/− transfected with Tmem150c (Kruskal–Wallis test, Tmem150c vs. vector P > 0.9999; Piezo2 vs. vector, P < 0.0001; Piezo2 vs. Tmem150c P < 0.0001) with indentation (A and B) or HSPC (C and D); Kruskal–Wallis test, Tmem150c vs. vector P > 0.9999; Piezo1 vs. vector P = 0.0003; Piezo1 vs. Tmem150c P = 0.0002. (E) N2APiezo1−/− cells transfected with vector controls occasionally displayed a pillar induced mechanosensitive current, but the frequency of such currents was not higher in cells expressing Tmem150c. In contrast, almost all cells overexpressing either Piezo2 or Trpv4 showed large and robust mechanosensitive currents to pillar deflection, Kruskal–Wallis test, Tmem150c vs. vector P > 0.9999; vector vs. Piezo2 P = 0.0007; vector vs. Trpv4 P = 0.003; Tmem150c vs. Piezo2 P = 0.002; Tmem150c vs. Trpv4 P = 0.01. (E and F) Current kinetics observed in N2APiezo1−/− overexpressing a vector, Tmem150c or Piezo2 channels. Left: Indentation–current amplitude relationship (A) showing that Tmem150c is indentation-insensitive. Two-way ANOVA, Piezo2 vs. vector, P < 0.0001; Piezo2 vs. Tmem150c P < 0.0001. (C and D) Overexpression of Tmem150c was not associated with the pressure activated currents in membrane patches subjected to pressure pulses. Two-way ANOVA, Piezo2 vs. vector, P < 0.0001; Piezo2 vs. Tmem150c P < 0.0001. Current amplitude–deflection relationship (I) for currents recorded in cells expressing Tmem150c, Piezo2, or Trpv4. (F) Cells expressing Tmem150c exhibited similar amplitude–deflection currents as cells transfected with the empty vector. Two-way ANOVA, Tmem150c vs. vector P > 0.9999; vector vs. Piezo2 P = 0.0003; vector vs. Trpv4 P = 0.0136. *P ≤ 0.05, **P > 0.01, ***P < 0.001, ****P < 0.0001.
Figure 2.
Figure 2.
Generation and characterization of Tmem150c mouse models. (A) Left: Schematic representation of Tmem150c locus of the knockout first mouse (Ttn3LacZ), named here Tmem150cLacZ, generated by the trans-National Institutes of Health Mouse initiative knockout Mouse project (https://www.komp.org) containing a LacZ cassette and a neomycin cassette with a stop codon inserted between exons 5 and 6 and resulting in a frame shift. Right: Representative gels showing PCR results for neomycin cassette, LacZ cassette, and WT bands. A and B primers (in blue) used for the amplification of the WT band. Genomic DNA from ear biopsies from WT, heterozygous, and homozygous mice were analyzed. M: DNA marker. (B) β-galactosidase staining (blue) of epididymis (positive tissue control) and DRG of Tmem150cLacZ/LacZ mice. Note the unexpected lack of staining in the DRGs of Tmem150cLacz/LacZ mice. WT tissues used as negative control. Scale bar = 20 μm. (C) Top: Schematic representation of Tmem150c cDNA (source ensemble Tmem150c-201) containing 8 exons (1–8) with the start codon located in exon 2 (2) and the stop codon located in exon 8 (8). Bottom: RT-PCR performed on cDNA prepared from tissues of WT mice and Tmem150cLacz/LacZ mice with the blue line indicating amplicon covering exon 4–6 (the targeted area of Tmem150cLacZ allele) and the green line indicating amplicon covering the end of exon 6 to the beginning of exon 8. Note the presence of unexpected bands in DRG of the Tmem150cLacz/LacZ mice but the absence of bands in Epi and Li as expected. Hprt1 (housekeeping gene) is used as positive control for all tissues. Epi, epididymis (positive control); Li, liver (negative control). (D) Schematic representation of Tmem150c null allele generation using CRISPR/Cas9 technology: deletion of nucleotide sequence between the end of intron 1–2 and the beginning of intron 5–6. WT allele and null allele are shown: exon1 (E1) encodes the 5′ UTR and E8 the 3′ UTR (white box). Black box: coding sequence. (source ensemble ENSMUSG0000005064017). Red arrows indicate the location of gRNA sequences used for CRISPR/Cas9. (E) PCR performed on genomic DNA from ear biopsies from WT, heterozygous, and homozygous mice are shown. The WT amplicon is represented by the green line in the scheme covering E3 and E4 (179 bp). The null allele amplicon is represented by the blue line producing an 886 bp fragment when the nucleotide sequence between intron 1–2 and intron 5–6 (3,039 bp in WT) is deleted as in the null allele. Note that this PCR fragment could amplify a 3,039 bp fragment in WT mice (see blue line), but this is not possible using the chosen PCR conditions. M: DNA marker. (F) TMEM150C protein expression using Western blot showing absence of TMEM150C protein in tissues from Tmem150c−/− mice. Epididymis (Epi, positive control) and liver (Li, negative control). β-actin was used as loading control. (G) Immunostaining performed on DRGs from WT and Tmem150c−/− mice using an antibody directed against the C-terminal part of TMEM150C (same as in F). Note that TMEM150C antibody labeled neurons in WT, but also in Tmem150c−/− mice. NF200 was used to label myelinated neurons. Scale bar = 50 μm. Source data are available for this figure: SourceData F2.
Figure S1.
Figure S1.
Mechanoreceptors and nociceptors in the hairy skin of Tmem150clacZ/lacZ mice were unchanged compared to controls. (A) Mechanoreceptors and nociceptors are unchanged in TMEM150Clacz/lacz mice. We found no differences in the mechanical thresholds between of RAMs (Wilcoxin signed rank, P = 0.07), SAMs (Wilcoxin signed rank, P = 0.07), or D-hair receptors (Wilcoxin signed rank, P = 0.06) recorded from WT and Tmem150clacZ/LacZ mice, data mean ± SEM. (B) The stimulus response functions of mechanoreceptors (RAMs, SAMs, and D-hair receptors) to moving ramp stimuli did not differ between WT and Tmem150clacZ/LacZ mice; two-way ANOVA P = 0.82, P = 0.52, and P = 0.20, respectively; data are means ± SEM. (C) The responses of low threshold SAMs, high threshold AMs and C-fiber nociceptors to increasing ramp and hold forces did not change in Tmem150clacZ/LacZ mice compared to WT; two-way ANOVA, P = 0.50, P = 0.21, and P = 0.14, respectively; data are means ± SEM.
Figure 3.
Figure 3.
Ultrastructural analysis of the tibial nerve. (A) Example electronmicrographs from the tibial nerve of a WT Tmem150c+/+ (top) and Tmem150c−/− mouse (bottom). Scale bar = 5 μm. (B) Quantification of axon numbers revealed no loss of myelinated A-fibers (two-way ANOVA, P = 0.99) or unmyelinated C-fibers (two-way ANOVA, P = 0.95). (C) Measurements of the G-ratio a measure of myelin thickness showed no difference between genotypes (unpaired t test, P = 0.16). (D) Quantification of myelin thickness across all axon sizes (binned by myelin thickness) revealed no statistically significant differences between nerves taken from control Tmem150c+/+ (grey) and Tmem150c−/− mice (blue; two-way ANOVA, P = 0.92 for genotype), means ± SEM.
Figure 4.
Figure 4.
Low threshold mechanoreceptors are unchanged in Tmem150c−/− mice. (A and B) Rapidly adapting mechanoreceptors were stimulated with a linearly increasing 20 Hz sinusoidal force stimulus to determine mechanical threshold in mN (A) or a series of ramp and hold stimuli of different velocities (B; example recordings shown). There was no difference in these mean parameters in RAMs recorded from Tmem150−/− mice compared to littermate controls (Tmem150c+/+ mice; Mann-Whitney U-test, P = 0.40 for threshold; two-way ANOVA, P = 0.07 for stimulus response). (C and D) D-hair mechanoreceptors were also probed with the same quantitative stimuli. There was no difference in the mean mechanical threshold (Mann-Whitney test, P = 0.74) or velocity sensitivity of D-hair mechanoreceptors between the two genotypes (two-way ANOVA, P = 0.70). (E–G) SAMs were also probed with the same quantitative stimuli (E and F), as well as a series of 10 s long ramp and hold stimuli of increasing holding force (50–300 mN; G). There was no statistical difference in the mean mechanical threshold (Wilcoxin signed ranks, P = 0.06), velocity sensitivity (two-way ANOVA, P = 0.27), or stimulus response function of SAMs (two-way ANOVA, P = 0.95) between the two genotypes (G). The numbers of fibers included in the analysis can be found in Table 2. All means ± SEM.
Figure 5.
Figure 5.
The mechanosensitivity of nociceptors was unchanged in Tmem150−/− mice. We recorded from thinly myelinated mechanonociceptors termed A-mechanonociceptors (AM), C-fiber mechanonociceptors (CM), and polymodal C-fiber nociceptors, the latter respond to mechanical stimuli and at least one other stimulus modality like heat or cold. (A) Example recordings from these three receptor types in response to a ramp and hold controlled force stimuli. Mechanical thresholds were measured as the force required to evoke the first spike during the stimulus ramp phase. (B) For AMs, there was no difference in the mean mechanical threshold between fibers recorded from Tmem150−/− mice compared to littermate controls (Tmem150c+/+ mice; Mann-Whitney U-test, P = 0.95). (C) Stimulus response properties of AMs to controlled force stimuli were also not different between genotypes (two-way ANOVA, P = 0.20). (D and E) The mean mechanical thresholds of CMs and C-polymodal fibers did not differ between genotypes (CMs unpaired t test, P = 0.90; C-polymodal Mann-Whitney U-test, P = 0.99). (F and G) The stimulus response functions of CM and C-polymodal fibers also did not differ between genotypes; two-way ANOVA P = 0.44 and P = 0.48, respectively. The numbers of fibers included in the analysis can be found in Table 2. All means ± SEM.
Figure 6.
Figure 6.
Mouse walk behavior test shows comparable motor coordination in Tmem150c−/− and Tmem150c+/+ mice. (A) Average speed of each mouse from one end of the walkway to the other, showing no differences between Tmem150c+/+ mice (7.24 ± 0.62) and Tmem150c−/− (8.09 ± 0.25) mice. Mann-Whitney test, P = 0.12. (B) Regularity of swing time for all legs was similar in Tmem150c+/+ mice (0.05 ± 0.003) and Tmem150c−/− mice (0.05 ± 0.002). Mann-Whitney test, P = 0.25. (C) No differences were observed in step distance between each swing in control Tmem150c+/+ and Tmem150c−/− mice; anterior legs (WT, 30.05 ± 0.54; KO, 30.70 ± 0.68; Mann-Whitney, P = 0.37) and posterior legs (WT, 28.64 ± 0.70; KO, 29.60 ± 0.87; Mann-Whitney, P = 0.21). (D) Swing speed average for individual steps from the anterior (WT, 3.38 ± 0.32; KO, 3.58 ± 0.10; Mann-Whitney, P = 0.72) and posterior legs (WT, 3.50 ± 0.37; KO, 3.77 ± 0.13; Mann-Whitney, P = 0.79) were comparable between Tmem150c+/+ and Tmem150c−/− mice. (E) No differences were observed in the body linearity index in Tmem150c+/+ (1.83 ± 0.19) and Tmem150c−/− mice (1.74 ± 0.19); Mann-Whitney test, P = 0.66. Data expressed as mean ± SEM.

Similar articles

Cited by

References

    1. Abdo, H., Calvo-Enrique L., Lopez J.M., Song J., Zhang M.-D., Usoskin D., El Manira A., Adameyko I., Hjerling-Leffler J., and Ernfors P.. 2019. Specialized cutaneous Schwann cells initiate pain sensation. Science. 365:695–699. 10.1126/science.aax6452 - DOI - PubMed
    1. Anderson, E.O., Schneider E.R., Matson J.D., Gracheva E.O., and Bagriantsev S.N.. 2018. TMEM150C/Tentonin3 is a regulator of mechano-gated ion channels. Cell Rep. 23:701–708. 10.1016/j.celrep.2018.03.094 - DOI - PMC - PubMed
    1. Arnadóttir, J., and Chalfie M.. 2010. Eukaryotic mechanosensitive channels. Annu. Rev. Biophys. 39:111–137. 10.1146/annurev.biophys.37.032807.125836 - DOI - PubMed
    1. Brown, A.L., Liao Z., and Goodman M.B.. 2008. MEC-2 and MEC-6 in the Caenorhabditis elegans sensory mechanotransduction complex: Auxiliary subunits that enable channel activity. J. Gen. Physiol. 131:605–616. 10.1085/jgp.200709910 - DOI - PMC - PubMed
    1. Chelur, D.S., Ernstrom G.G., Goodman M.B., Yao C.A., Chen L., O’ Hagan R., and Chalfie M.. 2002. The mechanosensory protein MEC-6 is a subunit of the C. elegans touch-cell degenerin channel. Nature. 420:669–673. 10.1038/nature01205 - DOI - PubMed

Publication types