. 2022 Oct 27;185(22):4135-4152.e22.
doi: 10.1016/j.cell.2022.09.030. Epub 2022 Oct 17.

SYK coordinates neuroprotective microglial responses in neurodegenerative disease

Affiliations

SYK coordinates neuroprotective microglial responses in neurodegenerative disease

Hannah Ennerfelt et al. Cell. .

Abstract

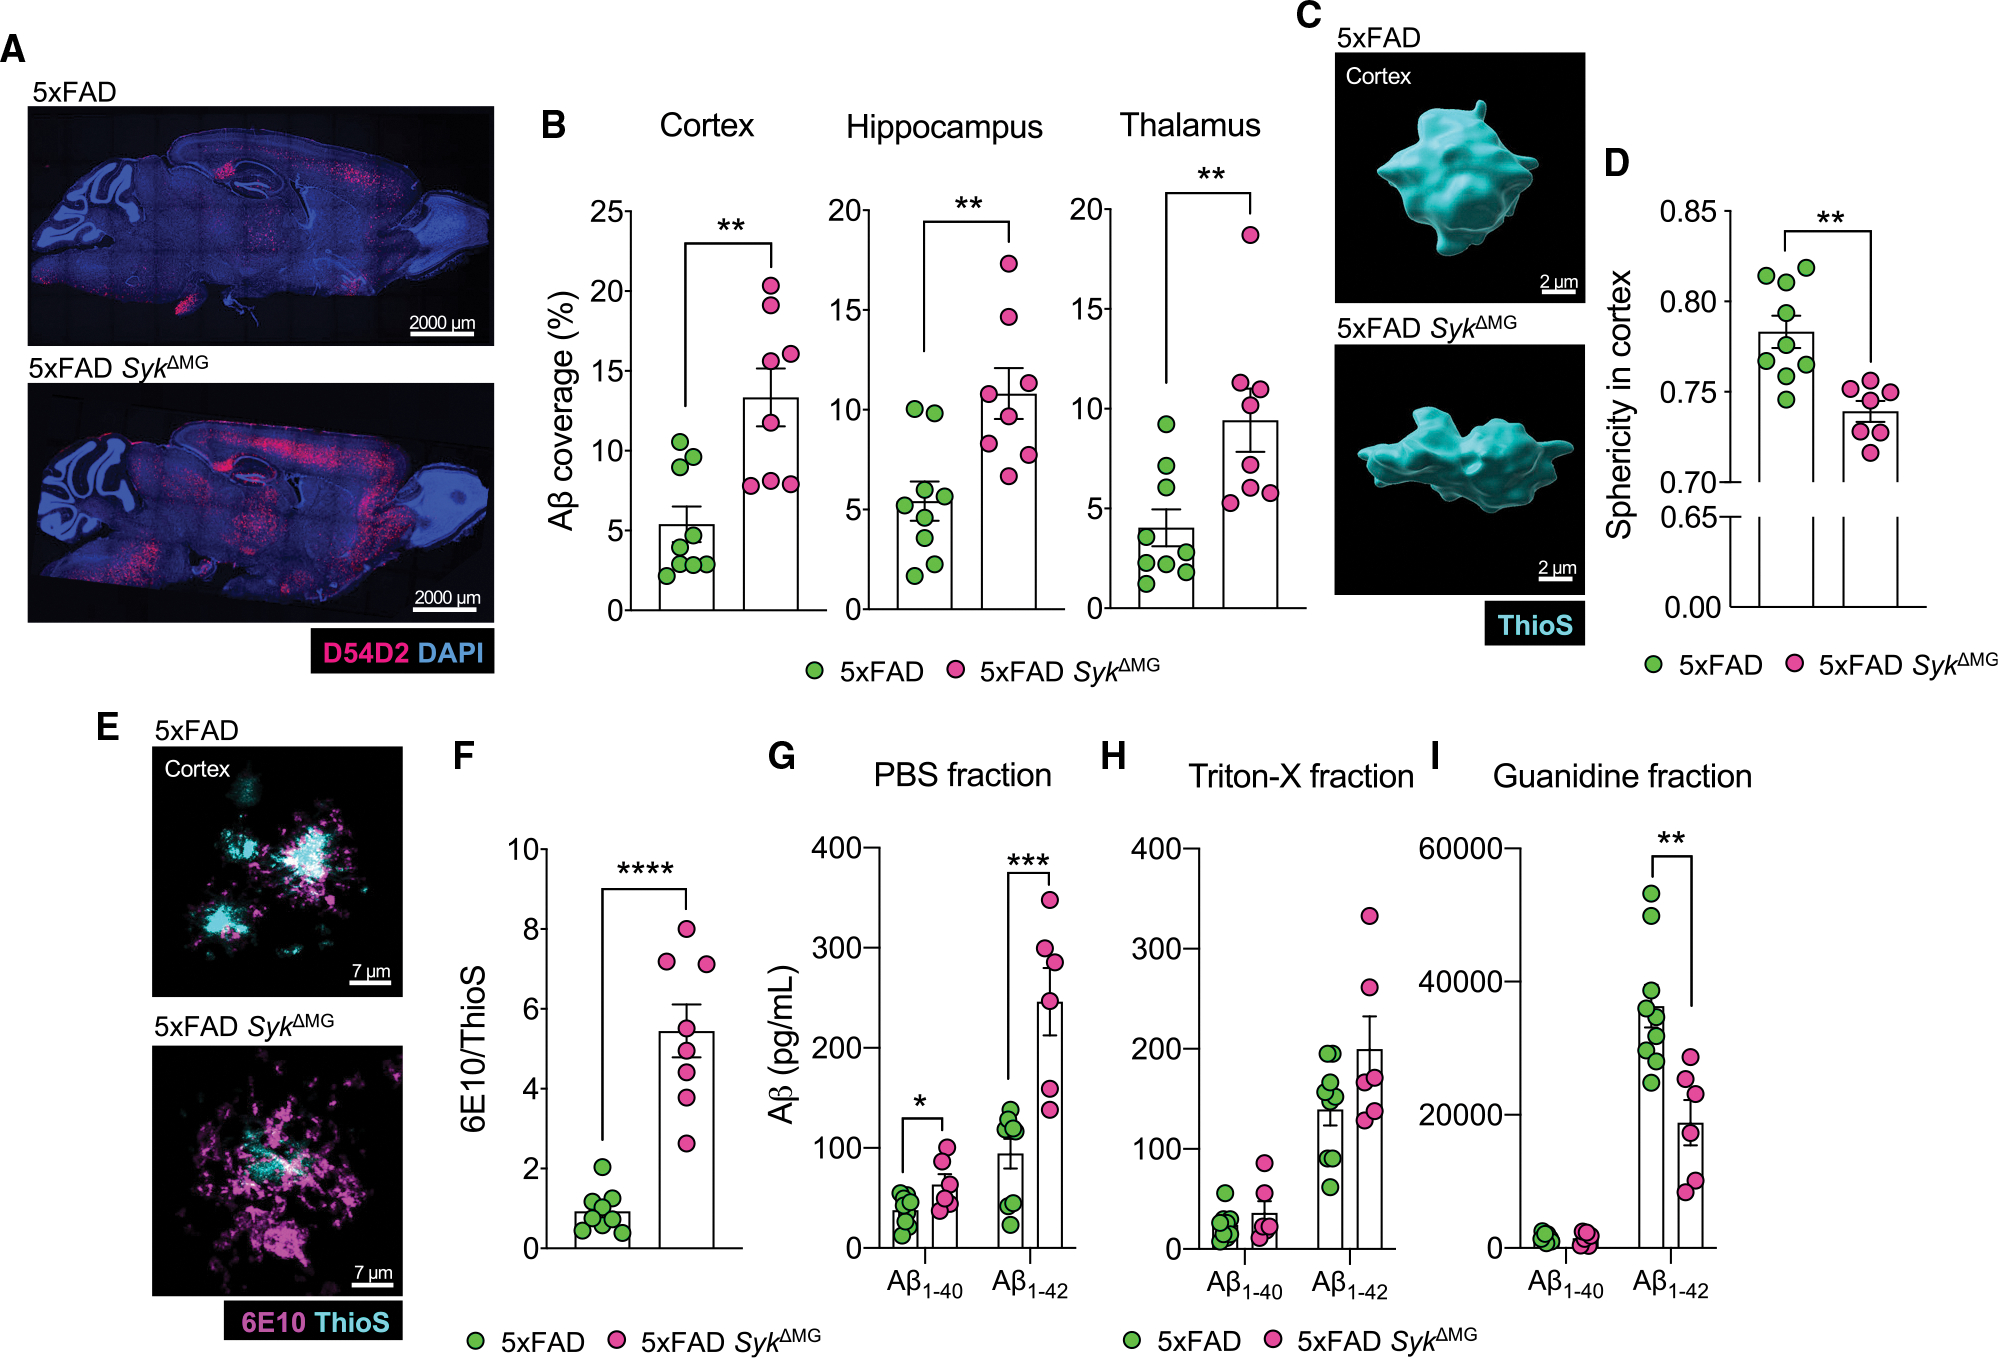
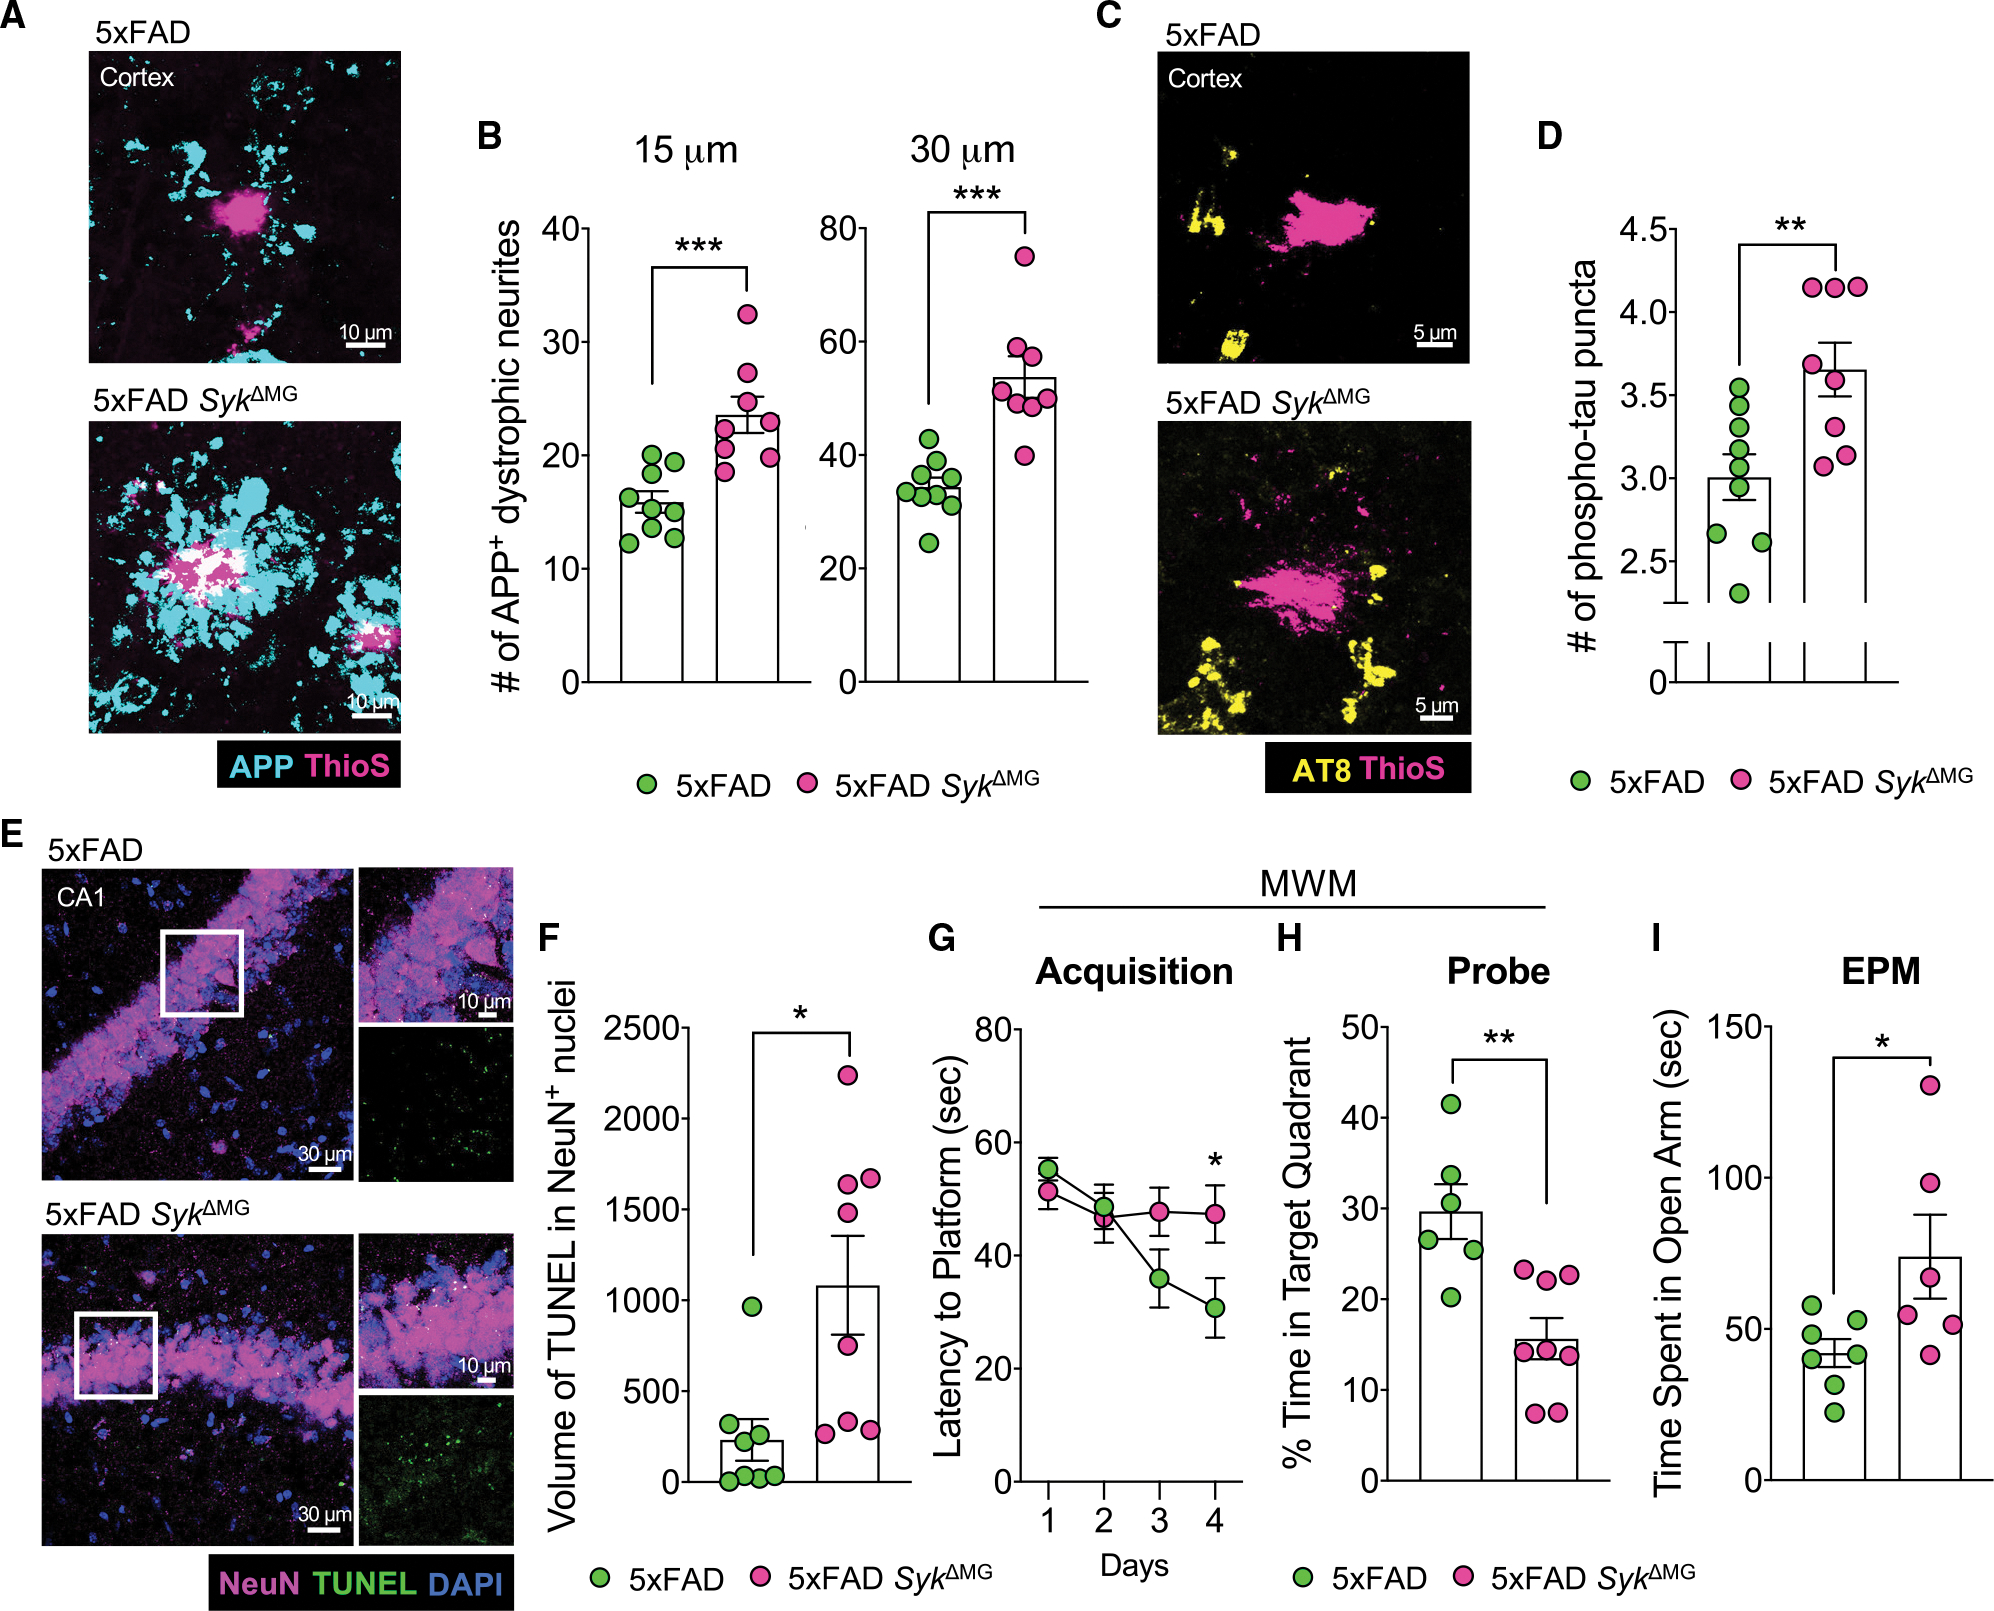
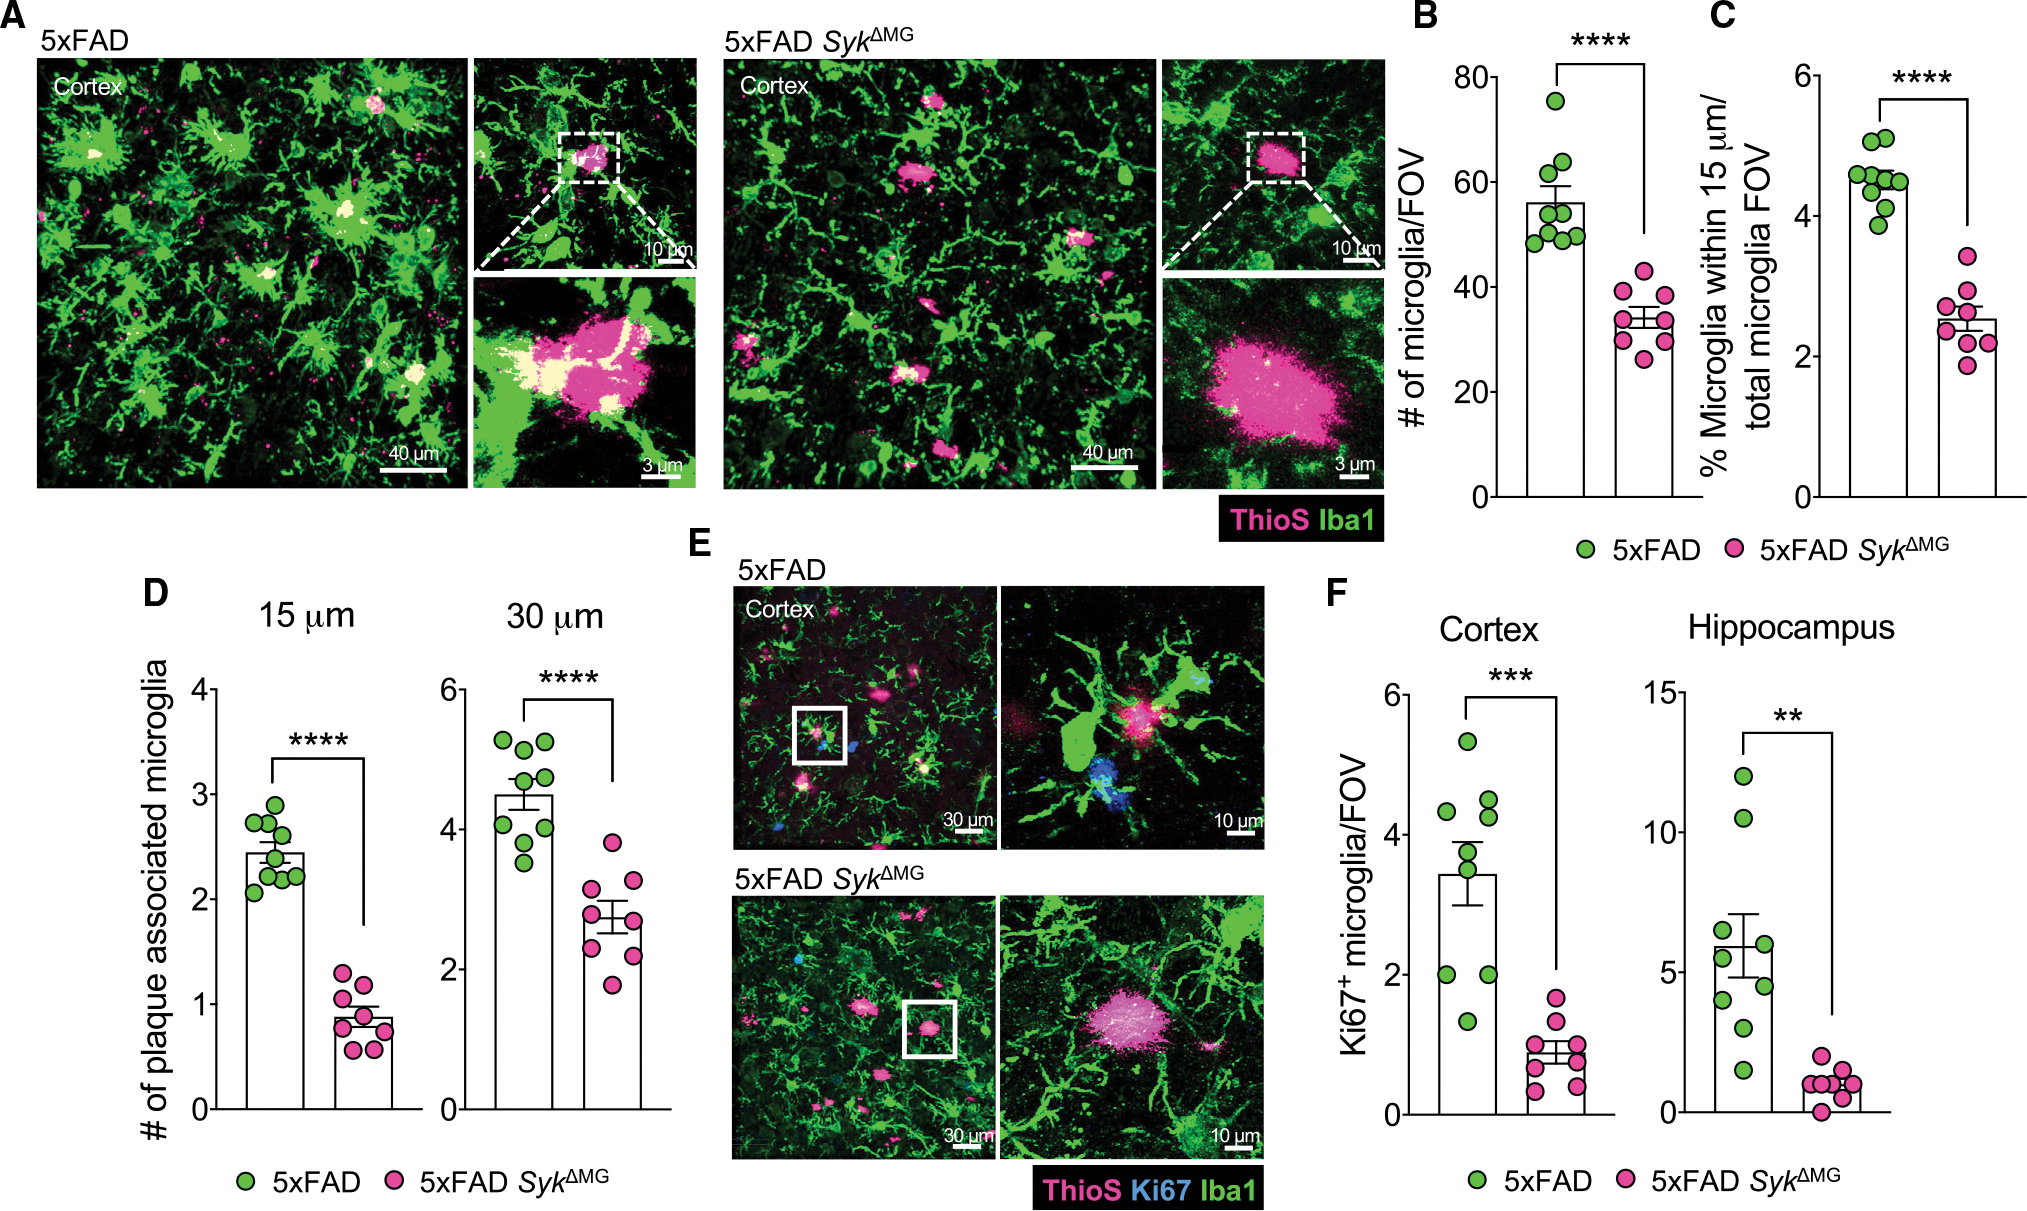
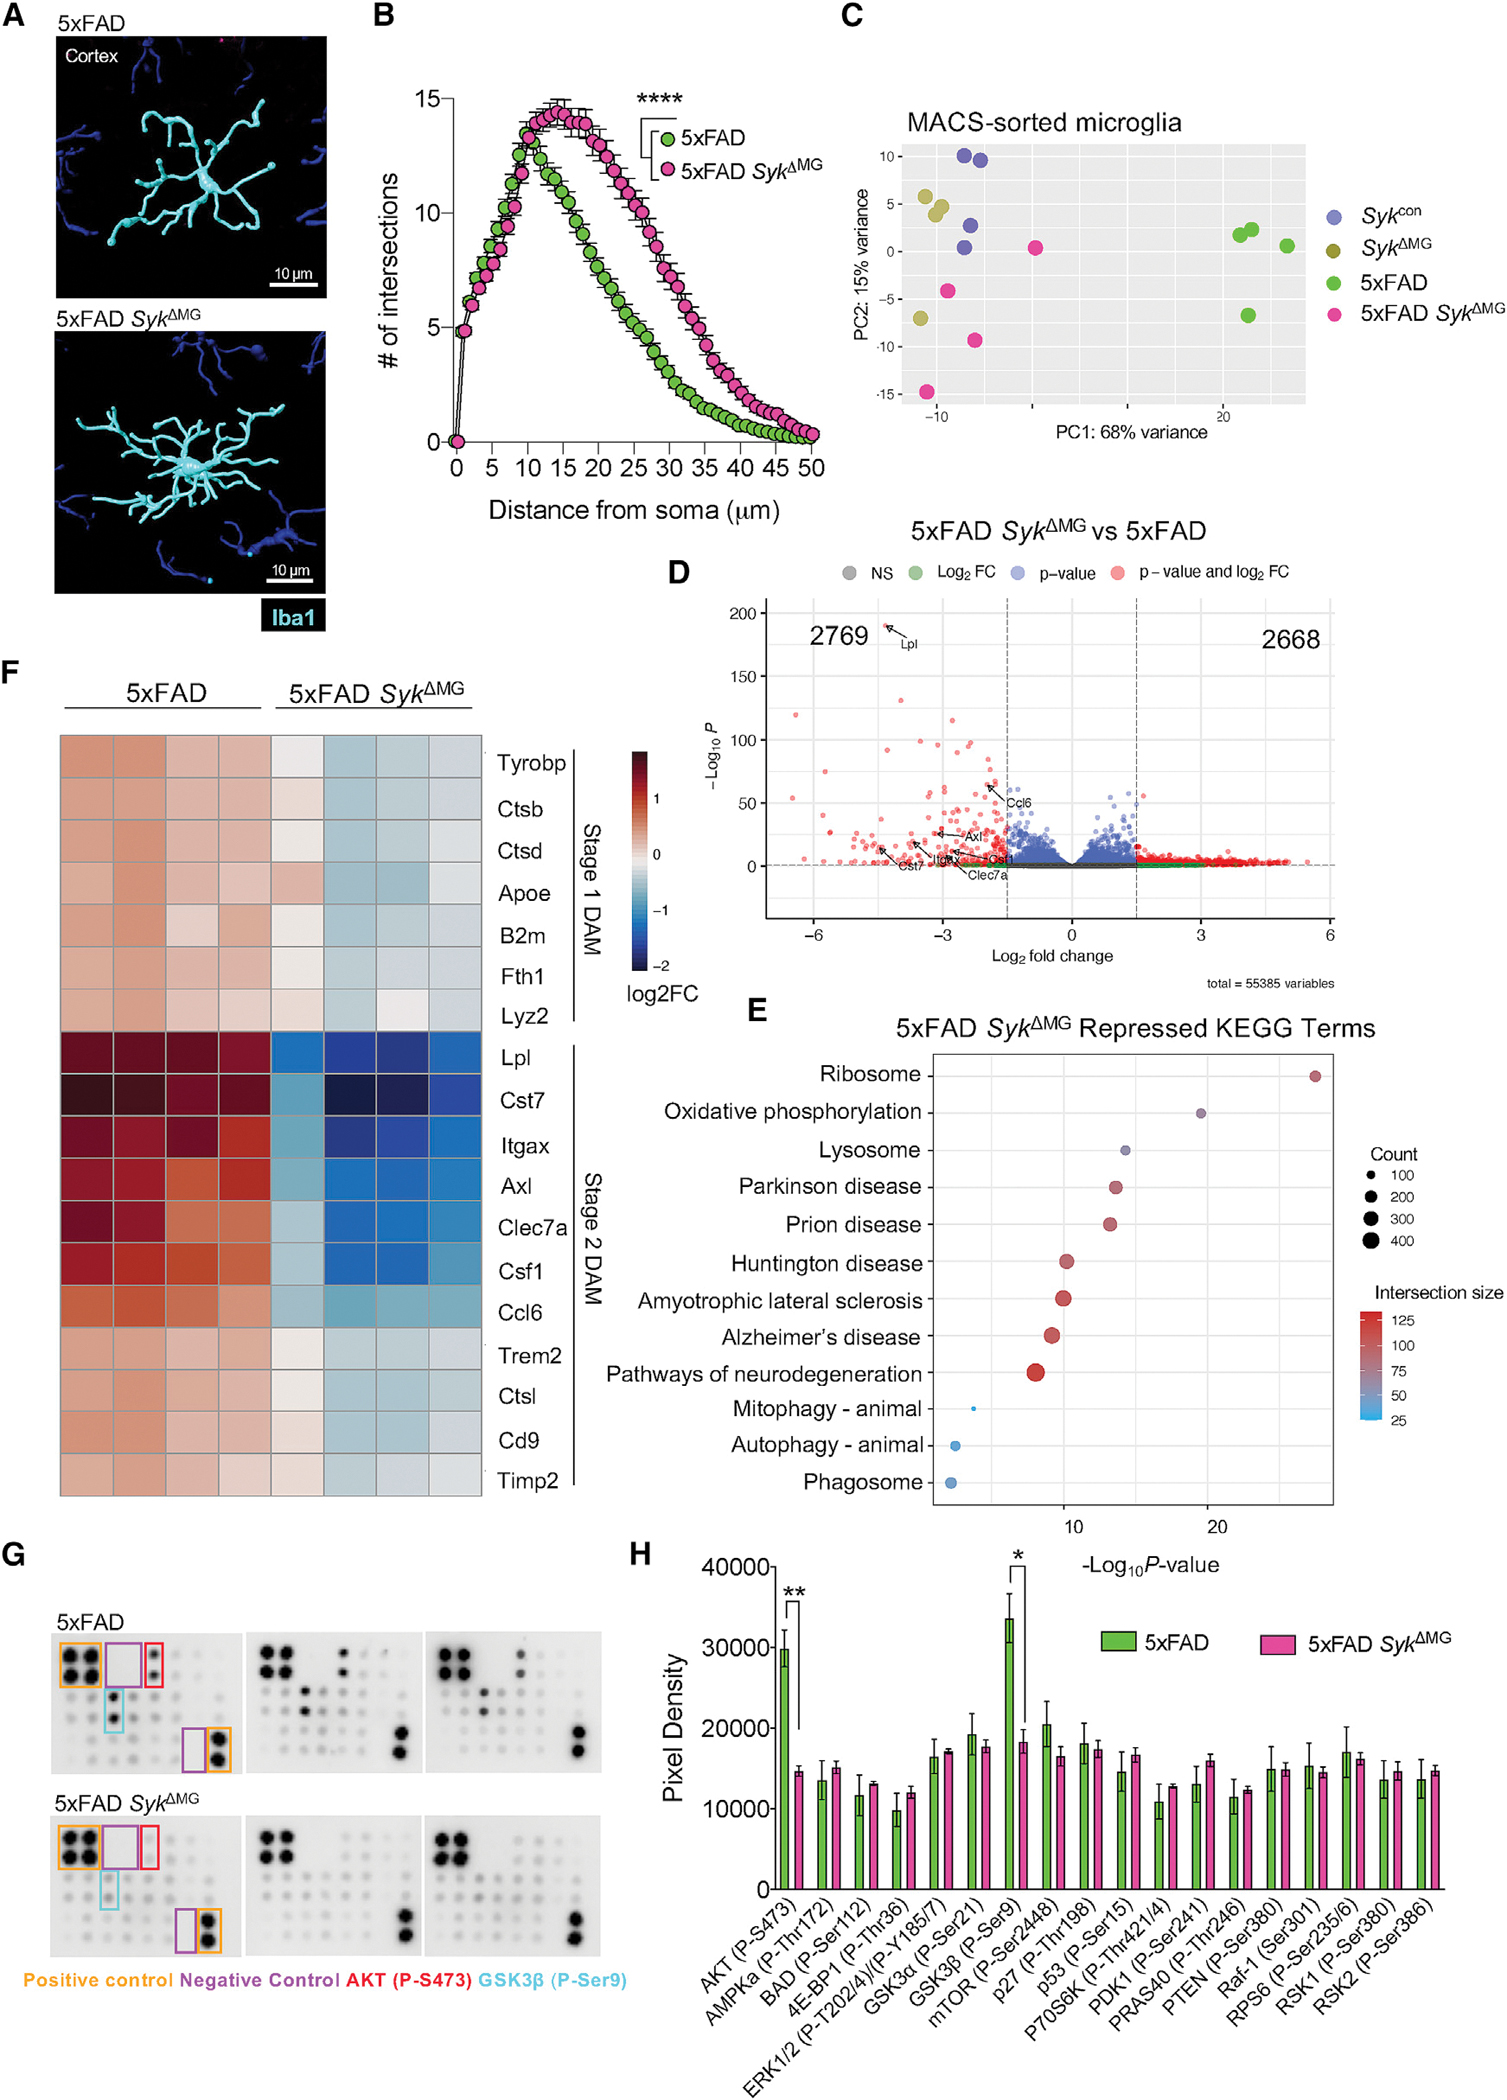
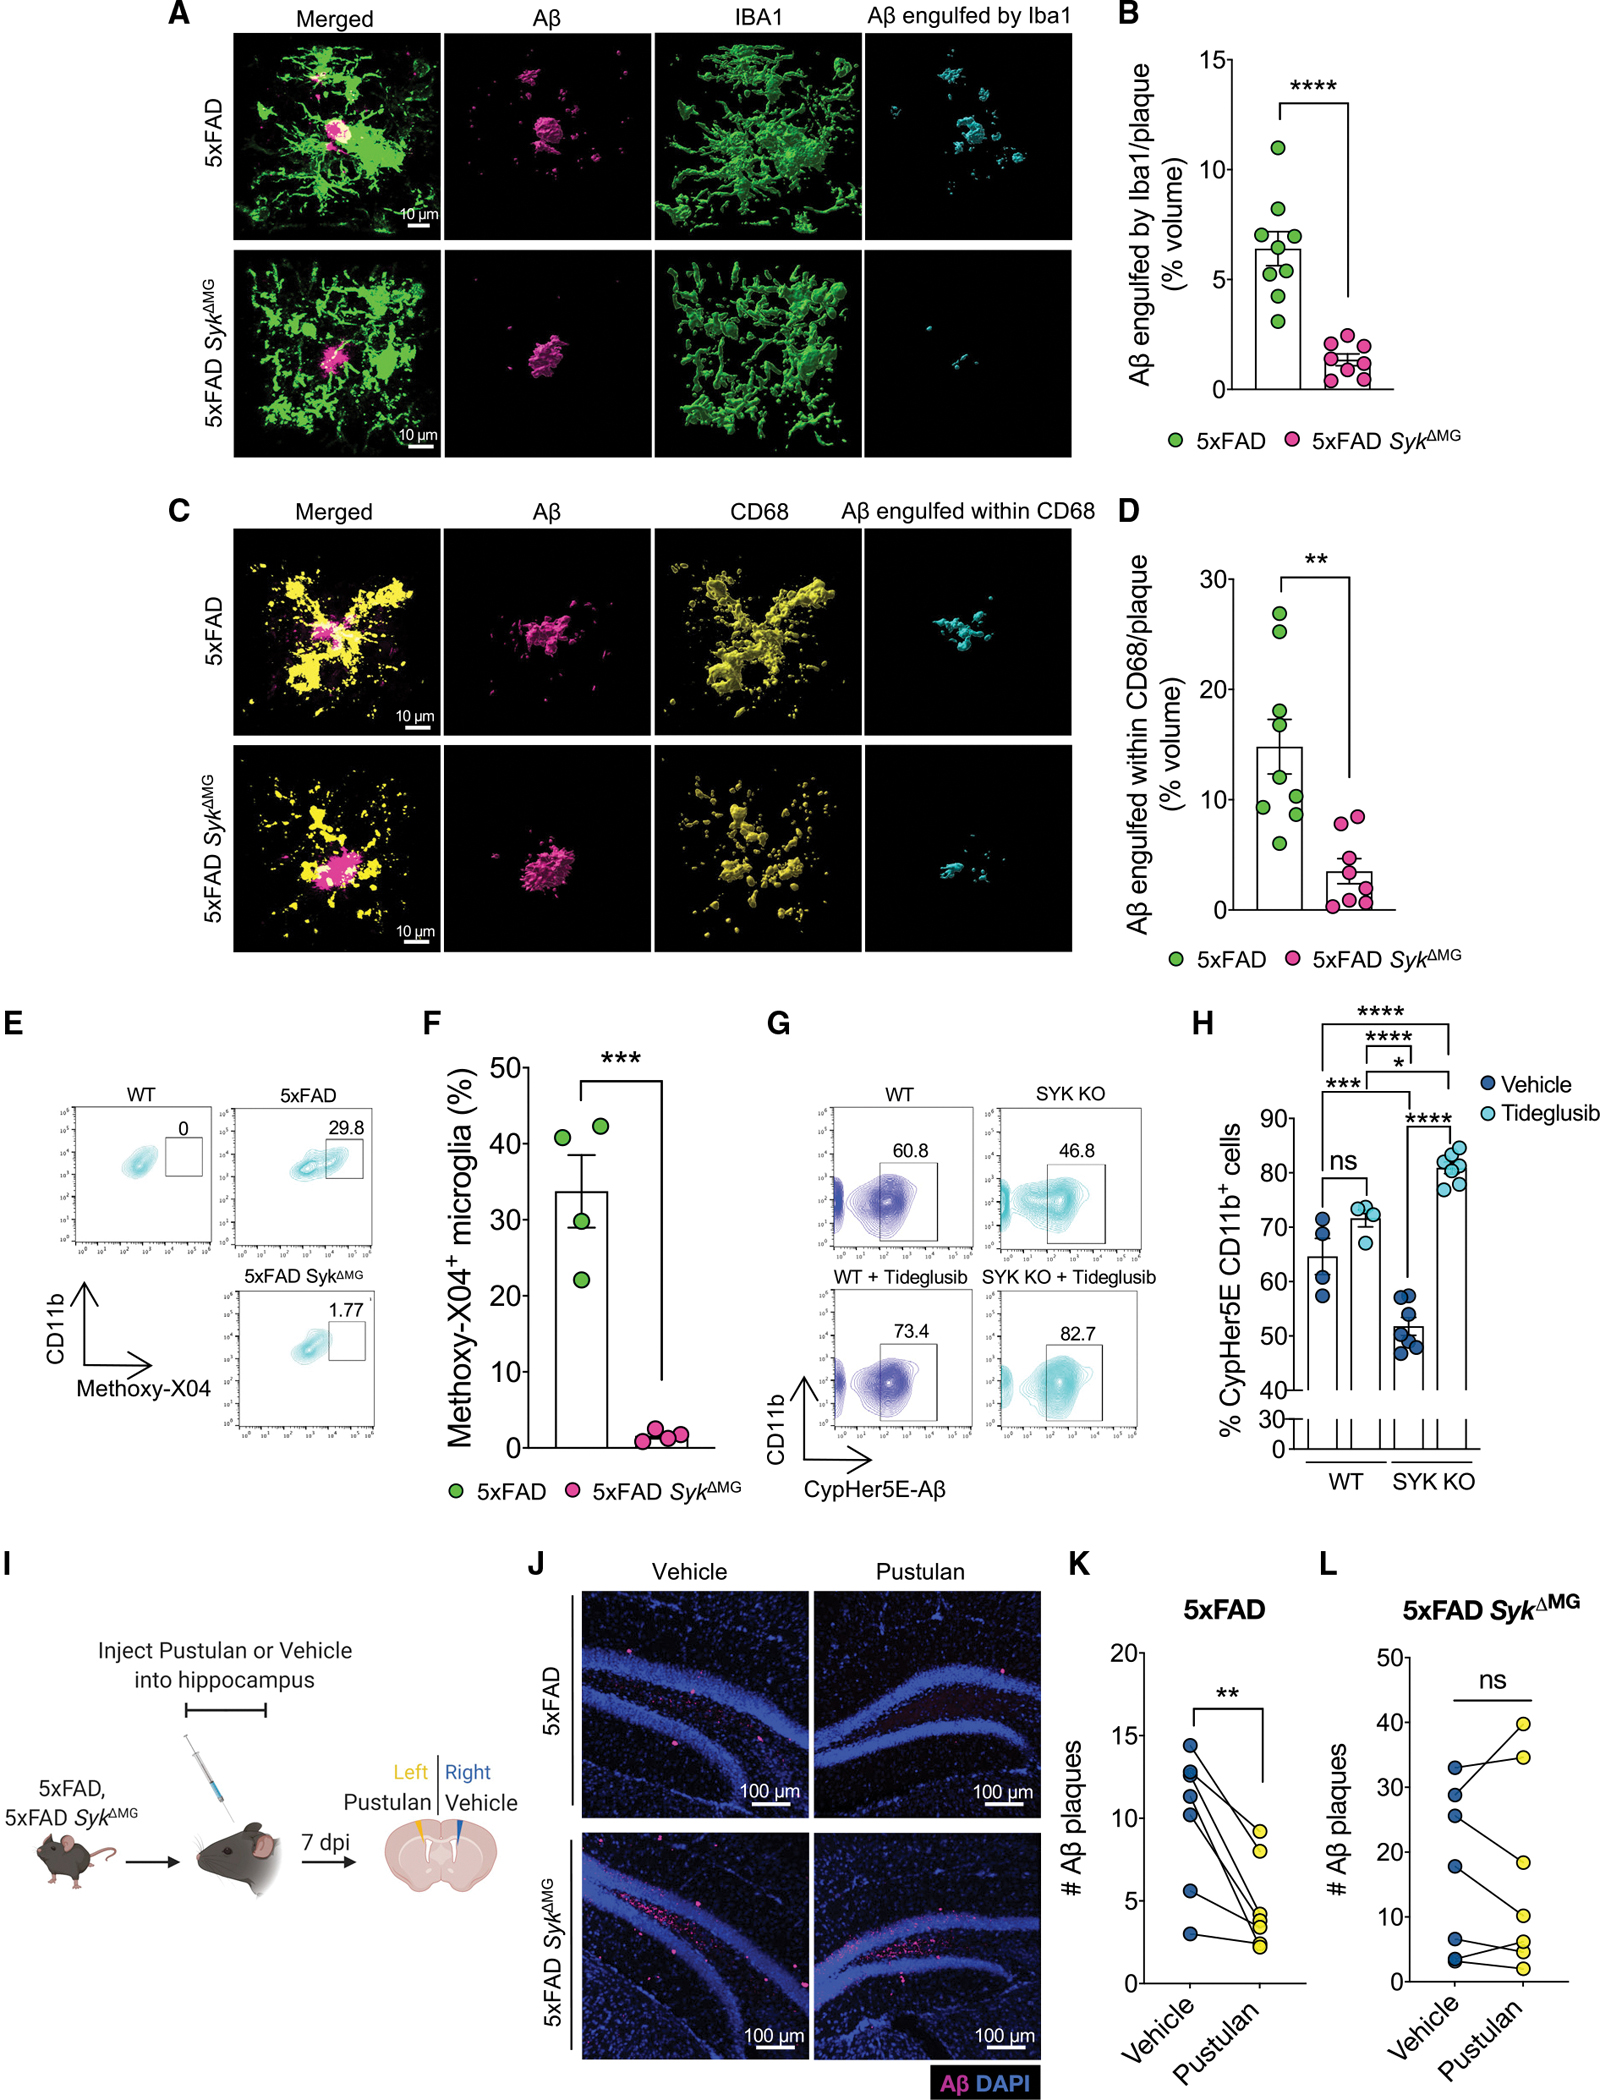
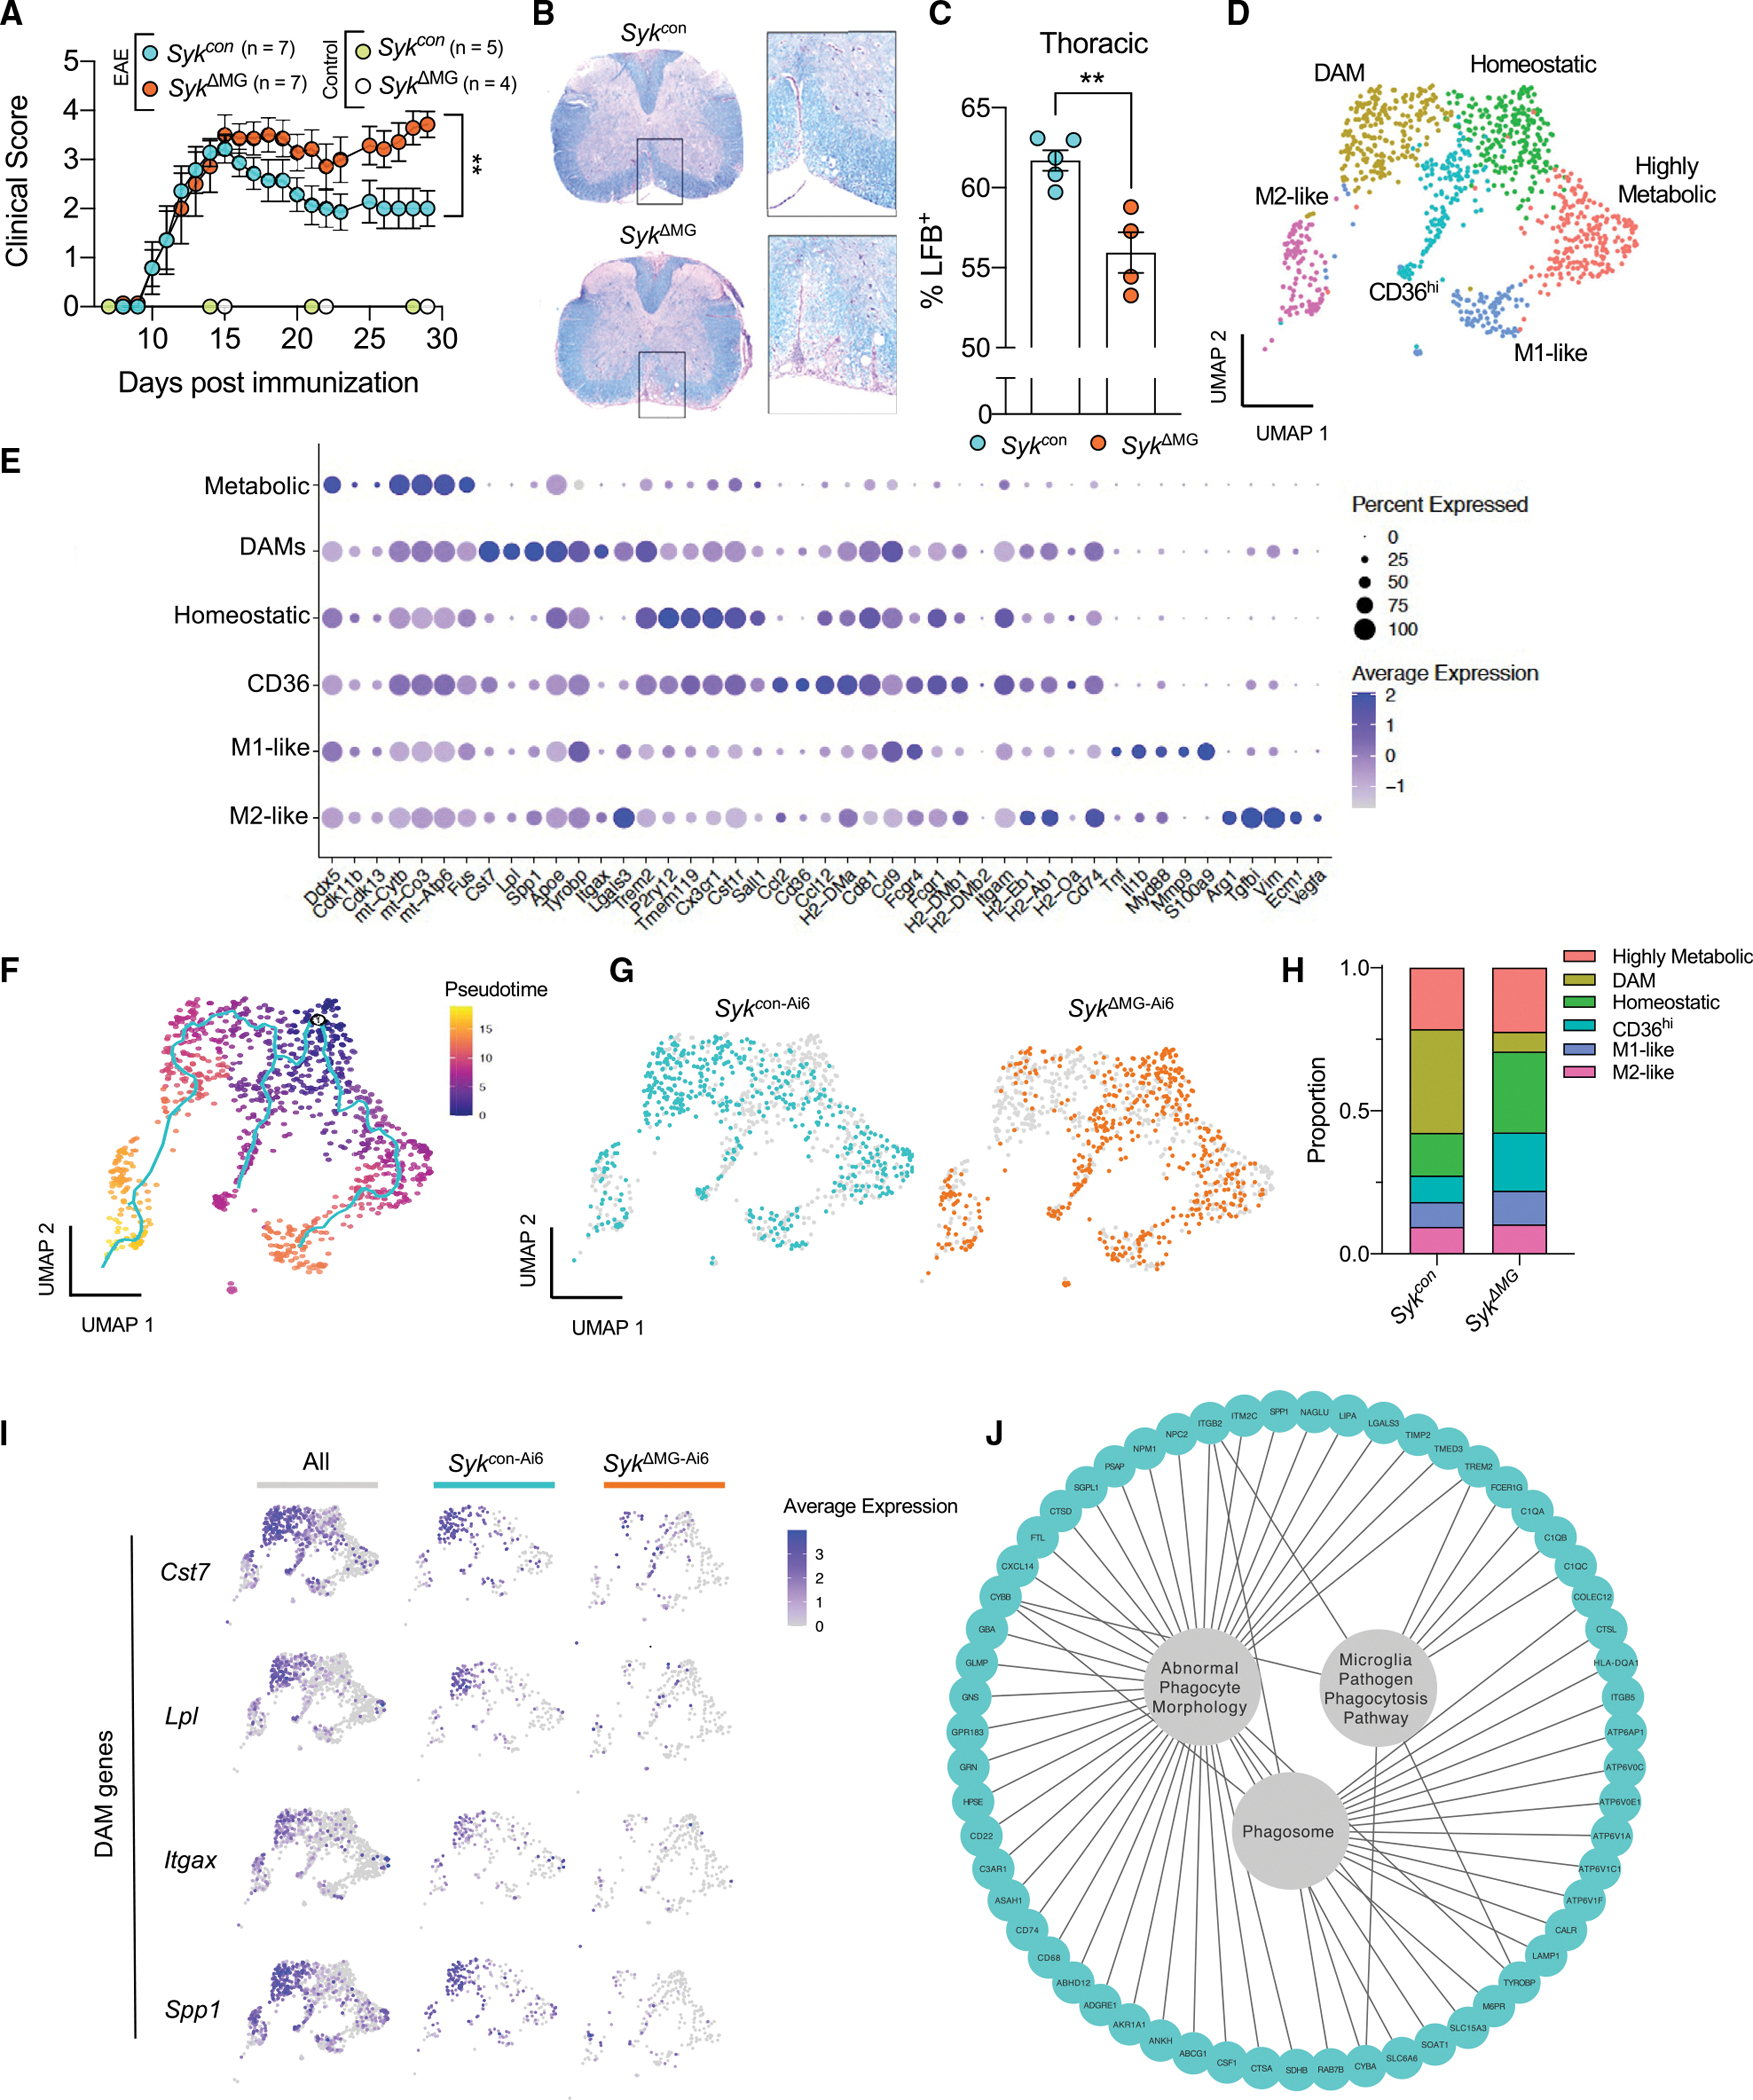
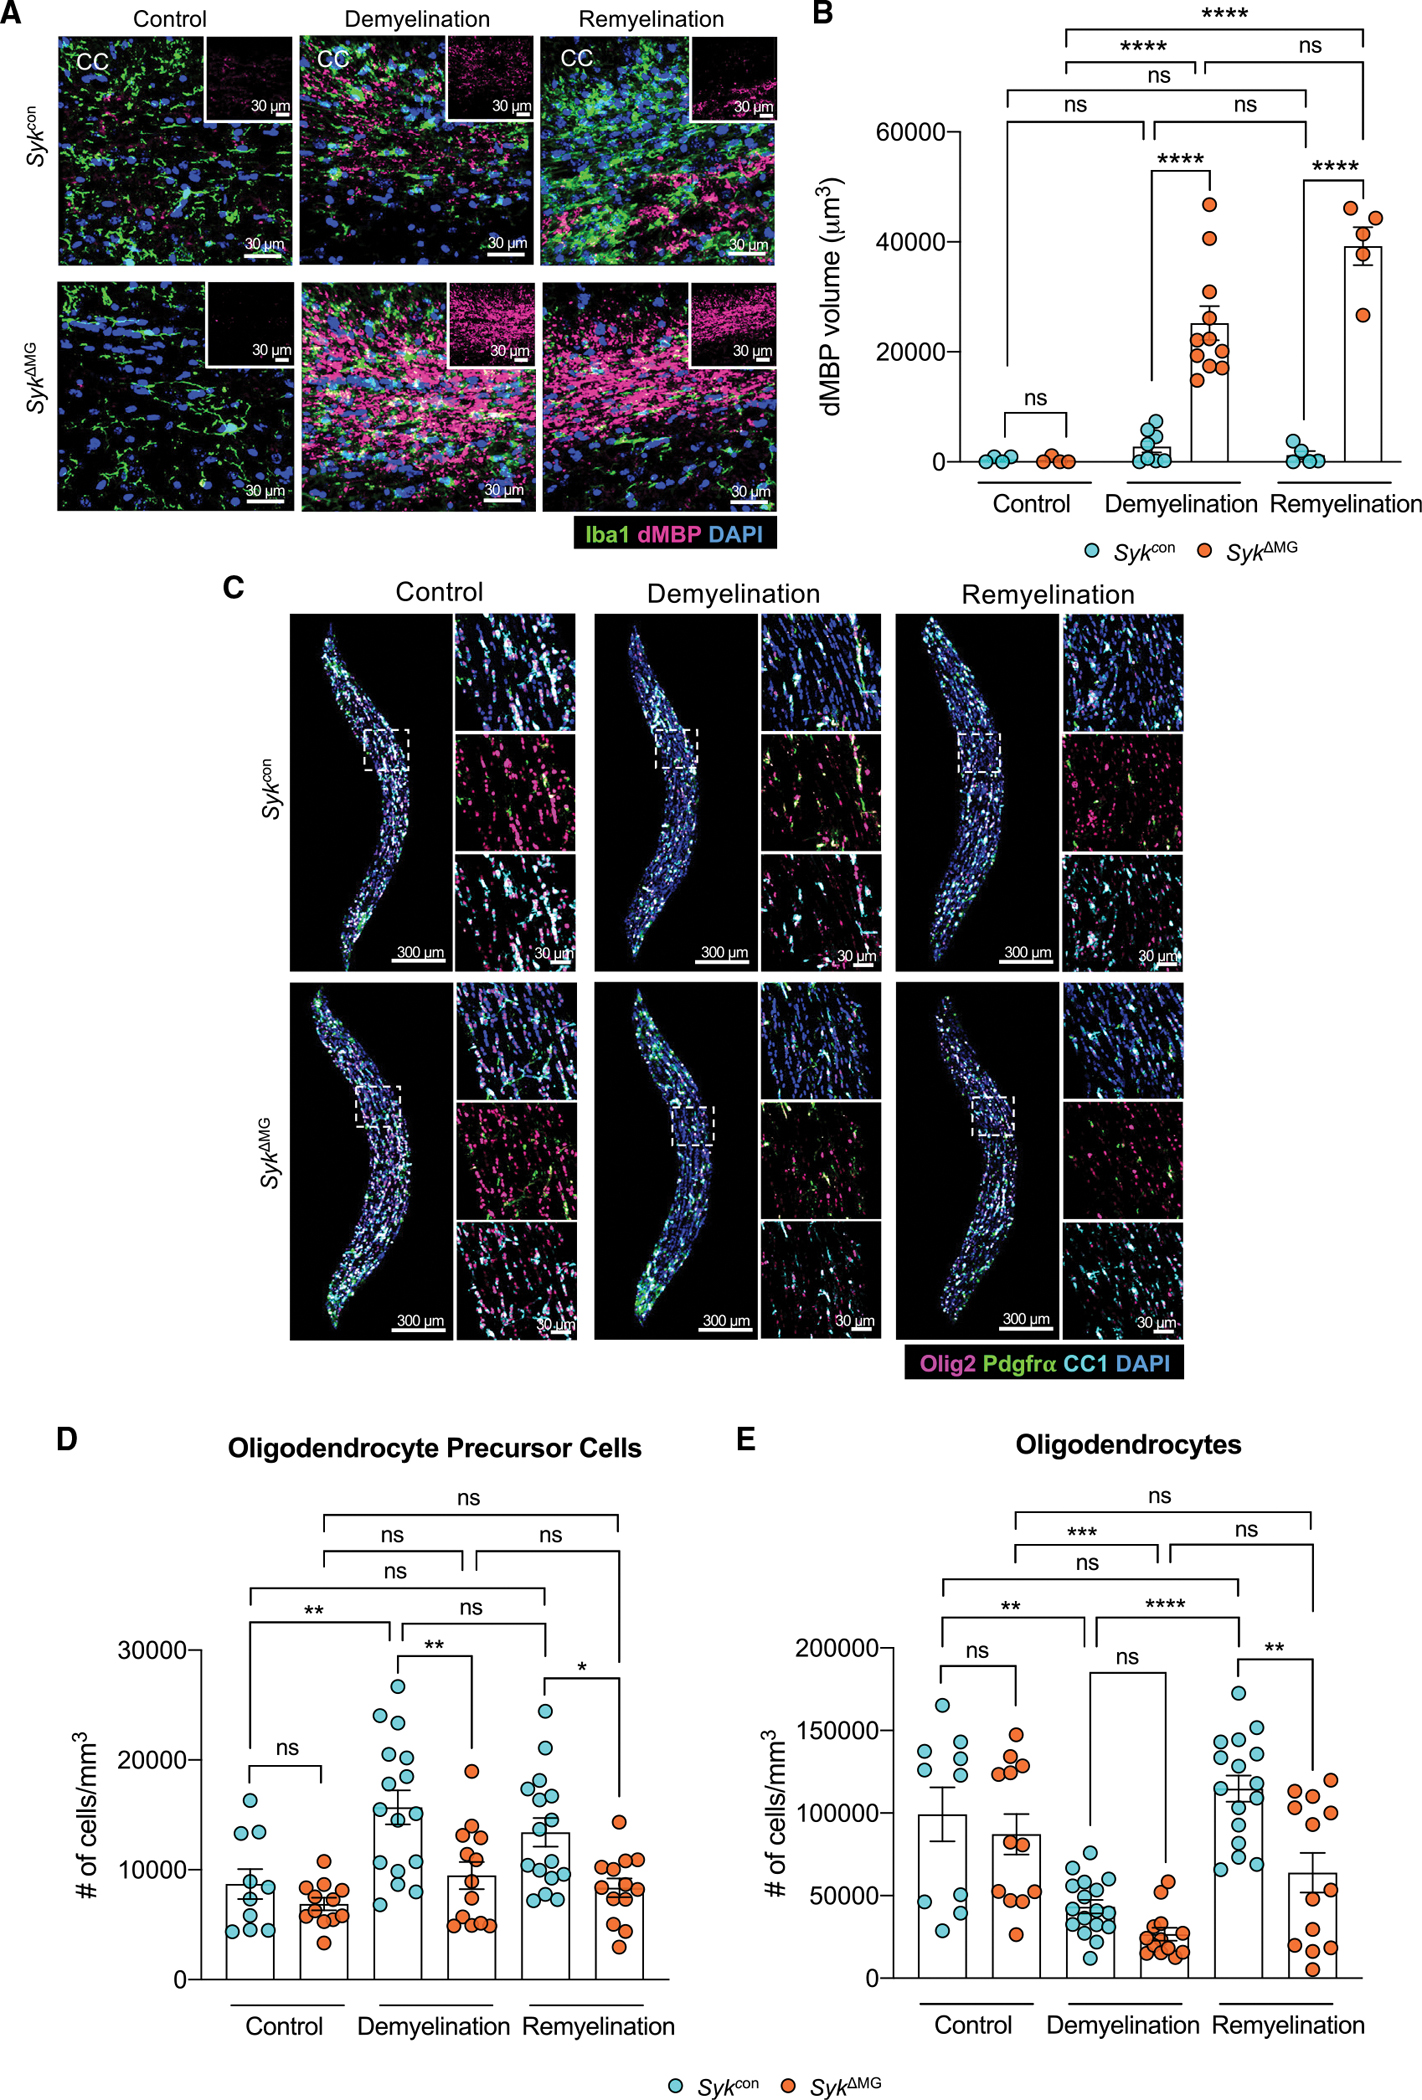
Recent studies have begun to reveal critical roles for the brain's professional phagocytes, microglia, and their receptors in the control of neurotoxic amyloid beta (Aβ) and myelin debris accumulation in neurodegenerative disease. However, the critical intracellular molecules that orchestrate neuroprotective functions of microglia remain poorly understood. In our studies, we find that targeted deletion of SYK in microglia leads to exacerbated Aβ deposition, aggravated neuropathology, and cognitive defects in the 5xFAD mouse model of Alzheimer's disease (AD). Disruption of SYK signaling in this AD model was further shown to impede the development of disease-associated microglia (DAM), alter AKT/GSK3β-signaling, and restrict Aβ phagocytosis by microglia. Conversely, receptor-mediated activation of SYK limits Aβ load. We also found that SYK critically regulates microglial phagocytosis and DAM acquisition in demyelinating disease. Collectively, these results broaden our understanding of the key innate immune signaling molecules that instruct beneficial microglial functions in response to neurotoxic material.

Keywords: Alzheimer’s disease; SYK; amyloid beta; disease-associated microglia; experimental autoimmune encephalomyelitis; microglia; multiple sclerosis; neurodegenerative disease; neuroimmunology; phagocytosis.


Conflict of interest statement

Declaration of interests The authors declare no competing interests.

Figures

Figure 1.
Figure 1.. Deletion of Syk in microglia leads to increased Aβ burden and altered plaque composition in 5xFAD mice
5xFAD Sykfl/flCx3cr1ERT2Cre (5xFAD SykΔMG mice) and Cre-negative 5xFAD Sykfl/fl littermate controls (5xFAD mice) received tamoxifen food for 2 weeks starting at 3 weeks of age and then mice were returned to regular food for the remainder of the experiment. Mice were later harvested at 5 months of age to evaluate amyloid beta (Aβ) load in the brain. (A and B) Immunofluorescence staining of Aβ (D54D2, red; DAPI, blue) was performed on sagittal sections and the percent area covered by Aβ was quantified. (C) Sphericity of ThioflavinS (ThioS)-labeled and Imaris-rendered Aβ plaques in the cortex. (D) Quantification of sphericity with 1.00 being the most spherical, combined data from a total of 50–100 plaques from 3 matching brain sections per mouse. (E) Representative images of Aβ plaque composition labeling 6E10 (purple) and ThioS (blue). (F) Quantification represents the percent volume of the 6E10/ThioS ratio per field of view (FOV) from a total of 10–15 plaques from 3 brain sections per mouse. (G–I) Soluble and insoluble fractions of Aβ1–40 and Aβ1–42 measured by ELISA. Statistical significance between experimental groups was calculated by unpaired Student’s t test (B), (D), and (F)–(I). *p < 0.05, **p < 0.01, ***p < 0.001, ****p < 0.0001. Error bars represent mean ± SEM and each data point represents an individual mouse. See also Figures S1 and S2.
Figure 2.
Figure 2.. Loss of Syk in microglia negatively affects neuronal health and exacerbates AD-related behaviors in 5xFAD mice
(A–F) Brains were harvested from 5xFAD SykΔMG mice and 5xFAD littermate controls at 5 months of age to evaluate neuronal health and cell death. (A) The formation of dystrophic neurites surrounding plaques in the cortex was determined by staining for APP (blue) and Aβ using ThioS (pink). (B) Quantification of APP+ puncta found within 15 and 30 μm of Aβ plaques from a total of ~40 plaques from 3 matching brain sections per mouse. (C) Cortical sections were stained with AT8 (yellow) for phosphorylated tau (p-tau) puncta found within 15 μm of ThioS (pink)-stained Aβ plaques. (D) Quantification of p-tau from a total of ~40 plaques from 3 matching sections per mouse. (E) TUNEL assay (green) and NeuN staining (pink) in the hippocampal CA1 region. (F) Quantification of volume of TUNEL+ stain found in NeuN+ nuclei from 2 corresponding brain sections per mouse. (G and H) 4-month-old 5xFAD (n = 6) and 5xFAD SykΔMG (n = 8) mice were evaluated in the Morris water maze (MWM). Statistics for MWM acquisition were calculated on day 4. Combined data from 3 independent experiments. (I) Performance in the elevated plus maze (EPM) was measured in 4-month-old 5xFAD and 5xFAD SykΔMG mice. Combined data from 2 independent experiments. Statistical significance between experimental groups was calculated by unpaired Student’s t test (B), (D), and (F)–(I). *p < 0.05, **p < 0.01, ***p < 0.001. Error bars represent mean ± SEM and each data point represents an individual mouse. See also Figures S1 and S2.
Figure 3.
Figure 3.. Syk-deficiency limits microglial proliferation and association with Aβ plaques
Brains were harvested from 5xFAD SykΔMG mice and 5xFAD littermate controls at 5 months of age to evaluate microgliosis. (A–C) Microglia were imaged by labeling with Iba1 (green) surrounding Aβ plaques labeled with ThioS (pink) to assess microglial coverage and proximity to plaques. (A) Representative images of Iba1 and ThioS staining in the cortex. (B) Quantification of microglial numbers. (C) Quantification of microglial association with plaques as the percent of microglia within 15 μm of a plaque normalized to the total number of microglia. (D) Quantification of the number of microglia within a 15 and 30 μm radius surrounding ThioS-labeled Aβ plaques. Each point represents an individual mouse with an average of 50–100 plaques from 3 matching brain sections per mouse. (E) Representative images of microglial proliferation measured by evaluating Ki67 (blue) colocalization with Iba1+ (green) microglia in the cortex. (F) Quantification of Ki67+ microglia. Statistical significance between experimental groups was calculated by an unpaired Student’s t test (B)–(D), and (F). **p < 0.01, ***p < 0.001, ****p < 0.0001. Error bars represent mean ± SEM and each data point represents an individual mouse. See also Figure S2.
Figure 4.
Figure 4.. Defective activation of Syk-deficient microglia in 5xFAD mice
5xFAD Sykfl/flCx3cr1ERT2Cre (5xFAD SykΔMG mice), Cre-negative 5xFAD Sykfl/fl littermate controls (5xFAD mice), Sykfl/fl Cx3cr1ERT2Cre (SykΔMG mice), and Cre-negative Sykfl/fl littermate controls (Sykcon mice) received tamoxifen food for 2 weeks starting at 3 weeks of age and then mice were returned to regular food for the remainder of the experiment. Brains were later harvested at 5 months of age to evaluate microglial activation. (A) Imaris-rendered microglia morphology labeled with Iba1 (blue) in the cortex. (B) Sholl analysis quantification from a total of 12 microglia from 3 matching brain sections per mouse (5xFAD n = 9, 5xFAD SykΔMG n = 8). (C–F) Bulk RNA-seq performed on CD11b+-magnetic bead sorted microglia from 5-month-old mice. (C) Principal component (PC) analysis of sample clustering. (D) Volcano plots depicting differentially expressed genes (FDR < 0.1). (E) KEGG term enrichment scatterplot highlighting major pathways that are repressed in 5xFAD SykΔMG microglia in comparison to 5xFAD microglia. (F) Heatmap representation of significantly downregulated (FDR < 0.1) stage 1 and 2 disease-associated microglia (DAM) genes between 5xFAD SykΔMG and 5xFAD groups. (G and H) Mouse AKT pathway phosphorylation array conducted on microglia from 5-month-old 5xFAD SykΔMG and 5xFAD mice. (G) Representative membranes incubated with 5xFAD and 5xFAD SykΔMG microglia measuring AKT phosphorylation targets. (H) Quantification of dot pixel density normalized with respective positive and negative control sample dot pixel density. Data are plotted in membrane order of phosphorylated protein probes; n of 3 for each group. Statistical significance between experimental groups was calculated by a two-way ANOVA with a Bonferroni post-hoc test (B) and an unpaired Student’s t test (H). *p < 0.05, **p < 0.01, ****p < 0.0001. Error bars represent mean ± SEM. See also Figure S3.
Figure 5.
Figure 5.. SYK is critical for microglial uptake and phagocytosis of Aβ
(A–F) Brains were harvested from 5xFAD SykΔMG mice and 5xFAD littermate controls at 5 months of age to evaluate microglial phagocytosis. (A) Imaris-rendered Aβ plaques (ThioS, pink) and Iba1+ cells (green) with the completely localized Aβ-microglia (engulfed) channel in blue. (B) Percent area of engulfment quantification from a total of ~20 plaques from 3 matching brain sections per mouse. (C) Imaris-rendered Aβ plaques (ThioS, pink) and CD68 (yellow) with the completely localized Aβ-CD68 (engulfed) channel in blue. (D) Percent area of engulfment quantification from a total of ~20 plaques from 3 matching brain sections per mouse. (E and F) Mice received intraperitoneal injections of Methoxy-X04 and then brains were harvested 3 h later to evaluate microglial phagocytosis of Methoxy-X04+ labeled Aβ. (E) and (F) Representative flow cytometry plots and quantification of the percentage of CD11bhiCD45int cells that had taken up Methoxy-X04+ labeled Aβ. (G and H) WT and Sykfl/fl LysMCre bone marrow-derived macrophages (BMDMs) pre-treated with vehicle or 10 μM Tideglusib, a GSK3β inhibitor, for 1 h prior to treatment with 10 μM CypHer5E-tagged Aβ oligomers. Aβ phagocytosis by BMDMs was determined 24 h later by measuring CypHer5E fluorescence by flow cytometry. (G) and (H) Representative flow cytometry plots and quantification of percent CypHer5E CD11bhiF4/80hi cells. (I–L) 10-week-old 5xFAD and 5xFAD SykΔMG mice received bilateral intrahippocampal injections of vehicle and CLEC7A agonist pustulan. Seven days post injection (dpi) brains were harvested to measure Aβ load between matched vehicle and pustulan injected hippocampal hemispheres. (J) Representative immunofluorescence staining of D54D2-labeled Aβ (pink) in hippocampal sections. (K and L) Mouse-matched quantification of Aβ in vehicle- and pustulan-injected hippocampal hemispheres. Statistical significance between experimental groups was calculated by unpaired Student’s t test (B), (D), and (F), one-way ANOVA with multiple comparisons (H), and paired Student’s t test (K) and (L). *p < 0.05, **p < 0.01, ***p < 0.001, ****p < 0.0001. Error bars represent mean ± SEM and each data point represents an individual mouse. See also Figure S4.
Figure 6.
Figure 6.. Syk-deletion in microglia impedes the formation of DAM in EAE
(A–C) SykΔMG mice and Sykcon littermate controls received tamoxifen food for 2 weeks starting at 3 weeks of age and then mice were returned to regular food for the remainder of the experiment. Mice were then immunized with MOG + CFA and pertussis toxin at 8–14 weeks of age to induce experimental autoimmune encephalomyelitis (EAE). Control mice did not receive EAE induction. (A) Severity of hindlimb paralysis was assessed using a 5-point clinical scoring system. (B) and (C) Representative images and quantification of spinal cords stained with Luxol fast blue (LFB). (D–J) Syk+/+ Cx3cr1ERT2Cre and Sykfl/fl Cx3cr1ERT2Cre were crossed onto the Ai6-ZsGreen reporter background (denotated as Sykcon–Ai6 and SykΔMG–Ai6 mice) to isolate microglia in the EAE disease model. Sykcon–Ai6 and SykΔMG–Ai6 mice were pre-treated with tamoxifen and EAE was induced as described in (A)–(C). Spinal cords were harvested from mice on day 35 post-immunization and single-cell RNA-sequencing was performed on FACS-sorted ZsGreen+ microglia. (D) Uniform Manifold Approximation and Projection (UMAP) representation of combined Sykcon–Ai6 and SykΔMG–Ai6 microglia cell populations. (E) Dot plot representation of cluster defining genes for each cell population. (F) UMAP representation of pseudotime cellular trajectory profiles showing microglia maturation trajectories. (G) UMAP representation of the cell populations present in each of the clusters. (H) Breakdown of cluster proportions. (I) Feature plots depicting several DAM genes. (J) Plotted KEGG and GO terms related to phagocytosis using defining genes of the DAM cluster. Statistical significance between experimental groups was calculated by non-parametric Mann-Whitney U-test (A) and unpaired Student’s t test (C). **p < 0.01. Error bars represent mean ± SEM and each data point represents an individual mouse (C). See also Figure S5.
Figure 7.
Figure 7.. Disruption of SYK signaling in microglia during demyelinating disease leads to accumulation of damaged myelin debris and impaired oligodendrogenesis
SykΔMG mice and Sykcon littermate controls received tamoxifen food for 2 weeks starting at 3 weeks of age and then mice were returned to regular food. Adult (8–12 month old) mice were later fed a diet consisting of 0.3% cuprizone for 5 weeks to induce demyelination. Mice were then either harvested after 5 weeks of cuprizone treatment (demyelination group) or returned to normal chow for one additional week before being harvested (remyelination group). Control mice were not introduced to the cuprizone diet. (A) Representative images of microglia labeled with Iba1 (green) and damaged myelin basic protein (dMBP; pink) staining in the corpus callosum (CC). (B) Quantification of dMBP volume in the CC. (C) Representative images of oligodendrocyte lineage markers in the CC. (D and E) Quantification of the number of Pdgfra+ Olig2+ oligodendrocyte precursor cells (D) and number of CC1+ Olig2+ mature oligodendrocytes (E) in the CC. Statistical significance between experimental groups was calculated by one-way ANOVA with multiple comparisons (B), (D), and (E). ns = not significant, *p < 0.05, **p < 0.01, ***p < 0.001, ****p < 0.0001. Data are mean ± SEM and combined from two independent experiments and each data point represents an individual mouse. See also Figure S6.

Comment in

References

    1. Back SA, Tuohy TMF, Chen H, Wallingford N, Craig A, Struve J, Luo NL, Banine F, Liu Y, Chang A, et al. (2005). Hyaluronan accumulates in demyelinated lesions and inhibits oligodendrocyte progenitor maturation. Nat Med 11, 966–972. 10.1038/nm1279. - DOI - PubMed
    1. Batista SJ, Still KM, Johanson D, Thompson JA, O’Brien CA, Lukens JR, and Harris TH (2020). Gasdermin-D-dependent IL-1α release from microglia promotes protective immunity during chronic Toxoplasma gondii infection. Nat. Commun. 11, 3687. 10.1038/s41467-020-17491-z. - DOI - PMC - PubMed
    1. Bemiller SM, McCray TJ, Allan K, Formica SV, Xu G, Wilson G, Kokiko-Cochran ON, Crish SD, Lasagna-Reeves CA, Ransohoff RM, et al. (2017). TREM2 deficiency exacerbates tau pathology through dysregulated kinase signaling in a mouse model of tauopathy. Mol. Neurodegener. 12, 74. 10.1186/s13024-017-0216-6. - DOI - PMC - PubMed
    1. Brown MR, Radford SE, and Hewitt EW (2020). Modulation of beta-Amyloid Fibril Formation in Alzheimer’s Disease by Microglia and Infection. Front. Mol. Neurosci. 13, 609073. 10.3389/fnmol.2020.609073. - DOI - PMC - PubMed
    1. Chu E, Mychasiuk R, Hibbs ML, and Semple BD (2021). Dysregulated phosphoinositide 3-kinase signaling in microglia: shaping chronic neuroinflammation. J. Neuroinflammation 18, 276. 10.1186/s12974-021-02325-6. - DOI - PMC - PubMed

Publication types