. 2022 Dec;9(34):e2202342.
doi: 10.1002/advs.202202342. Epub 2022 Oct 18.

Human Islet Amyloid Polypeptide (hIAPP) Protofibril-Specific Antibodies for Detection and Treatment of Type 2 Diabetes

Affiliations

Human Islet Amyloid Polypeptide (hIAPP) Protofibril-Specific Antibodies for Detection and Treatment of Type 2 Diabetes

Angelina S Bortoletto et al. Adv Sci (Weinh). 2022 Dec.

Abstract

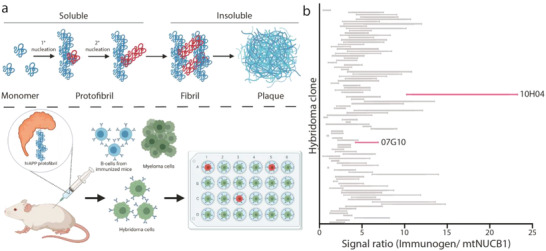
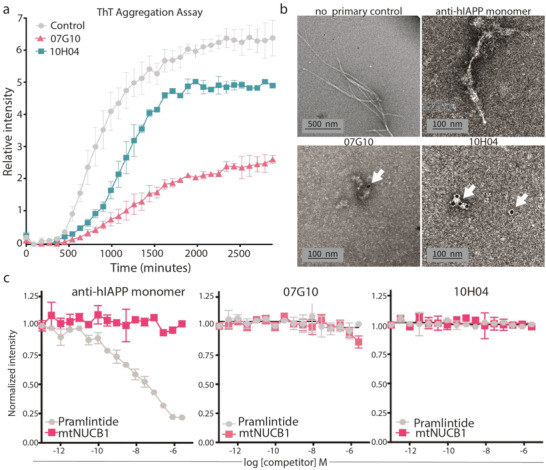
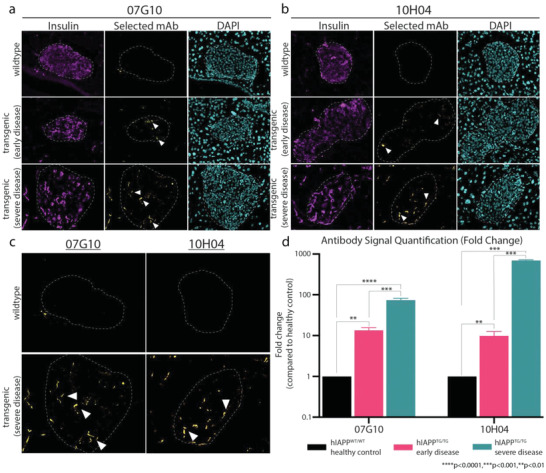
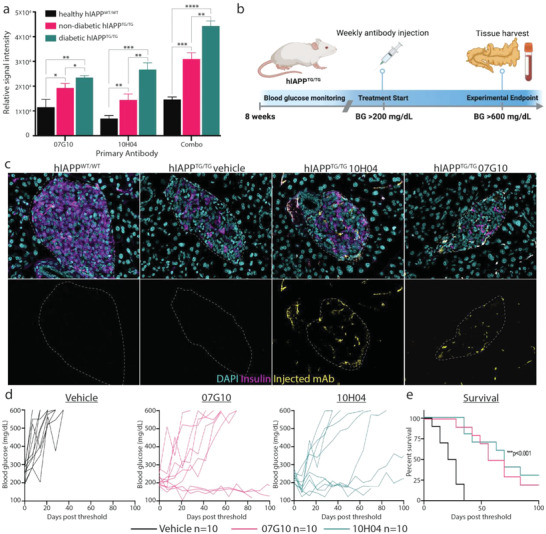
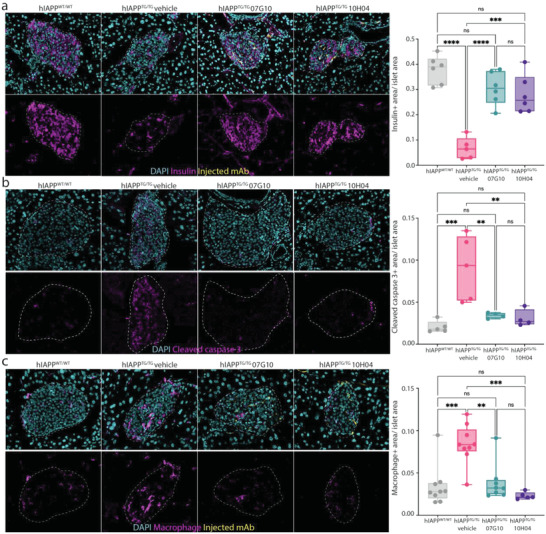
Type 2 diabetes mellitus (T2D) is a major public health concern and is characterized by sustained hyperglycemia due to insulin resistance and destruction of insulin-producing β cells. One pathological hallmark of T2D is the toxic accumulation of human islet amyloid polypeptide (hIAPP) aggregates. Monomeric hIAPP is a hormone normally co-secreted with insulin. However, increased levels of hIAPP in prediabetic and diabetic patients can lead to the formation of hIAPP protofibrils, which are toxic to β cells. Current therapies fail to address hIAPP aggregation and current screening modalities do not detect it. Using a stabilizing capping protein, monoclonal antibodies (mAbs) can be developed against a previously nonisolatable form of hIAPP protofibrils, which are protofibril specific and do not engage monomeric hIAPP. Shown here are two candidate mAbs that can detect hIAPP protofibrils in serum and hIAPP deposits in pancreatic islets in a mouse model of rapidly progressing T2D. Treatment of diabetic mice with the mAbs delays disease progression and dramatically increases overall survival. These results demonstrate the potential for using novel hIAPP protofibril-specific mAbs as a diagnostic screening tool for early detection of T2D, as well as therapeutically to preserve β cell function and target one of the underlying pathological mechanisms of T2D.

Keywords: amyloidosis; diabetes; monoclonal antibodies; therapeutics.


Conflict of interest statement

T.P.S. and W.V.G. are listed as inventors on a US patent related to this study. The authors have no additional financial interests.

Figures

Figure 1
Figure 1
Purified mAb raised against mtNUCB1‐capped hIAPP bind capped hIAPP protofibrils in vitro. a) Top panel: hIAPP aggregation schematic showing the progression of hIAPP monomers to fibril and plaque formation (not drawn to scale). Bottom panel: mtNUCB1‐capped hIAPP protofibrils were used as the immunogen for mAb discovery. b) 104 supernatant fractions from successfully growing clonal hybridomas were analyzed for binding to either mtNUCB1‐capped hIAPP protofibrils or mtNUCB1 alone. Ratios of binding are shown. Pink‐labeled clones were selected for further analysis. Panel (a) was created with BioRender.
Figure 2
Figure 2
The mAbs inhibit aggregation and are specific for hIAPP protofibrils and not monomers. a) Kinetic analysis of ab inhibition of hIAPP aggregation via Thioflavin T (ThT) assay. The initial hIAPP monomer concentration for each experiment was 2.5 µm; ThT concentration was 10 µm; and each mAb was 1 µm. n = 2 per group. b) Immunogold electron microscopy analysis of no‐primary control, monomer control, 07G10, or 10H04 mAbs that were co‐incubated with hIAPP for 24 h to allow for aggregation. Candidate mAbs prevent fibril formation shown in the first part of panel (b). Only candidate mAbs co‐localize with protofibrils, as indicated by the electron‐dense gold particles (white arrows). c) Competition ELISA of mAbs to pramlintide or mtNUCB1 (half‐log dilution starting from 10 µm). Immunogen was coated at 2.5 µg mL−1 and anti‐hIAPP; 07G10 and 10H04 antibodies were added at 0.4 nm; n = 4 per group; and error bars represent S.E.M.
Figure 3
Figure 3
The mAbs engage hIAPP protofibrils in vivo. Immunofluorescence shows increased hIAPP protofibril staining with T2D disease progression with a) 07G10 and b) 10H04. Insulin (magenta), mAb (yellow), nuclei (cyan). c) Magnified image of 07G10 and 10H04 staining in WT and severe T2D. Protofibril staining is indicated by white arrowheads. d) Quantification of candidate mAb signal as the disease progresses compared to healthy controls. n = 3 per group; error bars represent S.E.M, ordinary one‐way ANOVA. ****p < 0.0001, ***p < 0.001, and **p < 0.01.
Figure 4
Figure 4
The mAbs engage hIAPP protofibrils in human T2D. Immunofluorescence shows increased hIAPP protofibril staining in pancreatic islet tissue from a T2D donor compared to nondiabetic control with a) 07G10 and b) 10H04. c) Magnified inset shows co‐localization of protofibril signal and hIAPP aggregate signal detected by ThS staining with protofibril signal localized at the core of larger aggregates. mAb (magenta), ThS (yellow), nuclei (cyan). Co‐localization of protofibril signal and ThS signal is indicated by white arrowheads.
Figure 5
Figure 5
The mAbs detect hIAPP protofibrils in serum, delay disease progression, and increase survival. a) Treatment study experimental design. b) ELISA of mAbs in the detection of hIAPP protofibrils in serum from hIAPPTG/TG mice. Serum from healthy WT controls only showed a background level of signal and the signal is increased in sick versus healthy transgenic mice. n = 3 per group. c) Immunofluorescence imaging of WT, vehicle‐treated, and Ab‐treated mice showing that mAbs can engage hIAPP protofibrils at pancreatic islets. Insulin (magenta), mAb (yellow), nuclei (cyan). d) Fasting blood glucose level in vehicle‐ and mAb‐treated mice (10 mg kg−1). Vehicle (black), 07G10 (magenta), and 10H04 (teal). e) Kaplan–Meyer survival analysis. n = 10 per group; error bars represent S.E.M., ordinary one‐way ANOVA or log‐rank test. ****p < 0.0001, ***p < 0.001, **p < 0.01. BG = blood glucose. Panel (a) was created with BioRender.
Figure 6
Figure 6
The mAbs protect islets from macrophage‐driven β cell destruction. a) Immunofluorescence imaging of pancreatic islets from WT, vehicle‐control, and mAb‐treated mice showing that mAb treatment preserved the islet health of treated mice. Insulin (magenta), mAb (yellow), nuclei (cyan). b) Immunofluorescence imaging of pancreatic islets from WT, vehicle‐control, and mAb‐treated mice showing mAb treatment prevented islet apoptosis cleaved caspase 3 (magenta), mAb (yellow), and nuclei (cyan). c) Immunofluorescence imaging of pancreatic islets from WT, vehicle‐control, and mAb‐treated mice showing mAb treatment prevented increased macrophage infiltration seen with diabetic mice. Macrophage (magenta), mAb (yellow), nuclei (cyan). n = 2 per group, technical triplicates; error bars represent S.E.M.; ordinary one‐way ANOVA. ****p < 0.0001, ***p < 0.001, and **p < 0.01, ns = not significant.

References

    1. International Diabetes Federation , IDF Diabetes Atlas, 10th edn. Brussels, Belgium 2021. https://www.diabetesatlas.org.
    1. Dall T. M., Yang W., Halder P., Pang B., Massoudi M., Wintfeld N., Semilla A. P., Franz J., Hogan P. F., Diabetes Care 2014, 37, 3172. - PubMed
    1. Hostalek U., Clin. Diabetes Endocrinol. 2019, 5, 5. - PMC - PubMed
    1. Johnson K. H., O'Brien T. D., Westermark P., Diabetes 1991, 40, 310. - PubMed
    1. Zhang X.‐X., Pan Y.‐H., Huang Y.‐M., Zhao H.‐L., World J. Diabetes 2016, 7, 189. - PMC - PubMed

Publication types

LinkOut - more resources