. 2022 Oct 18;13(1):6149.
doi: 10.1038/s41467-022-33907-4.

Reprogramming of myeloid cells and their progenitors in patients with non-medullary thyroid carcinoma

Affiliations

Reprogramming of myeloid cells and their progenitors in patients with non-medullary thyroid carcinoma

Katrin Rabold et al. Nat Commun. .

Abstract

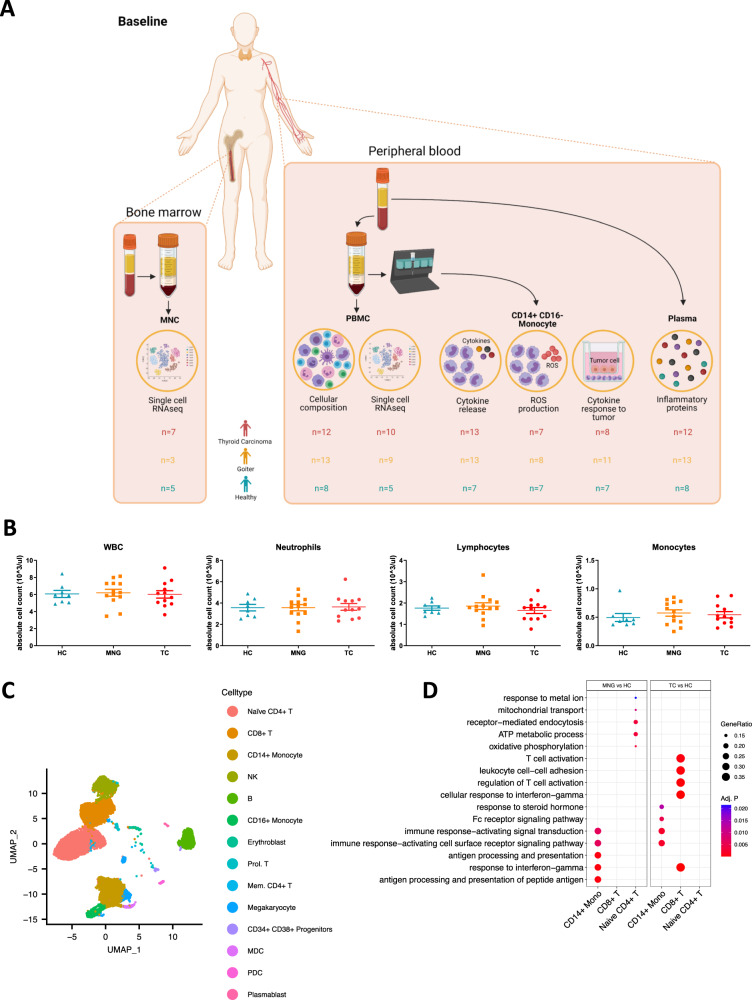
Myeloid cells, crucial players in antitumoral defense, are affected by tumor-derived factors and treatment. The role of myeloid cells and their progenitors prior to tumor infiltration is poorly understood. Here we show single-cell transcriptomics and functional analyses of the myeloid cell lineage in patients with non-medullary thyroid carcinoma (TC) and multinodular goiter, before and after treatment with radioactive iodine compared to healthy controls. Integrative data analysis indicates that monocytes of TC patients have transcriptional upregulation of antigen presentation, reduced cytokine production capacity, and overproduction of reactive oxygen species. Interestingly, these cancer-related pathological changes are partially removed upon treatment. In bone marrow, TC patients tend to shift from myelopoiesis towards lymphopoiesis, reflected in transcriptional differences. Taken together, distinct transcriptional and functional changes in myeloid cells arise before their infiltration of the tumor and are already initiated in bone marrow, which suggests an active role in forming the tumor immune microenvironment.


Conflict of interest statement

The authors declare no competing interests.

Figures

Fig. 1
Fig. 1. Graphical outline of study design and cell counts and single-cell transcriptomics of peripheral blood mononuclear cells.
A Study Design Baseline Measurements: Bone marrow and Peripheral blood were collected from Thyroid carcinoma (TC) patients, Multinodular Goiter (MNG) patients and Healthy Controls (HC). Illustration created with BioRender.com. B Box plot of cell counts in whole blood. (HC n = 8, MNG n = 13, TC n = 12) Mean ± SEM. One-way ANOVA followed by Bonferroni post hoc correction. C UMAP projection of the 16,161 PBMC-derived single cells from 24 samples (HC n = 5, MNG n = 9, TC n = 10). All the major cell types were identified using canonical markers (Fig. S1A). D GO term enrichment analysis of differentially expressed genes in MNG and TC, compared to HC. Over-representation analysis on the significantly differentially expressed genes for each relevant comparison was used to determine significance. P values were measured using the hypergeometric distribution and adjusted using Benjamini-Hochberg correction. Source data are provided as a Source Data file.
Fig. 2
Fig. 2. Single-Cell Transcriptomics of Bone Marrow-derived Mononuclear Cells.
A UMAP showing 275 CD34+ progenitor cells derived from bone marrow tissue from 15 samples (HC n = 5, MNG n = 3, TC n = 7). Canonical markers were used to annotate the different cell types (B). B Dot heatmap showing the expression of cell type markers used to annotate the bone marrow-derived progenitor cell types. C GO term enrichment analysis of the cell type-specific markers for each of the progenitor cell populations. Over-representation analysis was used to determine significance. P values were measured using the hypergeometric distribution and adjusted using Benjamini-Hochberg correction. D Box plots of cell proportions within the CD34+ progenitor cell populations derived from the bone marrow in healthy controls (n = 5), MNG (n = 7) and TC (n = 3). The center line per box plot refers to the median, bounds are the 25th and 75th percentiles (interquartile range; IQR). Box plot whiskers are the smallest and largest values no further than 1.5*IQR from the box plot bounds. No significant differences were found between the conditions. EG UMAP of the CD34+ progenitor cell populations, along with the PBMC-derived B cells. Colored by cell type, pseudo time and condition, respectively. H Volcano plots showing differential expression of (i) TC vs. HC, (ii) TC vs. MNG and (iii) MNG vs. HC within the myeloid multipotent progenitors. P values were obtained from the MAST test (two-sided) and adjusted using Bonferroni correction. I PCA plots showing the first two principal components of the pseudo-bulk RNAseq profile from the periphery (PBMC) and the bone marrow-derived mononuclear cells (BM-MNC). J Violin plots showing enrichment of the PBMC cell type-specific differentially expressed genes in BM-MNC cell populations (left), and vice-versa (right). Wilcoxon two-sided test between TC and HC for each cell type separately with Benjamini-Hochberg correction over all cell types for PBMCs and BM-MNCs separately. PBMCs p values <0.0001, BM-MNC p values <0.00001. Source data are provided as a Source Data file.
Fig. 3
Fig. 3. Functional phenotype of peripheral blood classical monocytes and circulating inflammatory markers.
A Cytokine release of CD14+ CD16- classical monocytes after 24 h stimulation with TLR4 ligand LPS. (HC n = 7, MNG n = 13, TC n = 13) Median with IQR. Corrected for age and sex. B ROS production of CD14+ CD16- classical monocytes during 1 h stimulation with PMA or opsonized zymosan. (HC n = 7, MNG n = 8, TC n = 7) Mean ± SEM. Corrected for age and sex. One-way ANOVA followed by Bonferroni correction. C Graphical illustration of co-culture experiment. CD14+ CD16 classical monocytes were indirectly co-cultured with TPC-1 cells by using a transwell system. Monocytes in the transwell were used as a control condition. After 24 h co-incubation the transwell with the tumor cells was discarded and the monocytes were stimulated with LPS for 24 h. Illustration created with BioRender.com. D Cytokine production of CD14+ CD16 classical monocytes after indirect co-culture with TPC-1 cells followed by 24 h LPS stimulation. (HC n = 7, MNG n = 11, TC n = 8) Paired data are connected by lines. Repeated measures two-way ANOVA followed by Bonferroni correction. Adjusted p values: TNFa HC p = 0.021, MNG p < 0.001, TC p = 0.004; IL-1b HC p = 0.014, TC p = 0.006, mono HC vs. MNG p = 0.043, MNG vs. TC p = 0.041; IL-6 MNG p < 0.001, TPC-1 HC vs. MNG p = 0.047, TC vs. MNG p = 0.002; IL-1Ra MNG p = 0.009. EG Comparison of circulating inflammatory mediators in peripheral blood plasma between groups. Volcano plots of fold change and p values for TC versus HC, MNG versus HC and TC versus MNG, respectively. Red circles (fold change >1.5 or <0.5 and p value <0.5) and blue circles (p value <0.5) show significantly enriched or depleted inflammatory markers. Green circles (fold change >1.5 or <0.5) show markers enriched or depleted, without reaching significance. Source data are provided as a Source Data file.
Fig. 4
Fig. 4. Effect of treatment on functional phenotype of peripheral blood classical monocytes and circulating inflammatory mediators in peripheral blood plasma.
A Study Design Follow-up Measurements: Peripheral blood was collected from TC and MNG patients before treatment (baseline), 30 days after surgery, 7 days and 30 days after treatment with radioactive iodine. Illustration created with BioRender.com. B Differential cell counts in whole blood. (HC n = 8, MNG n = 4–13, TC n = 8–13). Mean ± SEM. Mixed effects model (repeated measures two-way ANOVA with missing values) followed by Bonferroni correction. Each time point was compared to the baseline time point, as not all study participants received both treatments. Adjusted p values: MNG baseline vs. 7d post I131 p = 0.011, baseline vs. 30d post I131 p = 0.003; TC baseline vs. 7d post I131 p = 0.034. C Cytokine release of CD14+ CD16- classical monocytes after 24 h stimulation with TLR4 ligand LPS. (HC n = 7; MNG: baseline n = 13, 30d post-surgery n = 4, 7d post I131 n = 6, 30d post I131 n = 5; TC: baseline n = 13, 30d post-surgery n = 13, 7d post I131 n = 8, 30d post I131 n = 7). Median with IQR and Tukey whiskers. Corrected for age and sex. Mixed effects model (repeated measures two-way ANOVA with missing values) followed by Bonferroni correction. Each time point was compared to the baseline time point, as not all study participants received both treatments. D ROS production of CD14+ CD16 classical monocytes after 24 h stimulation with TLR4 ligand LPS. (HC n = 7, MNG: baseline n = 8, 30d post-surgery n = 2, 7d post I131 n = 5, 30d post I131 n = 4; TC: baseline n = 7, 30d post-surgery n = 9, 7d post I131 n = 6, 30d post I131 n = 4) Median with IQR and Tukey whiskers. Two-way ANOVA followed by Bonferroni correction. Corrected for age and sex. Source data are provided as a Source Data file.
Fig. 5
Fig. 5. Graphical summary of main findings.
A Baseline. B After treatment with radioactive treatment. Created with BioRender.com.

Similar articles

Cited by

References

    1. Larkin J, et al. Combined nivolumab and ipilimumab or monotherapy in untreated melanoma. N. Engl. J. Med. 2015;373:23–34. doi: 10.1056/NEJMoa1504030. - DOI - PMC - PubMed
    1. Larkin J, et al. Five-year survival with combined nivolumab and ipilimumab in advanced melanoma. N. Engl. J. Med. 2019;381:1535–1546. doi: 10.1056/NEJMoa1910836. - DOI - PubMed
    1. Hargadon KM, Johnson CE, Williams CJ. Immune checkpoint blockade therapy for cancer: an overview of FDA-approved immune checkpoint inhibitors. Int. Immunopharmacol. 2018;62:29–39. doi: 10.1016/j.intimp.2018.06.001. - DOI - PubMed
    1. Demaria O, et al. Harnessing innate immunity in cancer therapy. Nature. 2019;574:45–56. doi: 10.1038/s41586-019-1593-5. - DOI - PubMed
    1. Hanahan D, Weinberg RA. Hallmarks of cancer: the next generation. Cell. 2011;144:646–674. doi: 10.1016/j.cell.2011.02.013. - DOI - PubMed

Publication types