. 2022 Oct 19;13(1):6175.
doi: 10.1038/s41467-022-33956-9.

Suppression of heterotopic ossification in fibrodysplasia ossificans progressiva using AAV gene delivery

Affiliations

Suppression of heterotopic ossification in fibrodysplasia ossificans progressiva using AAV gene delivery

Yeon-Suk Yang et al. Nat Commun. .

Abstract

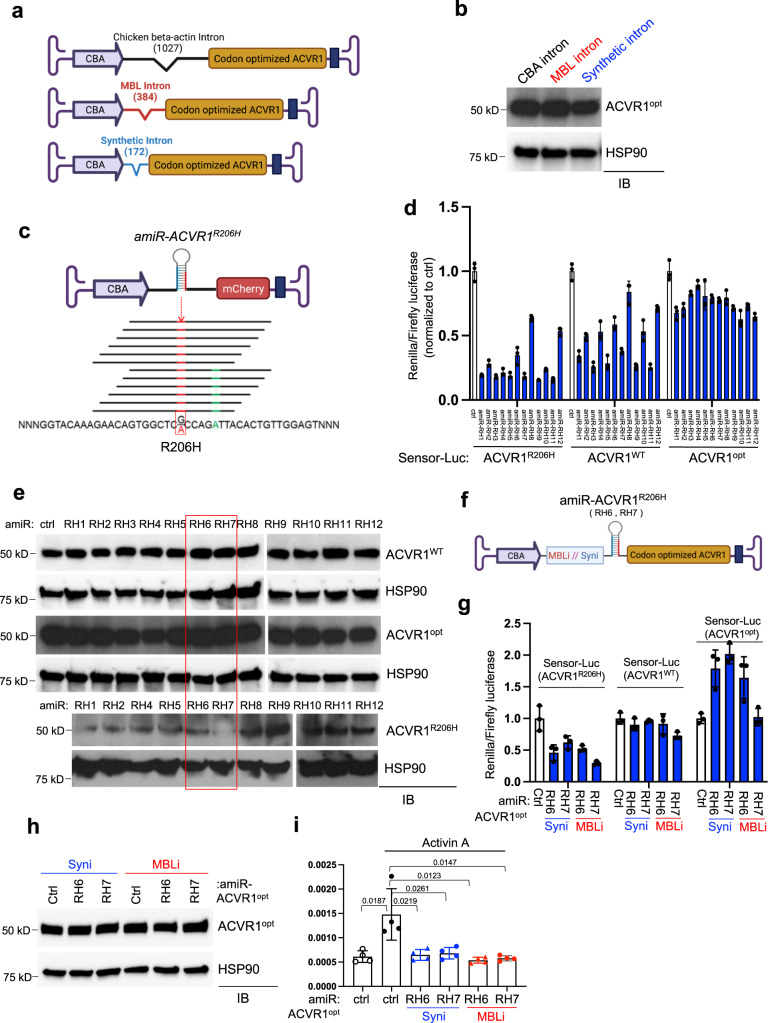
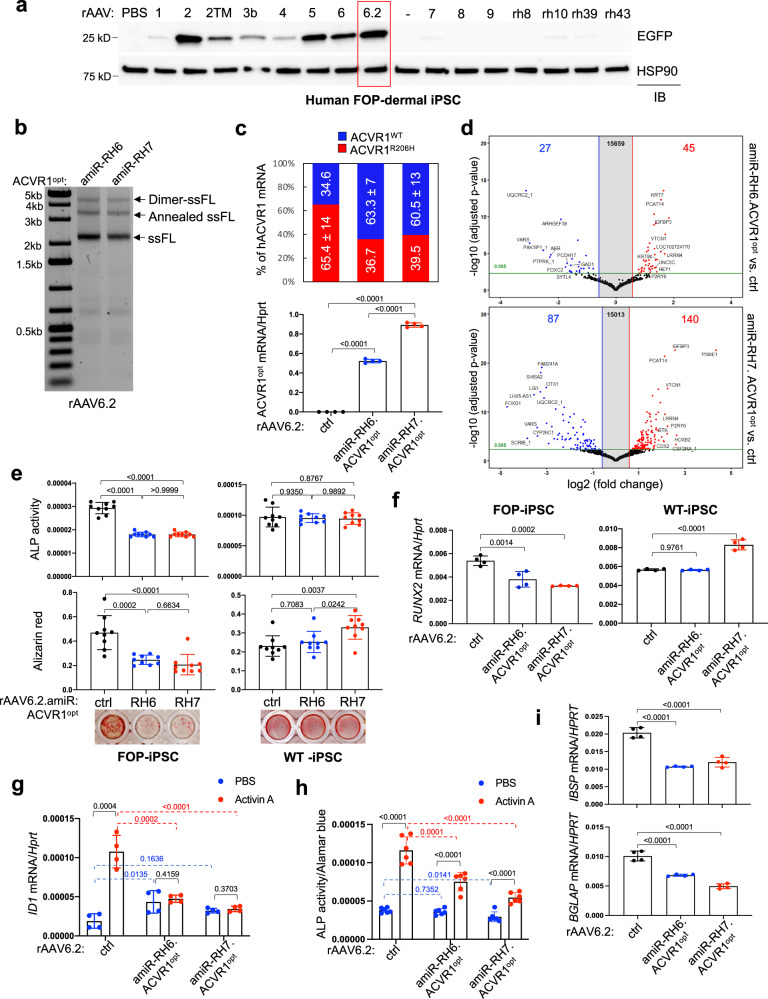
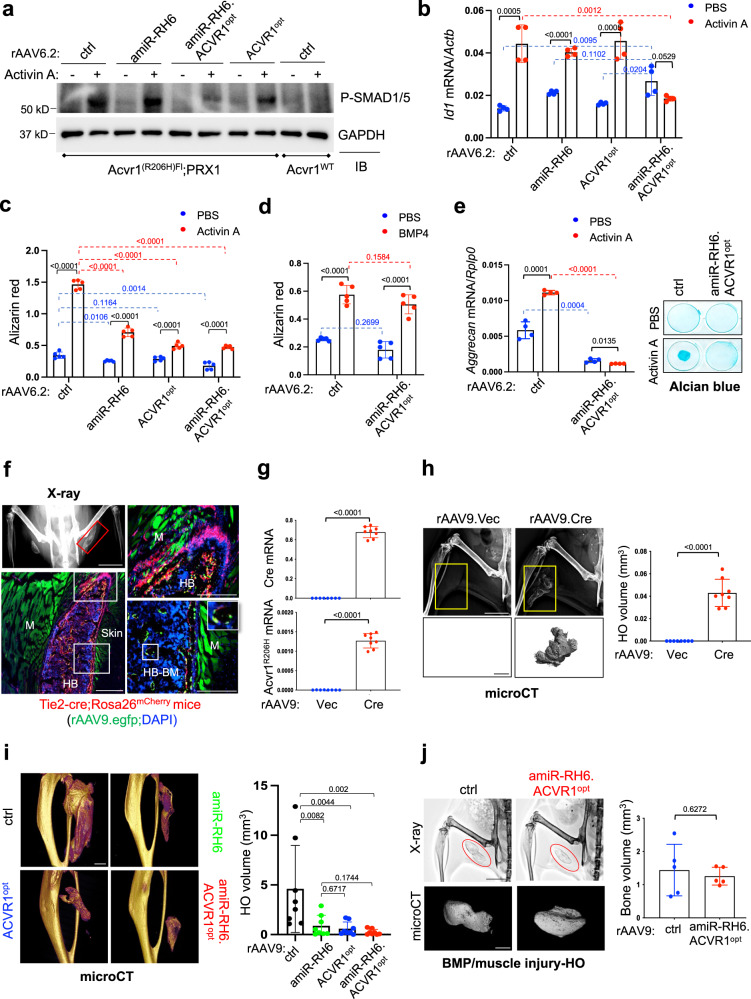
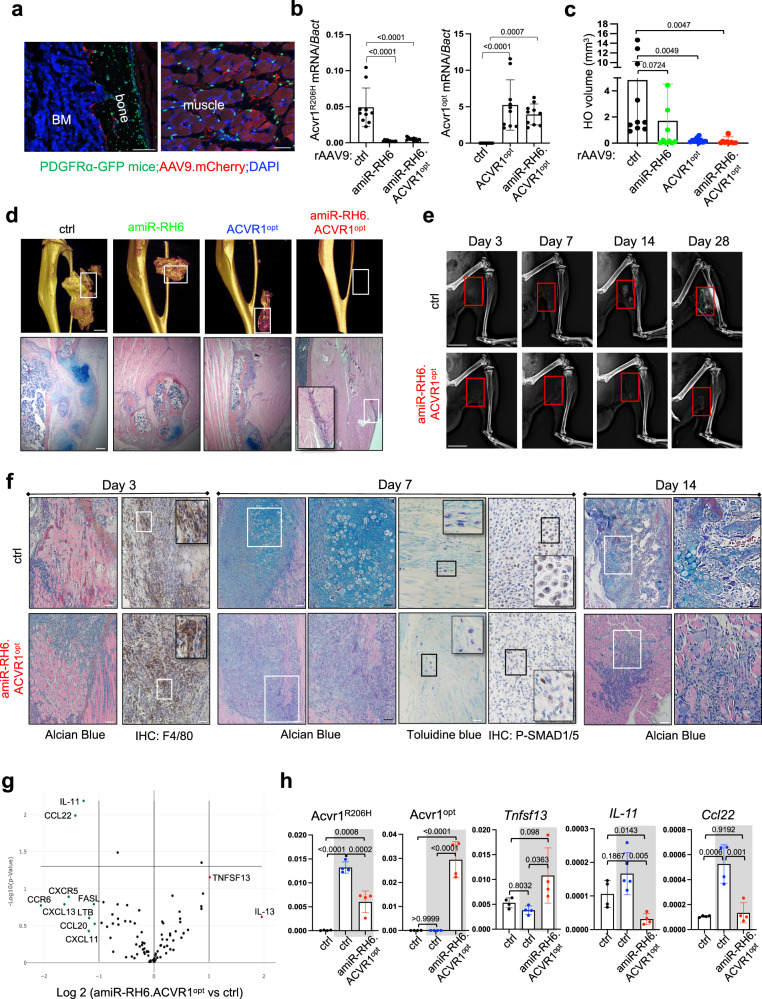
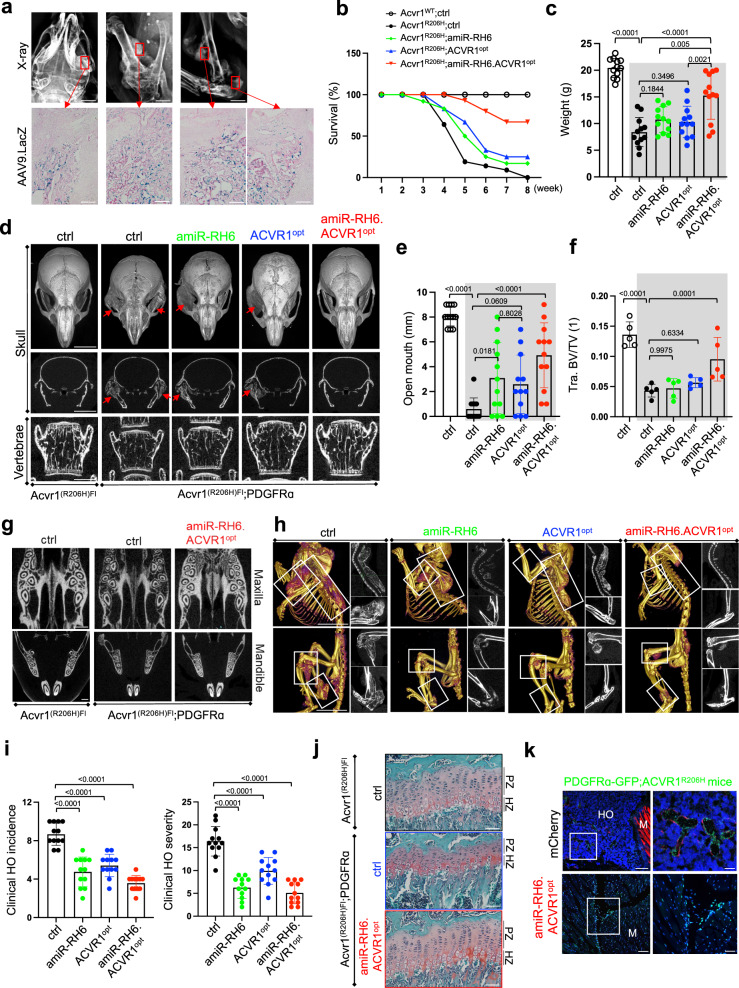
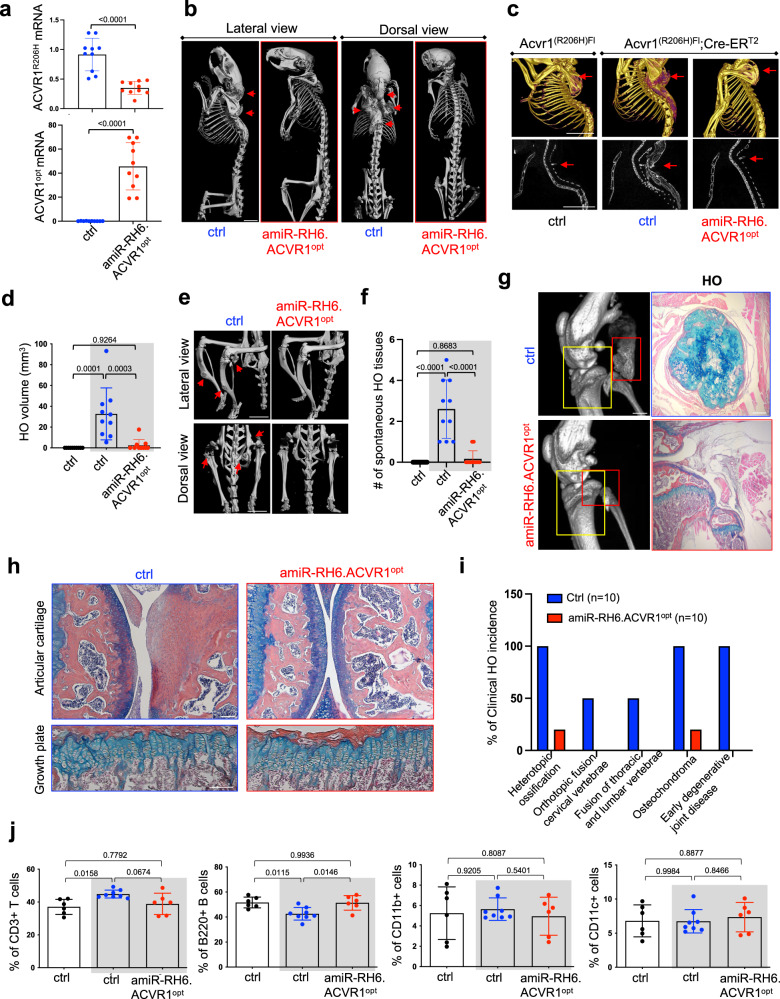
Heterotopic ossification is the most disabling feature of fibrodysplasia ossificans progressiva, an ultra-rare genetic disorder for which there is currently no prevention or treatment. Most patients with this disease harbor a heterozygous activating mutation (c.617 G > A;p.R206H) in ACVR1. Here, we identify recombinant AAV9 as the most effective serotype for transduction of the major cells-of-origin of heterotopic ossification. We use AAV9 delivery for gene replacement by expression of codon-optimized human ACVR1, ACVR1R206H allele-specific silencing by AAV-compatible artificial miRNA and a combination of gene replacement and silencing. In mouse skeletal cells harboring a conditional knock-in allele of human mutant ACVR1 and in patient-derived induced pluripotent stem cells, AAV gene therapy ablated aberrant Activin A signaling and chondrogenic and osteogenic differentiation. In Acvr1(R206H) knock-in mice treated locally in early adulthood or systemically at birth, trauma-induced endochondral bone formation was markedly reduced, while inflammation and fibroproliferative responses remained largely intact in the injured muscle. Remarkably, spontaneous heterotopic ossification also substantially decreased in in Acvr1(R206H) knock-in mice treated systemically at birth or in early adulthood. Collectively, we develop promising gene therapeutics that can prevent disabling heterotopic ossification in mice, supporting clinical translation to patients with fibrodysplasia ossificans progressiva.


Conflict of interest statement

G.G. and J.-H.S. have submitted a patent application concerning the methodology described in this study. G.G. and J.-H.S. are scientific co-founders of AAVAA Therapeutics and hold equity in this company. G.G. is also a scientific co-founder of Voyager Therapeutics and Aspa Therapeutics and holds equity in these companies. G.G. is an inventor on patents with potential royalties licensed to Voyager Therapeutics, Aspa Therapeutics Inc., and other biopharmaceutical companies. E.C.H. serves in a volunteer capacity on the registry advisory board of the IFOPA; on the International Clinical Council on FOP, and on the Fibrous Dysplasia Foundation Medical Advisory Board. E.C.H. received prior research support through his institution from Regeneron Pharmaceuticals. E.C.H. receives clinical trials research support through his institution from Clementia, an Ipsen company. F.S.K. is the founder and past-President of the International Clinical Council (ICC) on FOP. F.S.K. serves in a volunteer capacity on the registry advisory board of the IFOPA. F.S.K. is an investigator on clinical trials sponsored by Clementia, an Ipsen company, and by Regeneron Pharmaceuticals. E.M.S. serves in a volunteer capacity as a research advisor to the IFOPA. These pose no competing interests for this study. Other authors declare no competing interests.

Figures

Fig. 1
Fig. 1. Development of AAV vector targeting the human ACVR1R206H receptor.
a Schematic diagram of the plasmids expressing a codon-optimized version of the human ACVR1 complementary DNA (ACVR1opt) with the CBA promoter and three different introns (created with biorender.com). CBA: CMV enhancer/chicken β-actin promoter. b Validation of the expression of the ACVR1opt receptor. Plasmids expressing ACVR1opt were transiently transfected into HEK293 cells and cell lysates were subjected to immunoblotting with anti-ACVR1 antibody. Anti-HSP90 antibody was used as a loading control. c Schematic diagram representing 12 amiRs that target different sequence sites of human ACVR1R206H mRNA (amiR-ACVR1R206H). The red box indicates the R206H mutation site (c.617G>A). Adenine (green) was mismatched to increase the selectivity of gene silencing (created with biorender.com). d Plasmids encoding amiR-ctrl or 12 different amiRs were transiently transfected into HEK293 cells along with amiR-sensor plasmids (sensor-Luc) that contain Renilla luciferase and aimR complementary sequences for human ACVR1R206H, ACVR1WT, and ACVR1opt (n = 3). One day later, a luciferase assay was performed to measure Renilla luciferase and normalized it to firefly luciferase. Lower activities indicate higher silencing efficacy of amiRs. e Plasmids encoding amiR-ctrl or 12 different amiRs were transiently transfected into HEK293 cells along with a plasmid expressing human ACVR1R206H, ACVR1WT, or ACVR1opt cDNA and immunoblotted for ACVR1. Anti-HSP90 antibody was used for loading control. f Schematic diagram of the combination gene therapy constructs expressing amiR-ACVR1R206H (RH6 or RH7) and ACVR1opt cDNA under the CBA promoter and MBL intron (MBLi) or synthetic intron (Syni, created with biorender.com). g, h Plasmids encoding amiR-ctrl (ctrl), Syni.amiR-RH6.ACVR1opt, Syni.amiR-RH7.ACVR1opt, MBLi.amiR-RH6.ACVR1opt, or MBLi.amiR-RH7.ACVR1opt were transiently transfected into HEK293 cells along with sensor-Luc plasmids. Luciferase assay (g, n = 3) or immunoblotting analysis for ACVR1 (h) was performed. Anti-HSP90 antibody was used for loading control. i Plasmids were transiently transfected into HEK293 cells along with the BMP SMADs-responsive reporter gene (BRE-luc) and treated with Activin A (100 ng/ml, n = 4). 24 h later, Activin A signaling activity was measured by luciferase assay. Data are representative of three independent experiments (b, e). Values represent mean ± SD by an unpaired two-tailed Student’s t-test or one-way ANOVA test (i).
Fig. 2
Fig. 2. Effects of AAV gene therapy in human FOP iPSCs and mouse Acvr1(R206H)KI cells.
a Human FOP iPSCs were treated with PBS or 5 × 1010 genome copies (GCs) of 15 different AAV capsids packaged with the same CBA-Egfp transgene. 2 days later, EGFP expression was assessed by immunoblotting with an anti-GFP antibody. Anti-HSP90 antibody was used for loading control. b Genome integrity of rAAV6.2 carrying amiR-RH6.ACVR1opt or amiR-RH7.ACVR1opt was assessed by electrophoresis in the native gel. ssFL single-stranded full-length. c, d 5 × 1010 GCs of rAAV6.2 carrying EGFP control (ctrl), amiR-RH6.ACVR1opt, or amiR-RH7.ACVR1opt were transduced to human FOP iPSCs, cultured under osteogenic conditions for 4 days, and subjected to next-generation sequencing (NGS) for ratio expression: ACVR1R206H vs. ACVR1WT (c, top) or RT-PCR for ACVR1opt expression (c, bottom, n = 4). Alternatively, total RNA was subjected to bulk RNA sequencing (d, n = 2). A volcano plot showing the gene expression for up/downregulated genes in the cells expressing amiR-RH6.ACVR1opt or amiR-RH7.ACVR1opt relative to control-expressing cells is displayed. A volcano plot was generated from multiple t-test. e–g AAV-treated, human WT or FOP iPSCs were cultured under osteogenic conditions and alkaline phosphatase activity (ALP) and alizarin red staining were performed to assess early and late osteoblast differentiation, respectively (e, n = 9). Alternatively, osteogenic gene expression (RUNX2) was assessed by RT-PCR (f, n = 4). AAV-treated, human FOP iPSCs were incubated with PBS or Activin A (100 ng/ml) for 6 h, and ID1 mRNA levels were measured by RT-PCR (g, n = 4). h, i PDGFRα+Sca1+CD31CD45 FAPs were sorted by FACS from the digested skeletal muscle of 4-week-old Acvr1(R206H)Fl;PDGFRα-cre mice and transduced with 5 × 1010 GCs of AAV6.2 carrying EGFP control, amiR-RH6.ACVR1opt, or amiR-RH7.ACVR1opt. 2 days later, AAV-treated FAPs were cultured under osteogenic conditions with PBS or Activin A (50 ng/ml) for 6 days, and ALP activity (h, n = 6) and osteogenic gene expression (BGLAP, IBSP, i, n = 4) were assessed for osteoblast differentiation. Data are representative of three independent experiments (a, b). Values represent mean ± SD by an unpaired two-tailed Student’s t-test or one-way ANOVA test (e–i).
Fig. 3
Fig. 3. AAV gene therapy suppresses Activin A signaling and trauma-induced HO.
a–d PRRX1+ osteogenic progenitors isolated from 4-week-old PRRX1-cre (Acvr1WT) or Acvr1(R206H)Fl;PRRX1-cre femurs were transduced with 5 × 1010 GCs of AAV6.2, stimulated with Activin A for 30 min, and immunoblotted for phospho-SMAD1/5. Anti-GAPDH antibody was used for loading control (a). Id1 expression was assessed 6 h after Activin A stimulation (b, n = 4). AAV-treated cells were cultured under osteogenic conditions with PBS, Activin A (c, n = 5), or BMP4 (d, n = 5), and Alizarin red staining was performed. e PRRX1+ chondrogenic progenitors isolated from P2 Acvr1(R206H)Fl;PRRX1-cre neonates were transduced with AAV6.2, and cultured under chondrogenic conditions for 4 or 6 days. Aggrecan mRNA levels or Alcian blue staining were performed (n = 4). f rAAV9.egfp was t.d. injected into the quadricep of 2-month-old male Tie2-cre;Rosa26mCherry mice (red, n = 3) 1 week after i.m. injection with rBMP2/7/matrigel and muscle injury. 3 weeks later, radiography and histology of HO tissues were performed. The red box indicates a heterotopic bone (HB). M, muscle; HB-BM, heterotopic bone-bone marrow. Scale bars: 5 mm, left top; 500 µm, left bottom; 400 µm, right. g, h rAAV9 was t.d. injected into the hindlimb of 6-week-old male Acvr1R(R206H)Fl mice (n = 8), and muscle injury was introduced 3 days post-injection. 4 weeks later, ACVR1R206H and Cre recombinase expression was assessed by RT-PCR (g, n = 8) and HO was detected by radiography and quantified by microCT (h, n = 8). Scale bars: 5 mm, left top; 1 mm, left bottom. i rAAV9 was t.d. injected into the hindlimbs of 6-week-old female Acvr1R(R206H)Fl;Cre-ERT2 mice (n = 8) 3 days post-injection of tamoxifen. Muscle injury was applied 3 days post-injection. 4 weeks later, HO was assessed by microCT. Scale bar: 1 mm. j rAAV9 was t.d. injected into the quadricep of 2-month-old male WT mice (n = 5) followed by an rBMP2/7/matrigel injection and a muscle injury. 4 weeks later, HO was assessed by radiography and microCT. Scale bars: 5 mm, top; 1 mm, bottom. Data are representative of three independent experiments (a). Values represent mean ± SD by an unpaired two-tailed Student’s t-test or one-way ANOVA test (b–e, g–j).
Fig. 4
Fig. 4. Systemic delivery of AAV gene therapy at birth prevents traumatic HO in FOP mice.
a P1 PDGFRα-GFP reporter neonates (n = 3) were i.v. injected with 1011 GCs of rAAV9.mCherry and 2 weeks later, mCherry and GFP expression in AAV-treated tibia and muscle was assessed by fluorescence microscopy. BM bone marrow. Scale bars: 100 µm, left; 50 µm, right. b–d P1 Acvr1(R206H)Fl;Cre-ERT2 neonates (n = 10) were i.v. injected with 1011 GCs of rAAV9 carrying EGFP control, amiR-RH6, ACVR1opt, or amiR-RH6.ACVR1opt and 6 weeks later, mice were treated with tamoxifen (10 mg/kg). Muscle injury was applied to the gastrocnemius muscle 3 days post-tamoxifen treatment. 4 weeks later, mRNA levels of ACVR1R206H and ACVR1opt were measured by RT-PCR (b, n = 10) and HO in the gastrocnemius muscle was assessed by microCT and histology (c, d). 3D reconstruction images (d) and quantification of HO volume (c, n = 10) are displayed. Alcian blue staining of HO tissues (d) was performed to assess chondrogenic anlagen. Scale bars: 1 mm, top; 200 µm, bottom. e-h To investigate the progression of HO pathogenesis, P1 Acvr1R(R206H)Fl or Acvr1R(R206H)Fl;Cre-ERT2 neonates (n = 3) were i.v. injected with 1011 GCs of rAAV9 carrying EGFP control or amiR-RH6.ACVR1opt and 6 weeks later, mice were i.p. injected with tamoxifen. 3 days later, a Muscle injury was applied to the gastrocnemius muscle, and HO pathogenesis was assessed at a series of time points post-injury by radiography (heterotopic bone, e), at Day 3 by immunohistochemistry for F4/80 (monocytes/macrophages, f) and at Day 7 by Alcian blue staining (fibrosis, chondrogenesis, f) Toluidine blue staining (mast cells, f), and phospho-SMAD1/5 (BMP signaling, f). In (e), the red boxes indicate injured areas. RT2 profiler PCR array (g) and RT-PCR analysis (h, n = 4) for inflammatory gene expression were performed on the gastrocnemius muscle 3 days post-injury (day 3). A scatter plot was generated from multiple t-test. AAV-treated Acvr1R(R206H)Fl (control) and Acvr1R(R206H)Fl;Cre-ERT2 muscle RNA with and without amiR-RH6.ACVR1opt (gray boxes) are displayed (h). Scale bars: 5 mm, e; 100 µm, f Values represent mean ± SD by one-way ANOVA (b, c, h).
Fig. 5
Fig. 5. Systemic delivery of AAV gene therapy at birth prevents spontaneous HO in juvenile FOP mice.
a 5 × 1013 vg/kg of rAAV9.LacZ was i.v. injected into 3-week-old male or female Acvr1(R206H)Fl;PDGFRα-cre mice (n = 3) and, 2 weeks later, radiography of the whole body was performed to locate HO lesions. HO tissues were stained for β-galactosidase. Scale bars: 2 mm, top; 100 µm, bottom. For data shown in b–j, P1 Acvr1(R206H)Fl or Acvr1(R206H)Fl;PDGFRα-cre neonates (n = 12) were i.v. injected with 1011 GCs of rAAV9 and AAV-treated mice were analyzed weekly up to 8 weeks of age. b and c Survival curve (b) and body weight (c) for the AAV-treated groups. d MicroCT analysis for skulls and lumbar vertebrae (L4) of 4 to 5-week-old mice are shown in 3D reconstructed images (d, top) and 2D transverse sections (d, middle and bottom). Scale bars: 5 mm, top, middle; 1 mm, bottom. Arrows indicate temporomandibular joint ankylosis. e and f Plots showing the distance of open mouth in AAV-treated mice (e, n = 12) and the quantification of vertebral bone mass (f, n = 5). AAV-treated Acvr1R(R206H)Fl and Acvr1(R206H)Fl;PDGFRα-cre mice (gray boxes) are displayed (c, e, f). Tra. BV/TV trabecular bone volume per tissue volume. g MicroCT analysis showing the maxillary and mandibular bone mass. Scale bar: 1 mm. h MicroCT analysis showing spontaneous HO from whole body scans of AAV-treated mice. 3D reconstructed images (left) and 2D transverse sections (right) are displayed. Scale bars: 4 mm. i Clinical HO incidence and severity was scored using whole-body microCT and radiography (n = 12). j Safranin O staining of AAV-treated tibias showing normal chondrocyte zones in the growth plate. Scale bars: 50 µm. k P1 Acvr1(R206H)Fl;PDGFRα-cre;PDGFRα-GFP reporter neonates were i.v. injected with 1011 GCs of rAAV9 (n = 3) and 5 weeks later, mCherry- and/or GFP-expressing cells were visualized by fluorescence microscopy. The right panels are enlarged images of the white-boxed regions on the left. Scale bars: 100 µm, left; 50 µm, right. Values represent mean ± SD by one-way ANOVA test (c, e, f, i).
Fig. 6
Fig. 6. Systemic delivery of AAV gene therapy in early adulthood prevents spontaneous HO in adult FOP mice.
5 × 1013 vg/kg of rAAV9 carrying EGFP control or amiR-RH6.ACVR1opt was i.v. injected into 6-week-old female Acvr1(R206H)Fl or Acvr1(R206H)Fl;Cre-ERT2 mice (n = 10) 3 days after tamoxifen treatment. 12 weeks later, mRNA levels of ACVR1R206H and ACVR1opt in the liver were assessed by RT-PCR (a) MicroCT analysis showing whole body (b), torso (c), and lower body (e) of AAV-treated mice. Arrows indicate HO lesions. Scale bars: 5 mm, b; 1 mm, c, e Total HO volume (d, n = 10) and numbers of HO lesions (f, n = 10) throughout the body were quantitated. MicroCT (g, left) and histology of knee joints were performed to assess bridging HO (g, right), degeneration of articular cartilage (h, top), and chondrocytes in the growth plate (h, bottom). In g, the red box, bridging HO; yellow box, articular cartilage, and growth plate. Scale bars: 1 mm, g, left; 100 µm, g, right. Total percentage of clinical HO incidence in AAV-treated mice was assessed (i) The frequency of immune cells within the population of total splenocytes suggests that rAAV9.amiR-RH6.ACVR1opt has little to no effect on systemic immunity (j, n = 6–8). AAV-treated Acvr1R(R206H)Fl (control) and Acvr1(R206H)Fl;Cre-ERT2 mice (gray boxes) are displayed (d, f, j). Values represent mean ± SD by an unpaired two-tailed Student’s t-test (a) or ANOVA test (d, f, j).

Similar articles

Cited by

References

    1. Pignolo RJ, et al. Prevalence of fibrodysplasia ossificans progressiva (FOP) in the United States: estimate from three treatment centers and a patient organization. Orphanet J. Rare Dis. 2021;16:350. doi: 10.1186/s13023-021-01983-2. - DOI - PMC - PubMed
    1. Kaplan FS, et al. Fibrodysplasia ossificans progressiva. Best Pract. Res. Clin. Rheumatol. 2008;22:191–205. doi: 10.1016/j.berh.2007.11.007. - DOI - PMC - PubMed
    1. Shore EM, Kaplan FS. Insights from a rare genetic disorder of extra-skeletal bone formation, fibrodysplasia ossificans progressiva (FOP) Bone. 2008;43:427–433. doi: 10.1016/j.bone.2008.05.013. - DOI - PMC - PubMed
    1. Shore EM, et al. A recurrent mutation in the BMP type I receptor ACVR1 causes inherited and sporadic fibrodysplasia ossificans progressiva. Nat. Genet. 2006;38:525–527. doi: 10.1038/ng1783. - DOI - PubMed
    1. Hino K, et al. Neofunction of ACVR1 in fibrodysplasia ossificans progressiva. Proc. Natl Acad. Sci. USA. 2015;112:15438–15443. doi: 10.1073/pnas.1510540112. - DOI - PMC - PubMed

Publication types