. 2023 Feb;28(1-2):136-165.
doi: 10.1007/s10495-022-01778-1. Epub 2022 Oct 18.

Role of C-terminal domain of Mycobacterium tuberculosis PE6 (Rv0335c) protein in host mitochondrial stress and macrophage apoptosis

Affiliations

Role of C-terminal domain of Mycobacterium tuberculosis PE6 (Rv0335c) protein in host mitochondrial stress and macrophage apoptosis

Medha et al. Apoptosis. 2023 Feb.

Abstract

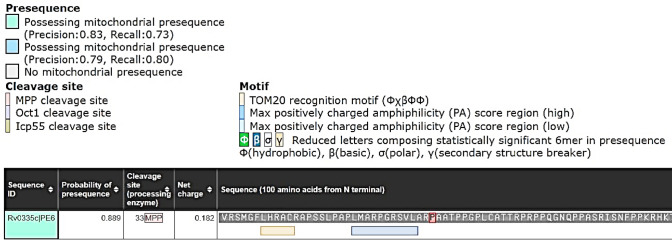
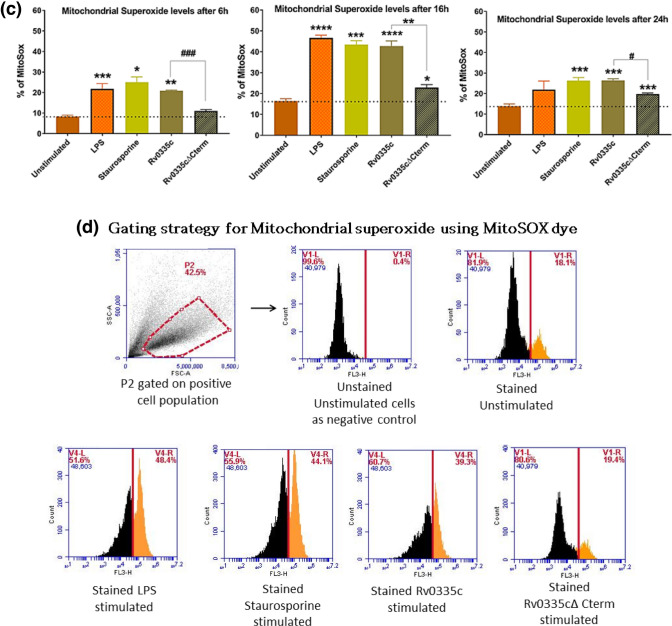
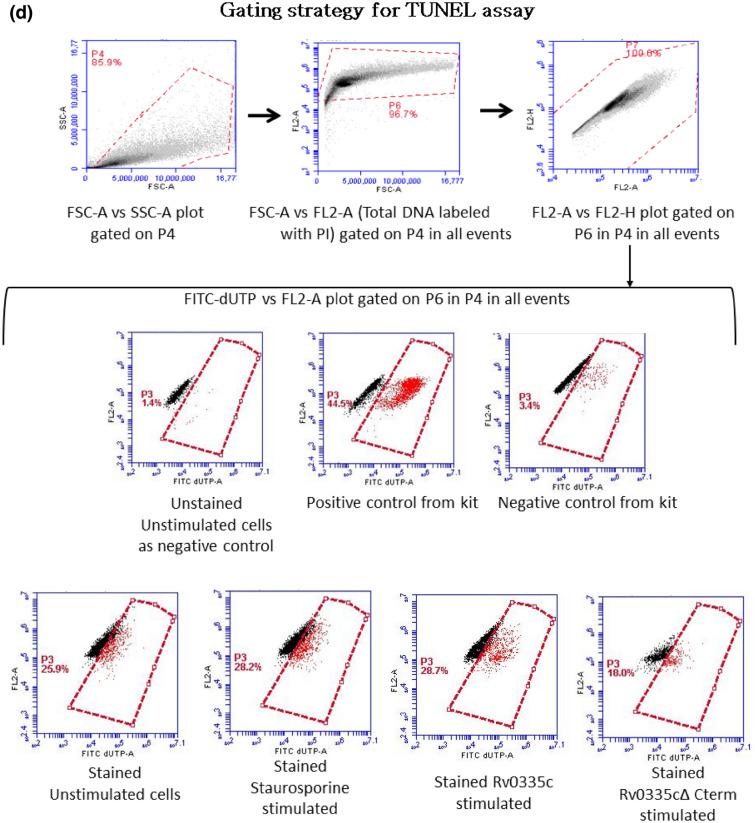
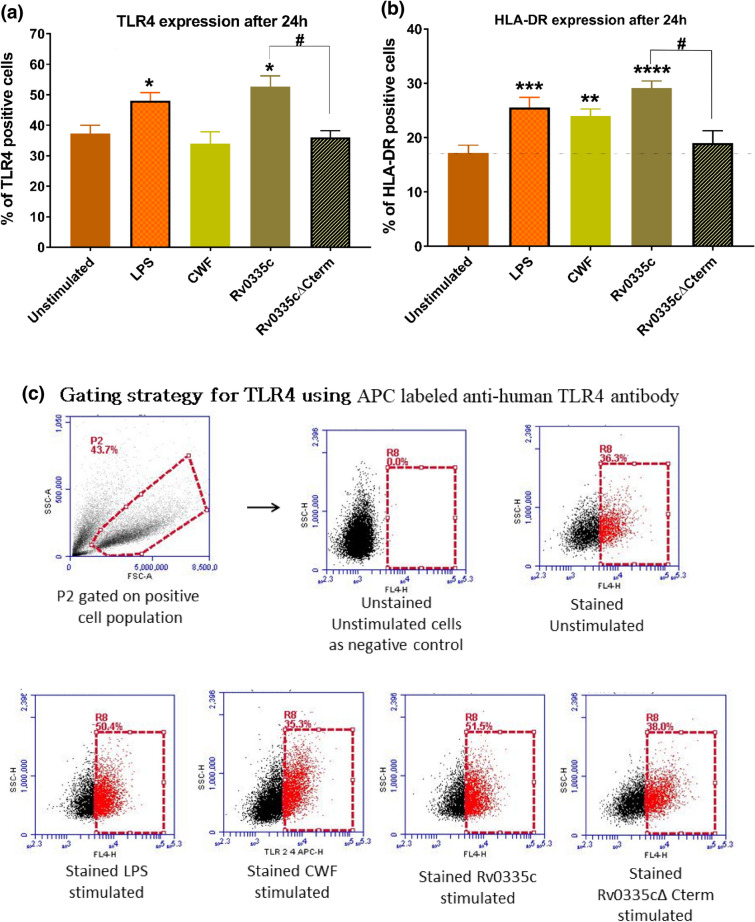
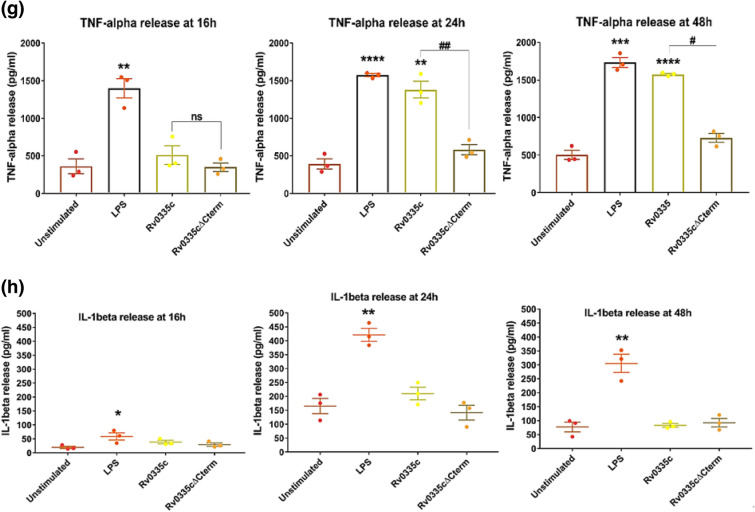
PE/PPE proteins of Mycobacterium tuberculosis (Mtb) target the host organelles to dictate the outcome of infection. This study investigated the significance of PE6/Rv0335c protein's unique C-terminal in causing host mitochondrial perturbations and apoptosis. In-silico analysis revealed that similar to eukaryotic apoptotic Bcl2 proteins, Rv0335c had disordered, hydrophobic C-terminal and two BH3-like motifs in which one was located at C-terminal. Also, Rv0335c's N terminal had mitochondrial targeting sequence. Since, C-terminal of Bcl2 proteins are crucial for mitochondria targeting and apoptosis; it became relevant to evaluate the role of Rv0335c's C-terminal domain in modulating host mitochondrial functions and apoptosis. To confirm this, in-vitro experiments were conducted with Rv0335c whole protein and Rv0335c∆Cterm (C-terminal domain deleted Rv0335c) protein. Rv0335c∆Cterm caused significant reduction in mitochondrial perturbations and Caspase-mediated apoptosis of THP1 macrophages in comparison to Rv0335c. However, the deletion of C-terminal domain didn't affect Rv0335c's ability to localize to mitochondria. Nine Ca2+ binding residues were predicted within Rv0335c and four of them were at the C-terminal. In-vitro studies confirmed that Rv0335c caused significant increase in intracellular calcium influx whereas Rv0335c∆Cterm had insignificant effect on Ca2+ influx. Rv0335c has been reported to be a TLR4 agonist and, we observed a significant reduction in the expression of TLR4-HLA-DR-TNF-α in response to Rv0335c∆Cterm protein also suggesting the role of Rv0335c's C-terminal domain in host-pathogen interaction. These findings indicate the possibility of Rv0335c as a molecular mimic of eukaryotic Bcl2 proteins which equips it to cause host mitochondrial perturbations and apoptosis that may facilitate pathogen persistence.

Keywords: BH3-like motif; Mitochondria-mediated intrinsic apoptosis; Mycobacterium tuberculosis; Rv0335c; Unique C-terminal domain.


Conflict of interest statement

The authors have no competing interests to declare.

Figures

Fig. 1
Fig. 1
Mitochondrial localization of Rv0335c protein predicted by MitoFates server. Rv0335c protein is predicted to contain mitochondrial targeting pre-sequence with cleavage site for mitochondrial processing peptidases and recognition site for TOM20 in MitoFates server (Color figure online)
Fig. 2
Fig. 2
Rv0335c protein is mostly disordered, hydrophobic, contains BH3-like motif and has similarities with mitochondria targeting pro-apoptotic eukaryotic Bcl2 proteins. a Rv0335c protein was predicted to be mostly disordered and composed of hydrophobic amino acid residues. Additionally, the protein was found to contain two typical BH3-like motifs. BH3 motifs are exclusive in eukaryotic Bcl2 proteins. b Rv0335c protein of Mtb shares similarities with mitochondria targeted pro-apoptotic Bcl2 proteins in terms of being intrinsically unstructured, hydrophobic C-terminal domain and presence of BH3 motifs (Color figure online)
Fig. 3
Fig. 3
Defining the C-terminal domain in Rv0335c followed by its multiple sequence alignment and structural superimposition with eukaryotic pro-apoptotic Bcl2 proteins. a The C-terminal domain in Rv0335c protein was defined from amino acid position 120 to 166 in brackets ({}). This stretch was disordered, hydrophobic and contains a terminally located BH3-like motif in Rv0335c protein. b Multiple sequence alignment of C-terminal domain of Rv0335c and C-terminal domain of mitochondria targeted eukaryotic pro-apoptotic Bcl2 proteins. c Multiple sequence alignment and structural superimposition of BH3-like motif containing C-terminal domain of Rv0335c with BH3 motif containing stretch of mitochondria targeted eukaryotic pro-apoptotic Bid and Hrk proteins (Color figure online)
Fig. 4
Fig. 4
Confocal microscopy analysis showing the mitochondrial localization of recombinant proteins. THP1 macrophages were left unstimulated stained with Alexa-fluor488 dye/Alexa-fluor488-labeled Rv0335c protein/Alexa-fluor488-labeled Rv0335cΔCterm protein and incubated till 24 h. Following stimulation, cells were stained with MitoSpy Red CMXRos followed by DAPI as per manufacturer’s protocol and fixed in 4% formaldehyde. Confocal microscopy confirmed the localization of both Rv0335c and Rv0335cΔCterm proteins within mitochondria of THP1 macrophages. a Confocal microscopy (cross-sectional images of fluorescence signal at step size of 0.5 micron and 63X magnification) confirmed the localization of recombinant proteins within mitochondria of THP1 macrophages [Panel 1: Differential interface contrast image, Panel 2: Alexafluor488 labeled protein stimulation/ only Alexafluor488 dye in unstimulated, Panel 3: Mitospy CMXRos mitochondrial dye, Panel 4: DAPI nuclear stain, Merge 1: Panel (2 + 3 + 4), Merge 2: Panel (2 + 3)]. b Cross-sectional confocal images were analyzed in ImageJ software and RGB plots and 3D surface plot depicting the fluorescence intensity showed higher mitochondrial localization of recombinant proteins in a time dependent manner (c) JACoP (Just Another Colocalization Plugin) plugin in ImageJ was used to calculate the Pearson’s Coefficient (r) of mitochondrial localization of recombinant proteins. RGB Plot depicts a time dependent decrease in MitoSpy CMXRos dye intensity indicating a time dependent decrease in mitochondrial membrane potential (Color figure online)
Fig. 4
Fig. 4
Confocal microscopy analysis showing the mitochondrial localization of recombinant proteins. THP1 macrophages were left unstimulated stained with Alexa-fluor488 dye/Alexa-fluor488-labeled Rv0335c protein/Alexa-fluor488-labeled Rv0335cΔCterm protein and incubated till 24 h. Following stimulation, cells were stained with MitoSpy Red CMXRos followed by DAPI as per manufacturer’s protocol and fixed in 4% formaldehyde. Confocal microscopy confirmed the localization of both Rv0335c and Rv0335cΔCterm proteins within mitochondria of THP1 macrophages. a Confocal microscopy (cross-sectional images of fluorescence signal at step size of 0.5 micron and 63X magnification) confirmed the localization of recombinant proteins within mitochondria of THP1 macrophages [Panel 1: Differential interface contrast image, Panel 2: Alexafluor488 labeled protein stimulation/ only Alexafluor488 dye in unstimulated, Panel 3: Mitospy CMXRos mitochondrial dye, Panel 4: DAPI nuclear stain, Merge 1: Panel (2 + 3 + 4), Merge 2: Panel (2 + 3)]. b Cross-sectional confocal images were analyzed in ImageJ software and RGB plots and 3D surface plot depicting the fluorescence intensity showed higher mitochondrial localization of recombinant proteins in a time dependent manner (c) JACoP (Just Another Colocalization Plugin) plugin in ImageJ was used to calculate the Pearson’s Coefficient (r) of mitochondrial localization of recombinant proteins. RGB Plot depicts a time dependent decrease in MitoSpy CMXRos dye intensity indicating a time dependent decrease in mitochondrial membrane potential (Color figure online)
Fig. 5
Fig. 5
C-terminal domain in Rv0335c had role in inducing host mitochondrial perturbations. THP1 macrophages were left unstimulated or stimulated with controls or recombinant proteins (10 μg/ml) and incubated for varied time points. a Mitochondrial Membrane Potential (MMP) was estimated using JC1 dye post 6 h, 16 h and 24 h of stimulation. b Gating strategy has been depicted using dot plot where JC1 monomers are represented in green fluorescence and JC1 aggregates are in red. c Mitochondrial superoxide levels were estimated following 6 h, 16 h and 24 h of stimulation using MitoSox dye. d Histogram depicts the gating strategy where orange fluorescence represents the percentage of Mitochondrial superoxide levels in cells. e Release of Cyt C in cell cytosol was assessed with FITC labeled anti-Cyt C antibody. f Dot plot represents the gating strategy where percentage of cytoplasmic Cyt C is indicated in red. Graphs were plotted with ratio of ratio of red aggregates/green monomer median fluorescence intensity, % of mitochondrial superoxides or cytoplasmic Cyt C on y axis and control/test protein on x axis. Data was inferred using Student’s t test and depicted results are Mean ± SEM of three independent experiments where * represents comparison between control/proteins and unstimulated while # represents comparison between Rv0335c and Rv0335cΔCterm. (#,*) P < 0.05, (##,**)P < 0.01, (###,***)P < 0.001 (Color figure online)
Fig. 5
Fig. 5
C-terminal domain in Rv0335c had role in inducing host mitochondrial perturbations. THP1 macrophages were left unstimulated or stimulated with controls or recombinant proteins (10 μg/ml) and incubated for varied time points. a Mitochondrial Membrane Potential (MMP) was estimated using JC1 dye post 6 h, 16 h and 24 h of stimulation. b Gating strategy has been depicted using dot plot where JC1 monomers are represented in green fluorescence and JC1 aggregates are in red. c Mitochondrial superoxide levels were estimated following 6 h, 16 h and 24 h of stimulation using MitoSox dye. d Histogram depicts the gating strategy where orange fluorescence represents the percentage of Mitochondrial superoxide levels in cells. e Release of Cyt C in cell cytosol was assessed with FITC labeled anti-Cyt C antibody. f Dot plot represents the gating strategy where percentage of cytoplasmic Cyt C is indicated in red. Graphs were plotted with ratio of ratio of red aggregates/green monomer median fluorescence intensity, % of mitochondrial superoxides or cytoplasmic Cyt C on y axis and control/test protein on x axis. Data was inferred using Student’s t test and depicted results are Mean ± SEM of three independent experiments where * represents comparison between control/proteins and unstimulated while # represents comparison between Rv0335c and Rv0335cΔCterm. (#,*) P < 0.05, (##,**)P < 0.01, (###,***)P < 0.001 (Color figure online)
Fig. 6
Fig. 6
C-terminal domain in Rv0335c depleted the intracellular ATP levels and increased the intracellular Ca2+ influx. THP1 macrophages were left unstimulated or stimulated with controls or recombinant proteins (10 μg/ml) and incubated for varied time points. a ADP/ATP ratio was estimated using plate-based bioluminescence assay. b Ca2+binding affinity was predicted for Rv0335c using MIB server. Nine Ca2+ binding residues were predicted with four residues in the C-terminal domain of Rv0335c. c Ca2+ influx was measured by ratio of Mean Fluorescence Intensity (MFI) of 494-nm excitation (bound Ca2+) using flow cytometer. Graphs were plotted with ADP/ATP ratio or MFI of Indo-1AM depicting Ca2+ influx on y axis and control/test protein on x axis. Data was inferred using Student’s t test and depicted results are Mean ± SEM of three independent experiments where * represents comparison between control/proteins and unstimulated while # represents comparison between Rv0335c and Rv0335cΔCterm. (#,*) P < 0.05, (##,**)P < 0.01, (###,***)P < 0.001. d Overlay plot for analysis of Ca2+ influx using flow cytometry (Color figure online)
Fig. 7
Fig. 7
AnnexinV/PI assay and TUNEL assay to estimate apoptosis in recombinant protein stimulated THP1 macrophages using Flow cytometry. Unstimulated/control/recombinant proteins stimulated THP1 macrophages were incubated for 16 h, 24 h and 48 h. Annexin V-FITC and PI staining of cells was performed followed by acquisition in Flow Cytometer. (a) Time dependent graphs showing percentage of AnnexinV positive cells plotted on y axis and samples on x axis. (b) Gating strategy for analyzing the AnnexinV positive cells where cells in lower right quadrant (green) represents early apoptotic cells, cells in upper right quadrant (pink) represents late apoptotic cells and cells in upper left quadrant represents necrotic cells. c) DNA breaks in response to protein stimulation was estimated with TUNEL assay. d) Gating strategy adopted for TUNEL assay. Data was inferred using Student’s t test and depicted results are Mean ± SEM of three independent experiments where * represents comparison between control/proteins and unstimulated while # represents comparison between Rv0335c and Rv0335cΔCterm. (#,*)P < 0.05, (##,**)P < 0.01, (###,***)P < 0.001 (Color figure online)
Fig. 7
Fig. 7
AnnexinV/PI assay and TUNEL assay to estimate apoptosis in recombinant protein stimulated THP1 macrophages using Flow cytometry. Unstimulated/control/recombinant proteins stimulated THP1 macrophages were incubated for 16 h, 24 h and 48 h. Annexin V-FITC and PI staining of cells was performed followed by acquisition in Flow Cytometer. (a) Time dependent graphs showing percentage of AnnexinV positive cells plotted on y axis and samples on x axis. (b) Gating strategy for analyzing the AnnexinV positive cells where cells in lower right quadrant (green) represents early apoptotic cells, cells in upper right quadrant (pink) represents late apoptotic cells and cells in upper left quadrant represents necrotic cells. c) DNA breaks in response to protein stimulation was estimated with TUNEL assay. d) Gating strategy adopted for TUNEL assay. Data was inferred using Student’s t test and depicted results are Mean ± SEM of three independent experiments where * represents comparison between control/proteins and unstimulated while # represents comparison between Rv0335c and Rv0335cΔCterm. (#,*)P < 0.05, (##,**)P < 0.01, (###,***)P < 0.001 (Color figure online)
Fig. 8
Fig. 8
Estimation of Caspase 9, Caspase 3 and 7 activations in recombinant proteins stimulated THP1 macrophages. a Western blot image showing the activation of Caspase9 in THP-1 macrophages left unstimulated or stimulated LPS/Rv2615c protein. Post 24 of stimulation, cell lysate was prepared and fractionated on SDS-PAGE, and proteins were transferred onto the PVDF membrane. Activated Caspase9 levels were estimated using the polyclonal antibody to Caspase9 and an internal loading control GAPDH used at dilution 1:1000. b The area of each western blot band was quantified using ImageJ software. Results were analyzed by plotting ratio of each band area with respect to unstimulated cells and are depicted as Mean ± SEM values of three independent experiments. Student’s t test was performed where * depicts the comparison with unstimulated cells for each protein separately. c Unstimulated/control/recombinant proteins stimulated THP1 macrophages were incubated for different time points (16 h, 24 h and 48 h) and activation of Caspase 3 and 7 was estimated which is a characteristic of intrinsic apoptosis. d Gating strategy for Caspase 3 and 7 assay using flow cytometry. THP1 cells were also blocked with z-VAD-fmk Caspase inhibitor prior to stimulation and evaluated for c) levels of Caspases 3 and 7 and d) expression of AnnexinV cell population at 24 h. Data was inferred using Student’s t test and depicted results are Mean ± SEM of three independent experiments where * represents comparison between control/proteins and unstimulated while # represents comparison between Rv0335c and Rv0335cΔCterm. (#,*)P < 0.05, (##,**)P < 0.01, (###,***)P < 0.001. (####,****)P < 0.0001 (Color figure online)
Fig. 8
Fig. 8
Estimation of Caspase 9, Caspase 3 and 7 activations in recombinant proteins stimulated THP1 macrophages. a Western blot image showing the activation of Caspase9 in THP-1 macrophages left unstimulated or stimulated LPS/Rv2615c protein. Post 24 of stimulation, cell lysate was prepared and fractionated on SDS-PAGE, and proteins were transferred onto the PVDF membrane. Activated Caspase9 levels were estimated using the polyclonal antibody to Caspase9 and an internal loading control GAPDH used at dilution 1:1000. b The area of each western blot band was quantified using ImageJ software. Results were analyzed by plotting ratio of each band area with respect to unstimulated cells and are depicted as Mean ± SEM values of three independent experiments. Student’s t test was performed where * depicts the comparison with unstimulated cells for each protein separately. c Unstimulated/control/recombinant proteins stimulated THP1 macrophages were incubated for different time points (16 h, 24 h and 48 h) and activation of Caspase 3 and 7 was estimated which is a characteristic of intrinsic apoptosis. d Gating strategy for Caspase 3 and 7 assay using flow cytometry. THP1 cells were also blocked with z-VAD-fmk Caspase inhibitor prior to stimulation and evaluated for c) levels of Caspases 3 and 7 and d) expression of AnnexinV cell population at 24 h. Data was inferred using Student’s t test and depicted results are Mean ± SEM of three independent experiments where * represents comparison between control/proteins and unstimulated while # represents comparison between Rv0335c and Rv0335cΔCterm. (#,*)P < 0.05, (##,**)P < 0.01, (###,***)P < 0.001. (####,****)P < 0.0001 (Color figure online)
Fig. 9
Fig. 9
Molecular docking of Rv0335c/Rv0335cΔCterm proteins with TLR4. HADDOCK server predicted docked complex of Rv0335c (yellow) and Rv0335cΔCterm (orange) bound to TLR4 (blue). The details of each docked complex are enlisted in the figure. The C-terminal domain of Rv0335c protein enhances its binding affinity with TLR4 receptor (Color figure online)
Fig. 10
Fig. 10
Expression profile of TLRs, HLA-DR, TNF-α and IL-1β in Rv0335c/Rv0335cΔCterm-stimulated THP1 macrophages. Unstimulated/control/recombinant proteins stimulated THP1 macrophages were incubated for 24 h and expression profile of a TLR4, b HLA-DR and g soluble TNF-α and h) soluble IL-1β were evaluated. THP1 cells were also blocked with Anti-TLR4 antibody prior to stimulation and evaluated for levels of e TLR4 and f HLA-DR at 24 h. Graphs were plotted for different time points with % of TLR/HLA-DR positive cells or pg/ml of TNF-α/IL-1β on y axis and recombinant proteins/control on x axis. Statistical analysis was done with Student’s t test and results are Mean ± SEM of three independent experiments where * represents comparison between control/proteins and unstimulated while # represents comparison between Rv0335c and Rv0335cΔCterm. (#,*)P < 0.05, (##,**)P < 0.01, (###,***)P < 0.001. (####,****)P < 0.0001. Gating strategy adopted for evaluating the surface expression of c) TLR4 and d) HLA-DR (Color figure online)
Fig. 10
Fig. 10
Expression profile of TLRs, HLA-DR, TNF-α and IL-1β in Rv0335c/Rv0335cΔCterm-stimulated THP1 macrophages. Unstimulated/control/recombinant proteins stimulated THP1 macrophages were incubated for 24 h and expression profile of a TLR4, b HLA-DR and g soluble TNF-α and h) soluble IL-1β were evaluated. THP1 cells were also blocked with Anti-TLR4 antibody prior to stimulation and evaluated for levels of e TLR4 and f HLA-DR at 24 h. Graphs were plotted for different time points with % of TLR/HLA-DR positive cells or pg/ml of TNF-α/IL-1β on y axis and recombinant proteins/control on x axis. Statistical analysis was done with Student’s t test and results are Mean ± SEM of three independent experiments where * represents comparison between control/proteins and unstimulated while # represents comparison between Rv0335c and Rv0335cΔCterm. (#,*)P < 0.05, (##,**)P < 0.01, (###,***)P < 0.001. (####,****)P < 0.0001. Gating strategy adopted for evaluating the surface expression of c) TLR4 and d) HLA-DR (Color figure online)
Fig. 11
Fig. 11
Mechanism of host cell processes modulation by C-terminal domain of Rv0335c protein of Mtb. Rv0335c protein of Mtb contains N terminal mitochondrial targeting sequence and a unique C-terminal domain and BH3-like motif similar to eukaryotic mitochondrial targeting Bcl2 proteins. Based on our observations of Rv0335c; we hypothesize that the protein activates two parallel host cellular pathways. Through one pathway, the unique C-terminal domain of Rv0335c facilitate its interaction with host TLR4 receptor leading to downstream production of pro-inflammatory cytokine TNF-α. The C-terminal domain of Rv0335c also has role in modulating intracellular Ca2+ influx. Through another pathway, Rv0335c localizes to host mitochondria. Because of presence of BH3-like motif in Rv0335c protein, it might be involved in protein–protein interaction and activation of pro-apoptotic Bcl2 proteins such as Bak, Bax and BH3 only proteins. Activation of Bcl2 proteins through Bak-like BH3 motif containing Rv0335c protein might also trigger the mitochondria mediated intrinsic apoptosis. The C-terminal domain of Rv0335c has role in disruption of mitochondrial integrity in terms of loss of mitochondrial membrane integrity, cytoplasmic release of Cyt C and activation of Caspase 9. Cytoplasmic Cyt C along with Caspase 9 might lead to formation of apoptosome and leads to activation of executioner Caspase 3 and 7. This entire process triggered by Rv0335c protein of Mtb ultimately culminates in host cell apoptosis which may facilitate long term survival of pathogen through cell-to-spread of infection (Color figure online)

Similar articles

Cited by

References

    1. WHO . WHO global TB report. Geneva: World Health Organization; 2021.
    1. Issar S. Mycobacterium tuberculosis pathogenesis and molecular determinants of virulence. Clin Microbiol Rev. 2003;16:463–496. doi: 10.1128/CMR.16.3.463-496.2003. - DOI - PMC - PubMed
    1. Prozorov AA, Fedorova IA, Bekker OB, Danilenko VN. The virulence factors of Mycobacterium tuberculosis: genetic control, new conceptions. Russ J Genet. 2014;50:775–797. doi: 10.1134/S1022795414080055. - DOI - PubMed
    1. Chai Q, Wang L, Liu CH. New insights into the evasion of host innate immunity by Mycobacterium tuberculosis. Cell Mol Immunol. 2020 doi: 10.1038/s41423-020-0502-z. - DOI - PMC - PubMed
    1. Dubey RK. Assuming the role of mitochondria in mycobacterial infection. Int J Mycobacteriol. 2016;5:379–383. doi: 10.1016/j.ijmyco.2016.06.001. - DOI - PubMed

Publication types

MeSH terms

Substances

LinkOut - more resources