. 2022 Oct 19;20(1):365.
doi: 10.1186/s12916-022-02554-3.

NUPR1 contributes to radiation resistance by maintaining ROS homeostasis via AhR/CYP signal axis in hepatocellular carcinoma

Affiliations

NUPR1 contributes to radiation resistance by maintaining ROS homeostasis via AhR/CYP signal axis in hepatocellular carcinoma

Yizhi Zhan et al. BMC Med. .

Abstract

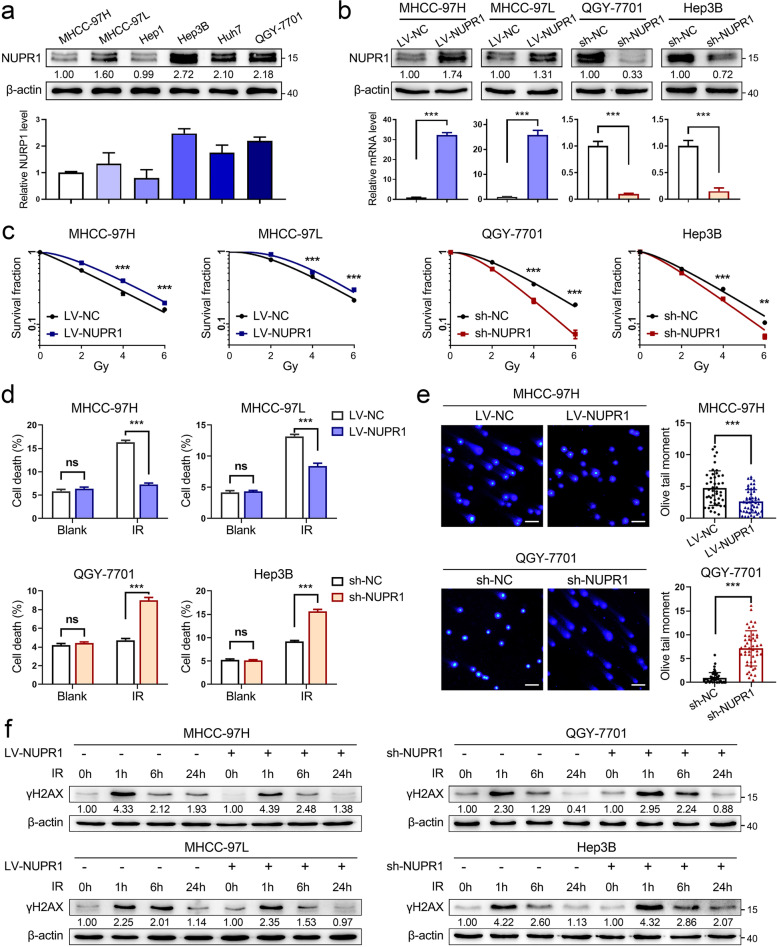
Background: Radiotherapy (RT) is one of the major therapeutic approaches to hepatocellular carcinoma (HCC). Ionizing radiation (IR) inducing the generation of reactive oxygen species (ROS) leads to a promising antitumor effect. However, the dysregulation of the redox system often causes radioresistance and impairs the efficacy of RT. Increasing evidence indicates that nuclear protein 1 (NUPR1) plays a critical role in redox reactions. In this study, we aim to explore the role of NUPR1 in maintaining ROS homeostasis and radioresistance in HCC.

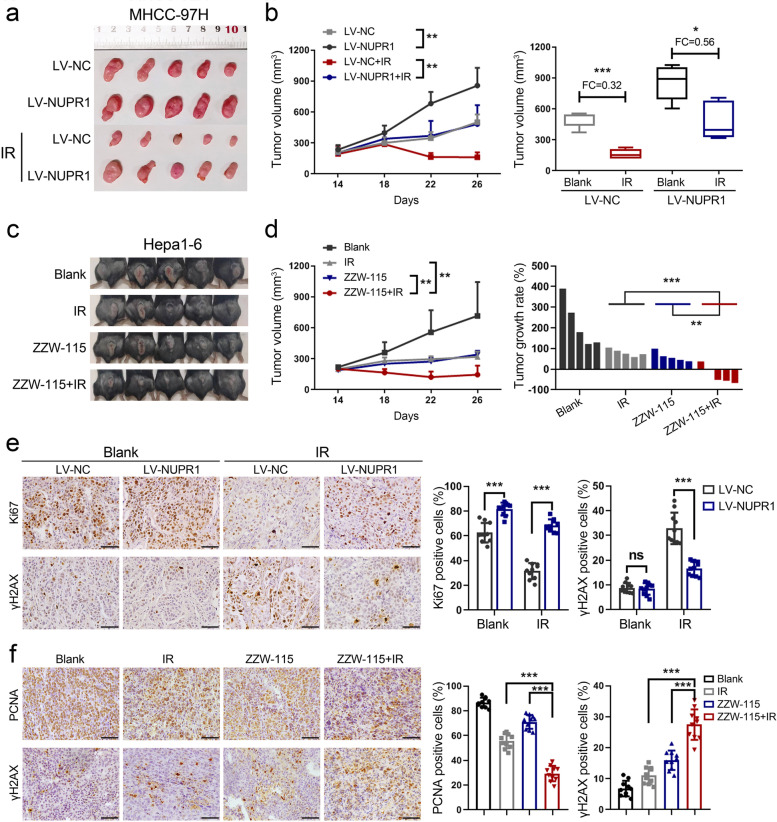
Methods: The radioresistant role of NUPR1 was determined by colony formation assay, comet assay in vitro, and xenograft tumor models in vivo. Probes for ROS, apoptosis assay, and lipid peroxidation assay were used to investigate the functional effect of NUPR1 on ROS homeostasis and oxidative stress. RNA sequencing and co-immunoprecipitation assay were performed to clarify the mechanism of NUPR1 inhibiting the AhR/CYP signal axis. Finally, we analyzed clinical specimens to assess the predictive value of NUPR1 and AhR in the radiotherapeutic efficacy of HCC.

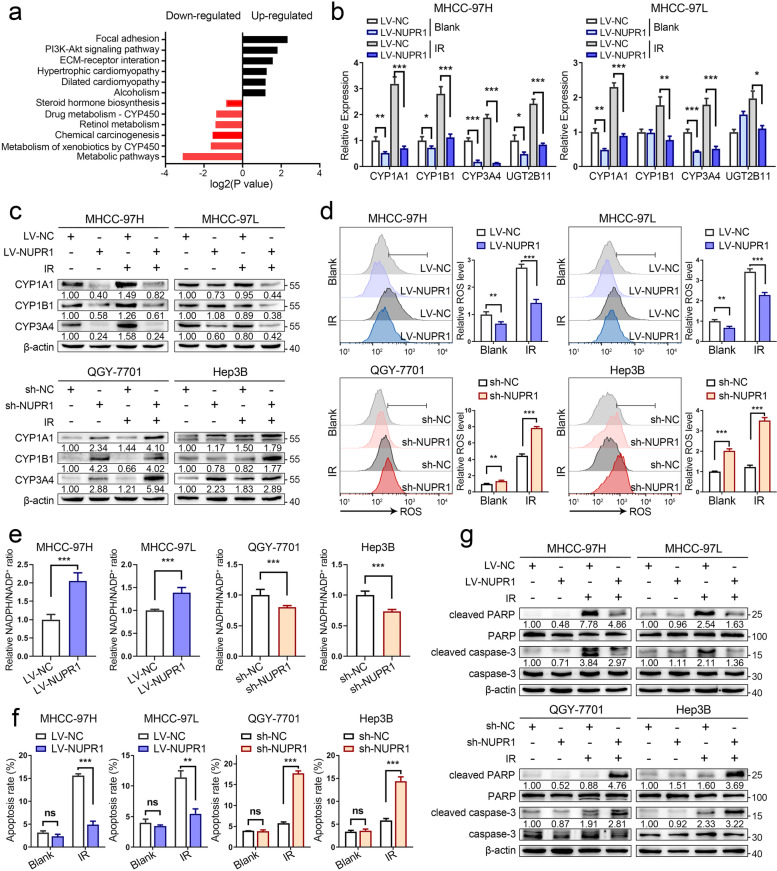
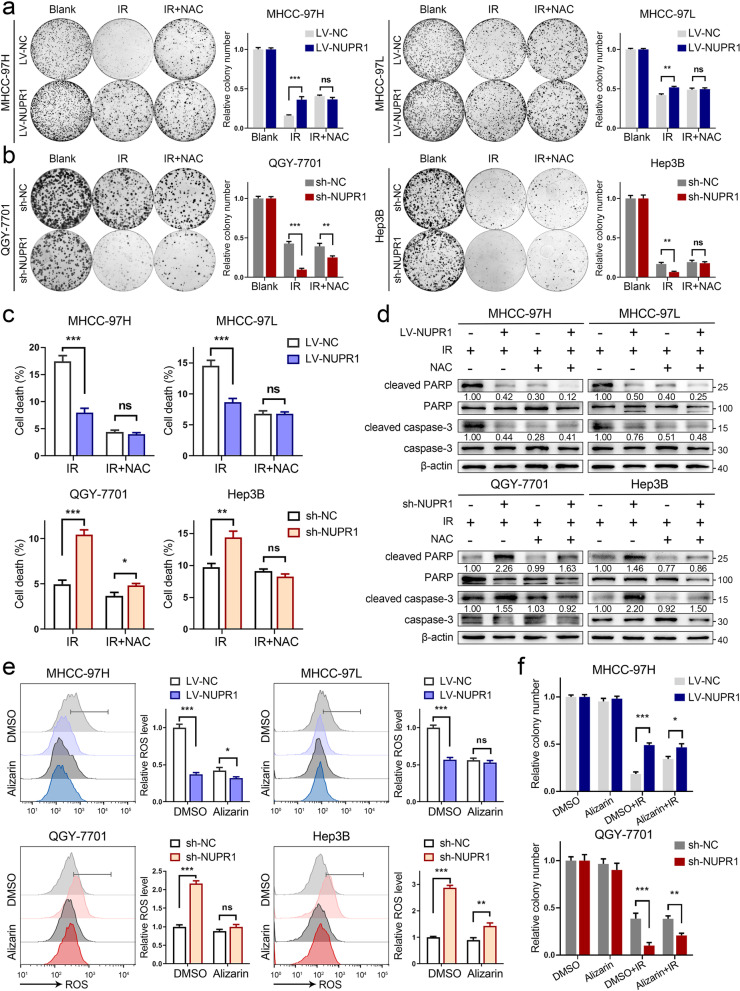
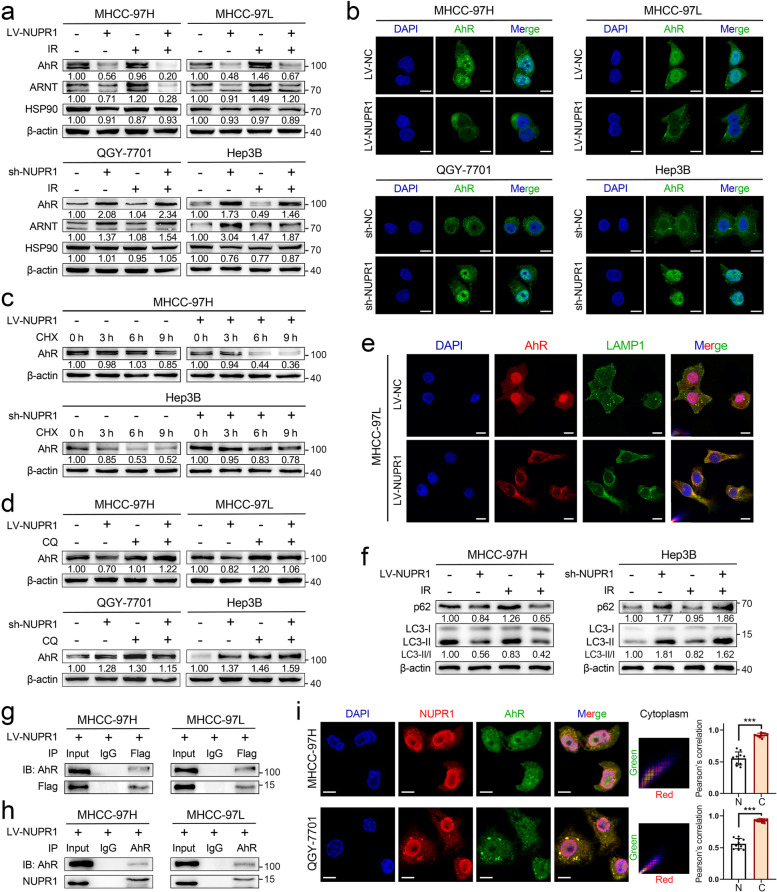
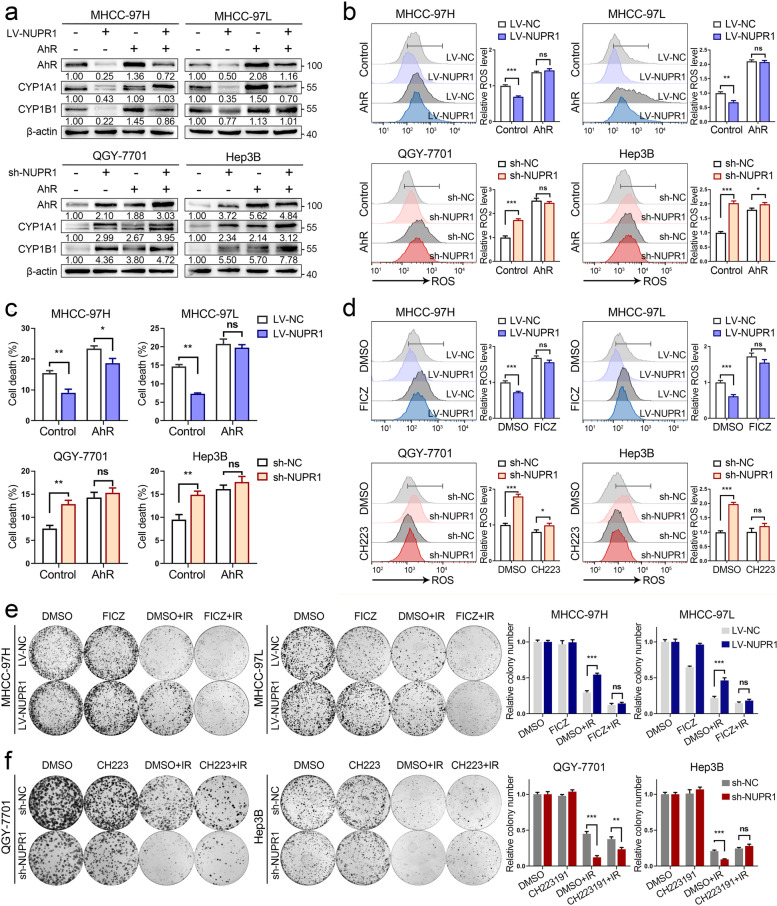
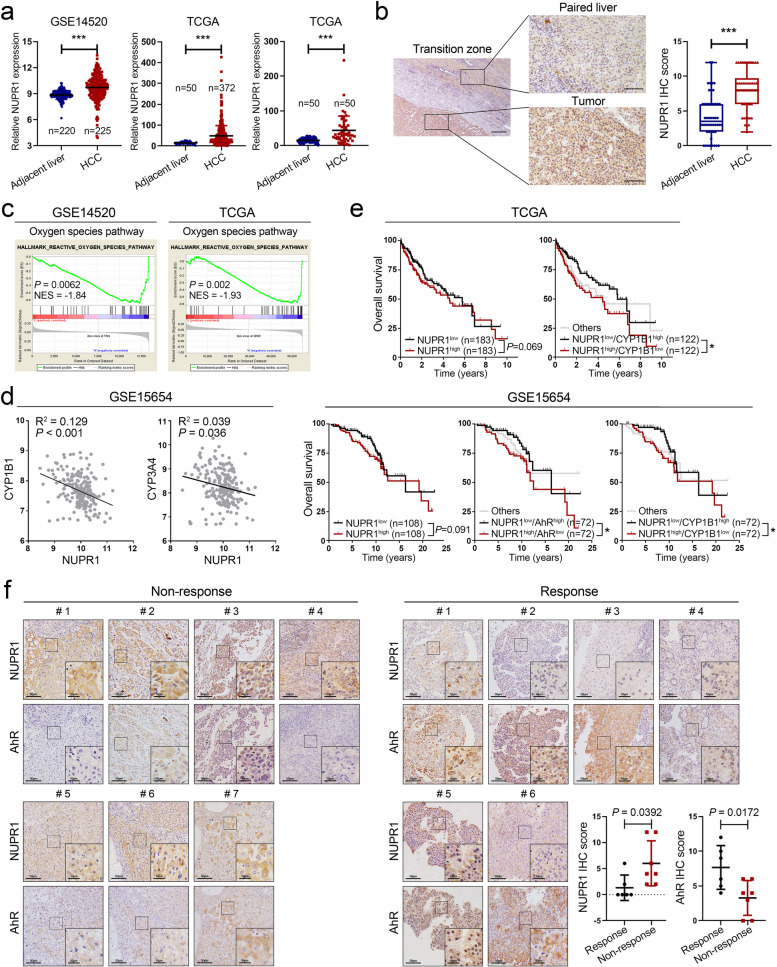
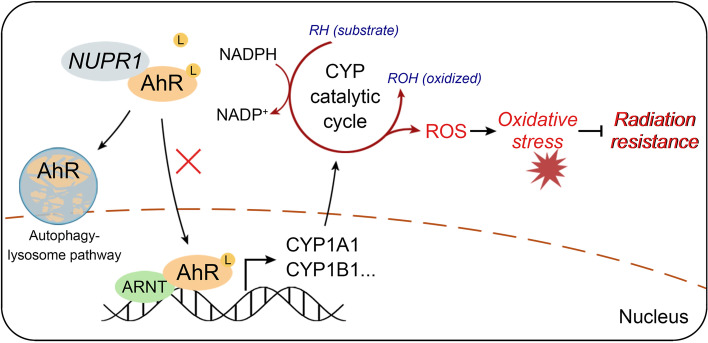
Results: We demonstrated that NUPR1 was upregulated in HCC tissues and verified that NUPR1 increased the radioresistance of HCC in vitro and in vivo. NUPR1 alleviated the generation of ROS and suppressed oxidative stress, including apoptosis and lipid peroxidation by downregulating cytochrome P450 (CYP) upon IR. ROS scavenger N-acetyl-L-cysteine (NAC) and CYP inhibitor alizarin restored the viability of NUPR1-knockdown cells during IR. Mechanistically, the interaction between NUPR1 and aryl hydrocarbon receptor (AhR) promoted the degradation and decreased nuclear translation of AhR via the autophagy-lysosome pathway, followed by being incapable of CYP's transcription. Furthermore, genetically and pharmacologically activating AhR abrogated the radioresistant role of NUPR1. Clinical data suggested that NUPR1 and AhR could serve as novel biomarkers for predicting the radiation response of HCC.

Conclusions: Our findings revealed the role of NUPR1 in regulating ROS homeostasis and oxidative stress via the AhR/CYP signal axis upon IR. Strategies targeting the NUPR1/AhR/CYP pathway may have important clinical applications for improving the radiotherapeutic efficacy of HCC.

Keywords: Aryl hydrocarbon receptor; Hepatocellular carcinoma; NUPR1; Oxidative stress; Radioresistance; Reactive oxygen species.


Conflict of interest statement

The authors declare that they have no competing interests.

Figures

Fig. 1
Fig. 1
NUPR1 acts as a radioresistant oncogene in HCC in vitroa Western blot was used to determine the protein expression of NUPR1 in a panel of HCC cell lines (MHCC-97H, MHCC-97L, Hep1, Hep3B, Huh7, and QGY-7701). Bar graphs presented the quantification of NUPR1 levels in HCC cells (below). b The protein and mRNA levels of NUPR1 in MHCC-97H/MHCC-97L cells with NUPR1 overexpression and QGY-7701/Hep3B with NUPR1 knockdown were verified by western blot and qRT-PCR. c Colony formation assays were employed in MHCC-97H/MHCC-97L cells with NUPR1 overexpression and QGY-7701/Hep3B cells with NUPR1 knockdown after an increased dose of IR treatment (0, 2, 4, 6 Gy). Survival curves were represented. d Bar graphs show the quantification of cell death in NUPR1 overexpression or knockdown cells by staining with 7-AAD after IR treatment (8 Gy). e DNA double-strand breaks of NUPR1-overexpressing MHCC-97H and NUPR1-knockdown QGY-7701 cells were detected by comet assays at 24 h after exposure to IR (8 Gy) (left, representative images, scale bar: 50 μm; right, bar graphs indicating the average tail moment per cell). f Western blot analysis was used to determine the protein levels of γH2AX in cells with a different NUPR1 expression status at the indicated time points after IR (8 Gy). Data are the mean of biological triplicates and are shown as the mean ± SD. P values: *P < 0.05; **P < 0.01; ***P < 0.001 and ns, not significant by two-tailed Student’s t-test
Fig. 2
Fig. 2
NUPR1 enhances the radiation resistance of HCC cells in vivoa, b Subcutaneous tumor formation in nude mice was established with NUPR1-overexpressing or control MHCC-97H cells (n = 5/group). Tumor sizes were measured every 4 days using calipers (left, representative tumor samples; middle, growth curves of subcutaneous tumors; right, the statistical graph of tumor volumes). c Representative images of each group were photographed at the end of the experiment. d Growth curves of subcutaneous tumors (left) and tumor growth rates of mice treated with IR, ZZW-115, or IR plus ZZW-115 were represented (right). e IHC images of Ki67 and γH2AX expression in xenograft tumors derived from MHCC-97H cells with NUPR1 overexpression or empty vector were represented (left, scale bar: 50 μm). The positive stain (in percentages) was analyzed (right). f IHC images of PCNA and γH2AX expression in xenograft tumors derived from Hepa1-6 cells with different treatments were shown (left, scale bar: 50 μm). The positive stain (in percentages) was analyzed (right). Data are the mean of biological triplicates and are shown as the mean ± SD. P values: *P < 0.05; **P < 0.01; ***P < 0.001 by two-tailed Student’s t-test, or by two-way ANOVA
Fig. 3
Fig. 3
NUPR1 inhibits ROS generation and oxidative stress via CYPs in HCC cells. a KEGG enrichment analysis of differentially expressed genes between NUPR1-overexpressing and control MHCC-97H cells showed that the metabolic pathway mediated by cytochrome P450 was downregulated in LV-NUPR1 cells. b The mRNA levels of genes included in CYP superfamily in MHCC-97H/MHCC-97L cells transfected with LV-NUPR1 or LV-NC were analyzed by qRT-PCR. Individual RNA values were normalized to β-actin values. c Western blot analysis was used to detect the protein expression of CYP1A1, CYP1B1, and CYP3A4 in NUPR1 overexpressing or knockdown cell lines treated with or without IR (8 Gy). d, e ROS levels and NADPH/NADP+ ratio in stable NUPR1 overexpressing or knockdown cell lines were measured after exposure to 8 Gy of IR. f Bar graphs show the relative levels of apoptotic cells after IR treatment (8 Gy) by staining with annexin V and DAPI in indicated cells. g Western blot was used to detect the protein levels of total/cleaved caspase-3 and total/cleaved PARP in different NUPR1 expressing cell lines treated with or without IR (8 Gy). Data are the mean of biological triplicates and are shown as the mean ± SD. P values: *P < 0.05; **P < 0.01; ***P < 0.001 and ns, not significant by Student’s t-test
Fig. 4
Fig. 4
ROS generated by CYPs is indispensable for IR-induced cytotoxicity in cells with NUPR1 inactivation. a, b Representative images of colony formation were displayed in NUPR1-overexpressing MHCC-97H/MHCC-97L (3000 cells) and NUPR1-knockdown QGY-7701/Hep3B (500 cells and 3000 cells, respectively) pretreated with 5 mM NAC followed by exposure to 6 Gy of IR (left). The survival data were normalized to those of unirradiated control cells (right). c Quantification of cell death was employed in LV-NC/LV-NUPR1 or sh-NC/sh-NUPR1 cell lines pretreated with or without 5 mM NAC followed by exposure to 8 Gy of IR. d Western blot analysis was utilized to determine the expression levels of total/cleaved caspase-3 and total/cleaved PARP in the indicated cells pretreated with or without NAC upon IR (8 Gy). e Relative ROS levels were measured in NUPR1 overexpressing or knockdown cell lines pretreated with or without 20 μM alizarin followed by 8 Gy of IR. f Colony formation assays were applied in stably transfected NUPR1 overexpression or knockdown cells after IR (6 Gy) or combination with 20 μM alizarin treatment. Data are the mean of biological triplicates and are shown as the mean ± SD. P values: *P < 0.05; **P < 0.01; ***P < 0.001 and ns, not significant by Student’s t-test
Fig. 5
Fig. 5
NUPR1 binds to AhR and promotes degradation of AhR in the autophagy-lysosome pathway. a Western blot was used to examine the protein levels of AhR, ARNT, and HSP90 in NUPR1-overexpressing MHCC-97H/MHCC-97L cells and NUPR1-knockdown QGY-7701/Hep3B cells with or without IR (8 Gy). b Immunofluorescence staining was performed to determine the location of AhR (green) in the indicated cell lines. The nuclei were counterstained with DAPI (blue). Scale bar: 10 μm. c Western blot was used to detect AhR levels in indicated cell lysates collected at different timing (0, 3, 6, 9 h) after 20 μg/mL CHX treatment. d Western blot of AhR protein was performed in cell lysates from different NUPR1 expression status cell lines with or without 20 μM CQ treatment. e Representative immunofluorescence images show the distribution of AhR (red), LAMP1 (green), and DAPI (blue) in LV-NC and LV-NUPR1 MHCC-97L cells. Scale bar: 10 μm. f The levels of LC3-II and p62 in cells with a different NUPR1 expression were determined by western blot. g The anti-Flag and anti-IgG products after incubating with lysates from MHCC-97H/MHCC-97L ectopically expressed Flag-tagged NUPR1 were used to detect Flag-NUPR1 and AhR protein by western blot. h Western blot analysis of NUPR1 and AhR in anti-AhR and anti-IgG products was performed. Cell lysates were immunoprecipitated with antibodies against AhR or IgG. i Representative immunofluorescence images of QGY-7701/MHCC-97H cells show the staining of NUPR1 (red), AhR (green), and nuclei counterstained with DAPI (blue) (left). Scale bar: 10 μm. Pearson correlation of the signal intensity of indicated molecules in different subcellular locations was quantified by ImageJ software (N/nucleus, C/cytoplasm, right)
Fig. 6
Fig. 6
AhR/CYP signal axis is required for NUPR1-mediated radioresistance in HCC. a Western blot analysis was utilized to examine the expression levels of AhR, CYP1A1, and CYP1B1 in different NUPR1 expressing cell lines transfected with AhR-overexpressing vector or control vector. b Relative ROS levels in different NUPR1 expressing cells with AhR overexpression or negative control were measured after exposure to 8 Gy of IR. c Quantification of cell death in indicated cells with AhR overexpression or negative control was measured after IR (8 Gy). d Cells with different NUPR1 expressions were pretreated with 5 μM FICZ or CH223191 for 24 h, followed by being exposed to 8 Gy of IR. The cells were collected to measure relative ROS levels. e, f Colony formation assays were performed in stably transfected NUPR1 overexpression or knockdown cell lines pretreated with FICZ or CH223191, followed by exposure to 6 Gy of IR. Data are the mean of biological triplicates and are shown as the mean ± SD. P values: *P < 0.05; **P < 0.01; ***P < 0.001 and ns, not significant by two-tailed Student’s t-test
Fig. 7
Fig. 7
NUPR1 is upregulated in HCC tissues and predicts radiotherapeutic resistance of HCC. a NUPR1 mRNA expression in unpaired HCC tissues and non-tumor liver tissues from TCGA and GSE14520 datasets were shown (left and middle). NUPR1 mRNA expression in 50 paired HCC tissues and the adjacent matched noncancerous tissues was displayed on the right. b Representative IHC images show the NUPR1 expression in HCC (n = 50) and corresponding adjacent liver tissues (n = 50, left). Scale bar: 200 μm in 4 × magnification and 50 μm in 20 × magnification. Quantification of IHC score was shown in boxplot (right). c Gene set enrichment analysis (GSEA) with relatively low-expressed versus high-expressed NUPR1 from TCGA LIHC and GSE14520 datasets showed that the oxygen species pathway was positively correlated with NUPR1 expression. d The mRNA level of NUPR1 was negatively correlated with the CYP1B1 and CYP3A4 expression in the GSE15654 dataset by using Pearson correlation analysis. e Kaplan-Meier survival analysis was used to assess the correlation between NUPR1 expression or combined with AhR, CYP1B1 level, and the overall survival of HCC patients in TCGA LIHC dataset (n = 366) and GES15654 dataset (n = 216). f NUPR1 and AhR expression in 13 HCC tissues from the patients who accepted RT treatment were analyzed by IHC. Representative IHC images (left) and quantified IHC score (right) are shown
Fig. 8
Fig. 8
A schematic model of the NUPR1/AhR/CYP signal axis showing it promotes radiation resistance of HCC

Similar articles

Cited by

References

    1. Sung H, Ferlay J, Siegel RL, Laversanne M, Soerjomataram I, Jemal A, et al. Global cancer statistics 2020: GLOBOCAN estimates of incidence and mortality worldwide for 36 cancers in 185 countries. CA Cancer J Clin. 2021;71(3):209–49. - PubMed
    1. Ursino S, Greco C, Cartei F, Colosimo C, Stefanelli A, Cacopardo B, Berretta M, Fiorica F. Radiotherapy and hepatocellular carcinoma: update and review of the literature. Eur Rev Med Pharmacol Sci. 2012;16(11):1599–1604. - PubMed
    1. Klein J, Dawson LA. Hepatocellular carcinoma radiation therapy: review of evidence and future opportunities. Int J Radiat Oncol Biol Phys. 2013;87(1):22–32. doi: 10.1016/j.ijrobp.2012.08.043. - DOI - PubMed
    1. Wahl DR, Stenmark MH, Tao Y, Pollom EL, Caoili EM, Lawrence TS, Schipper MJ, Feng M. Outcomes After Stereotactic Body Radiotherapy or Radiofrequency Ablation for Hepatocellular Carcinoma. J Clin Oncol. 2016;34(5):452–459. doi: 10.1200/JCO.2015.61.4925. - DOI - PMC - PubMed
    1. Yoon HI, Seong J. Multimodality treatment involving radiotherapy for advanced liver-confined hepatocellular carcinoma. Oncology. 2014;87(Suppl 1):90–98. doi: 10.1159/000368151. - DOI - PubMed

Publication types