. 2022 Nov;174(6):e13803.
doi: 10.1111/ppl.13803.

Rieske FeS overexpression in tobacco provides increased abundance and activity of cytochrome b6 f

Affiliations

Rieske FeS overexpression in tobacco provides increased abundance and activity of cytochrome b6 f

Eiri Heyno et al. Physiol Plant. 2022 Nov.

Abstract

Photosynthesis is fundamental for plant growth and yield. The cytochrome b6 f complex catalyses a rate-limiting step in thylakoid electron transport and therefore represents an important point of regulation of photosynthesis. Here we show that overexpression of a single core subunit of cytochrome b6 f, the Rieske FeS protein, led to up to a 40% increase in the abundance of the complex in Nicotiana tabacum (tobacco) and was accompanied by an enhanced in vitro cytochrome f activity, indicating a full functionality of the complex. Analysis of transgenic plants overexpressing Rieske FeS by the light-induced fluorescence transients technique revealed a more oxidised primary quinone acceptor of photosystem II (QA ) and plastoquinone pool and faster electron transport from the plastoquinone pool to photosystem I upon changes in irradiance, compared to control plants. A faster establishment of qE , the energy-dependent component of nonphotochemical quenching, in transgenic plants suggests a more rapid buildup of the transmembrane proton gradient, also supporting the increased in vivo cytochrome b6 f activity. However, there was no consistent increase in steady-state rates of electron transport or CO2 assimilation in plants overexpressing Rieske FeS grown in either laboratory conditions or field trials, suggesting that the in vivo activity of the complex was only transiently increased upon changes in irradiance. Our results show that overexpression of Rieske FeS in tobacco enhances the abundance of functional cytochrome b6 f and may have the potential to increase plant productivity if combined with other traits.


Figures

FIGURE 1
FIGURE 1
Relative AtPetC transcript abundance as fold of NtActin in homozygous T1 plants and WT plants. The individuals used in this analysis generated the T2 seeds used for the phenotyping experiments presented below. Mean ± SD, n = 3 technical replicates
FIGURE 2
FIGURE 2
Immunodetection of cytochrome b 6 f complex from the thylakoid membranes of WT and Rieske‐OE plants. (A) Blue Native‐PAGE of the thylakoid protein complexed followed by the western blotting with Rieske antibodies (left and right panels, respectively). A sample of 10 μg Chl (a + b) of each sample was loaded. Additional gel and blot images of all lines tested are shown in Figure S2. (B) Relative quantification of the blots. Mean ± SE, n = 3 biological replicates. Asterisks indicate statistically significant differences between transgenic lines and WT (Tukey test, p < 0.05).
FIGURE 3
FIGURE 3
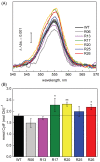
Quantification of CytF content in the thylakoid membranes of WT and Rieske‐OE plants. (A) The reduced‐minus‐oxidised CytF spectra. Traces are average of three to eight biological replicates; SE range is shown for the WT trace. (B) Relative abundance of CytF calculated from the 554 nm peak. Mean ± SE, n = 8 biological replicates for WT, n = 3 for transgenic lines. Asterisks indicate statistically significant differences between transgenic lines and WT (Tukey test, p < 0.05).
FIGURE 4
FIGURE 4
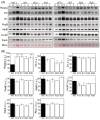
Abundance of photosynthetic proteins in leaves of WT and Rieske‐OE plants. (A) Immunodetection of Rieske, plastocyanin (PC), D1 subunit of PSII, PsaB subunit of PSI, AtpB subunit of ATP synthase, Lhcb2 subunit of LHCII and PsbS in leaf protein extracts loaded on leaf area basis. The quantity of the large subunit of Rubisco (RbcL) was estimated from Ponceau stained membranes immediately after transfer. A titration series of one of the WT samples (WT1) was used for relative quantification. (B) Quantification of immunoblots relative to WT. mean ± SE, n = 4 biological replicates for WT, n = 3 for transgenic lines. Asterisks indicate statistically significant differences between transgenic lines and WT (Tukey test, *p < 0.05, **p < 0.01. ***p < 0.001).
FIGURE 5
FIGURE 5
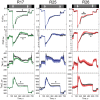
Electron transport parameters of WT (black traces) and Rieske‐OE lines R17, R25 and R26 derived from the light‐induced fluorescent transients measurements. The upper panels indicate background illumination during the measurement: black = darkness; hatched = far‐red light of 200 μmol m−2 s−1; arrows indicate the onset and offset of red actinic light of 400 μmol m−2 s−1. F V /F M , oxidised Q A sites; PQP_ox, oxidation state of the plastoquinone pool; Tau1, electron transport rate from PSII to the plastoquinone pool; Tau2, electron transport rate from the plastoquinone pool to PSI. Mean ± SE, n = 3 biological replicates for transgenic lines, n = 4 for WT. Asterisks indicate statistically significant differences between transgenic lines and WT over a time period (Tukey test, p < 0.05). A solid line indicates that all data points were significantly different, a broken line indicates that at least 50% of the data points were significantly different.
FIGURE 6
FIGURE 6
Analysis of the thylakoid membrane energisation in WT and Rieske‐OE plants. (A, B) Proton motive force (pmf) and proton conductivity of the thylakoid membrane (g H +) at different irradiances. Mean ± SE, n = 4 biological replicates. (C) Changes in absorbance at 535 nm during the dark–light–dark transitions. Traces were normalised to 0 in the beginning of illumination (400 μmol m−2 s−1, arrow up) and to 1 in the end of illumination (arrow down) to facilitate comparison of the kinetics. Traces are average of three biological replicates, SE is shown as a lighter shade. Asterisks indicate statistically significant differences between transgenic lines and WT (Tukey test, p < 0.05). The solid line indicates the time frame of significant differences between the lines.
FIGURE 7
FIGURE 7
Photosynthetic properties of WT and Rieske‐OE tobacco plants grown in controlled conditions. (A) CO2 assimilation rate, A; (B) the effective quantum yield of PSII, Y(II). Measurements were performed at 1500 μmol m−2 s−1 and different CO2 partial pressures. Mean ± SE, n = 3 biological replicates for Rieske‐OE lines, n = 6 for WT. Asterisks indicate statistically significant differences between transgenic lines and WT (Tukey test, p < 0.05).
FIGURE 8
FIGURE 8
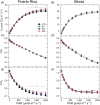
Light responses of photosynthetic parameters measured at ambient CO2 from control and Rieske‐OE tobacco plants grown in the field. (A, C, E) Puerto Rico trials; (B, D, F) Illinois field trials. (A and B) CO2 assimilation rate, A; (C and D) the effective quantum yield of PSII, Y(II); (E and F) the ratio of intercellular and ambient CO2 partial pressures, C i /C a . The control group (CTR) contained WT and azygous plants. Mean ± SE, n = 18 biological replicates for CTR in Puerto Rico, n = 24 for CTR in Illinois, n = 9 for transgenic lines in Puerto Rico, n = 12 for transgenic lines in Illinois. Asterisks indicate statistically significant differences between transgenic lines and WT (linear mixed‐effects model and type II ANOVA, p < 0.05).

Similar articles

Cited by

References

    1. Anderson, J.M. , Dean Price, G. , Soon Chow, W. , Hope, A.B. & Badger, M.R. (1997) Reduced levels of cytochrome bf complex in transgenic tobacco leads to marked photochemical reduction of the plastoquinone pool, without significant change in acclimation to irradiance. Photosynthesis Research, 53, 215–227.
    1. Avenson, T.J. , Cruz, J.A. , Kanazawa, A. & Kramer, D.M. (2005) Regulating the proton budget of higher plant photosynthesis. Proceedings of the National Academy of Sciences of the United States of America, 102, 9709–9713. - PMC - PubMed
    1. Bailey‐Serres, J. , Parker, J.E. , Ainsworth, E.A. , Oldroyd, G.E.D. & Schroeder, J.I. (2019) Genetic strategies for improving crop yields. Nature, 575, 109–118. - PMC - PubMed
    1. Bendall, D.S. , Davenport, H.E. & Hill, R. (1971) Cytochrome components in chloroplasts of the higher plants. In: Methods in enzymology, Vol. 23. New York: Academic Press, pp. 327–344.
    1. Clarke, V.C. , De Rosa, A. , Massey, B. , George, A.M. , Evans, J.R. , von Caemmerer, S. et al. (2022) Mesophyll conductance is unaffected by expression of Arabidopsis PIP1 aquaporins in the plasmalemma of Nicotiana. Journal of Experimental Botany, 73, 3625–3636. - PMC - PubMed

MeSH terms

LinkOut - more resources