. 2022 Oct;10(20):e15492.
doi: 10.14814/phy2.15492.

Ectopic foci do not co-locate with ventricular epicardial stretch during early acute regional ischemia in isolated pig hearts

Affiliations

Ectopic foci do not co-locate with ventricular epicardial stretch during early acute regional ischemia in isolated pig hearts

Hanyu Zhang et al. Physiol Rep. 2022 Oct.

Abstract

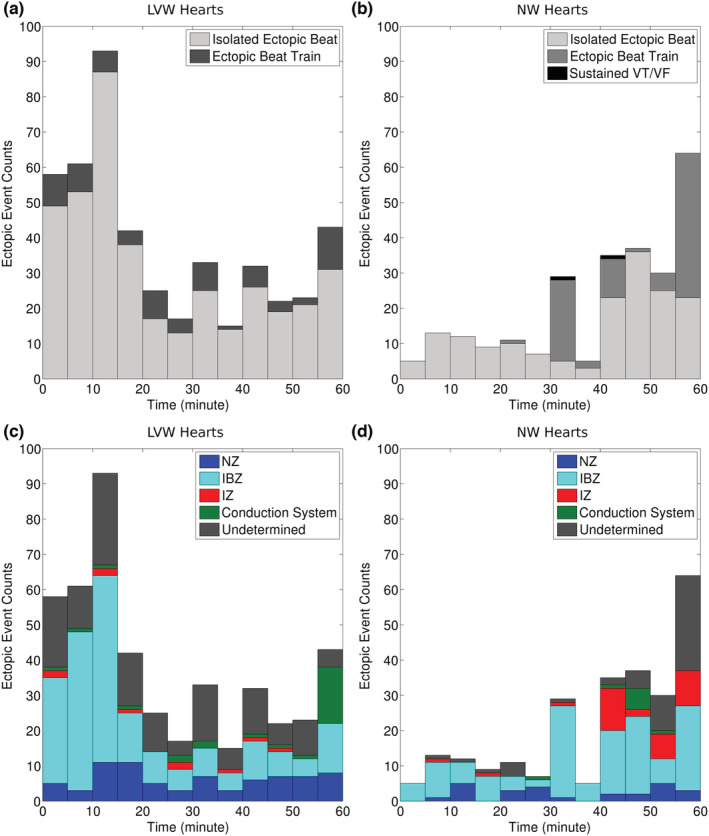
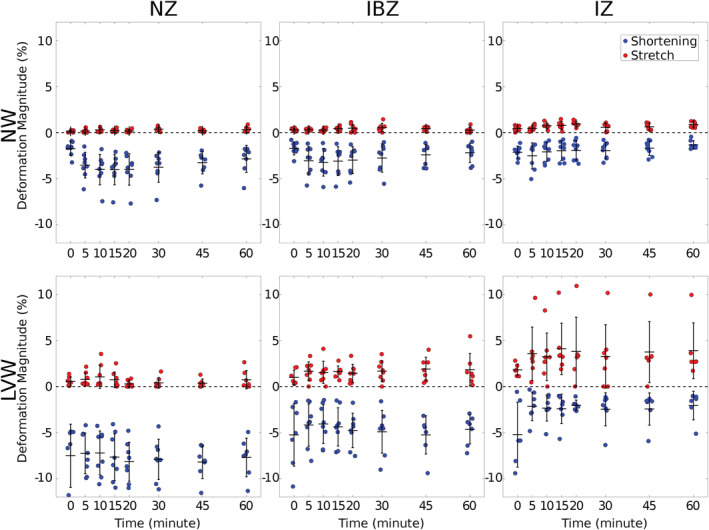
Ectopic activation during early acute regional ischemia may initiate fatal reentrant arrhythmias. However, the origin of this ectopy remains poorly understood. Studies suggest that systolic stretch arising from dyskinesia in ischemic tissue may cause ectopic depolarization due to cardiac mechanosensitivity. The aim of this study was to investigate the link between mechanical stretch and ectopic electrical activation during early acute regional ischemia. We used a recently developed optical mapping technique capable of simultaneous imaging of mechanical deformation and electrical activation in isolated hearts. Eight domestic swine hearts were prepared in left ventricular working mode (LVW), in which the left ventricle was loaded and contracting. In an additional eight non-working (NW) hearts, contraction was pharmacologically suppressed with blebbistatin and the left ventricle was not loaded. In both groups, the left anterior descending coronary artery was tied below the first diagonal branch. Positive mechanical stretch (bulging) during systole was observed in the ischemic zones of LVW, but not NW, hearts. During ischemia phase 1a (0-15 min post-occlusion), LVW hearts had more ectopic beats than NW hearts (median: 19, interquartile range: 10-28 vs. median: 2, interquartile range: 1-6; p = 0.02); but the difference during phase 1b (15-60 min post-occlusion) was not significant (median: 27, interquartile range: 22-42 vs. median: 16, interquartile range: 12-31; p = 0.37). Ectopic beats arose preferentially from the ischemic border zone in both groups (p < 0.01). In LVW hearts, local mechanical stretch was only occasionally co-located with ectopic foci (9 of 69 ectopic beats). Despite the higher rate of ectopy observed in LVW hearts during ischemia phase 1a, the ectopic beats generally did not arise by the hypothesized mechanism in which ectopic foci are generated by co-local epicardial mechanical stretch.


Conflict of interest statement

The authors declares that there is no conflict of interest.

Figures

FIGURE 1
FIGURE 1
Electrode placement and optical mapping regions. (a) Location of electrodes relative to the anterior epicardium. (b) Location of plunge needles in the septum and posterior LV. (ad), subepicardial hook electrodes; (ei), plunge needles; black cross, LAD ligation site; gray shading, ischemic zone. (c) Optical mapping regions on the anterior epicardium. Dark green shading, marked region; cyan shading, ischemic border zone (IBZ); light green shading, expanded mapping region. The red region is obscured by electrode cables and is not available for optical mapping. (d) Relative locations of the septal IBZ and a plunge needle electrode. (e) dimensions (in mm) of plunge needle electrode. LAD, left anterior descending coronary artery; LV, left ventricular
FIGURE 2
FIGURE 2
Unipolar electrogram signals from subepicardial hook electrodes. (a) Three normal sinus beats. Gray dashed lines indicate RA activation. (b) Expansion of the first beat in (a), showing the definition of T A‐V delay and the time window of a sinus beat (gray shading) (c), a sequence of activations containing a ventricular ectopic beat (indicated by arrow). Ectopic beats occur outside of the expected time window. RA, right atrium
FIGURE 3
FIGURE 3
Classification of all post‐occlusion ectopic events in eight LVW and eight NW hearts. (a, b) Events grouped by arrhythmia type. (c, d) Events grouped by spatial origin. Statistical analysis by aligned‐rank transformation mixed model (see text for details). LVW, left ventricular working mode; NW, non‐working
FIGURE 4
FIGURE 4
Post‐occlusion deformation magnitudes by preparation (LVW or NW) and perfusion zone (NZ, IBZ, IZ). Stretch magnitudes are red and shortening magnitudes are blue. Black bars show mean and SD. There were eight LVW and eight NB hearts. Each data point is the average of all triangles within the respective prefusion zone. Statistical analysis by linear mixed model (see text for details). IBZ, ischemic border zone; IZ, ischemic zone; LVW, left ventricular working mode; NW, non‐working; NZ, normal zone
FIGURE 5
FIGURE 5
Post‐occlusion APD shortening. (a) ΔAPDIBZ is the average APD in normal zone triangles subtracted from the average APD in IBZ triangles. It differs in LVW (dark blue) and NW (light blue) hearts (p = 0.01). (b) ΔAPDIZ (computed in the same way as ΔAPDIBZ) does not differ in LVW (dark blue) and NW (light blue) hearts (p = 0.52). There were eight LVW and eight NW hearts. Statistical analysis by linear mixed model (see text for details). APD, action potential duration; IBZ, ischemic border zone; LVW, left ventricular working mode; NW, non‐working
FIGURE 6
FIGURE 6
Examples of principal strains S 1 and S 2 (in %) and V m at ectopic focal sites. Red dashed lines indicate the moment of depolarization (as indicated by maximum dV m/dt). Values in red are the strains at depolarization time. (a) The ectopic focal site was stretched (i.e., S 1 > S 2 > 0) at depolarization time. (b) The ectopic focal site was not stretched at depolarization time but had been stretched during the prior cardiac cycle. (c) The ectopic focal site was never stretched during the previous cardiac cycle. See additional examples in Figure S4.
FIGURE 7
FIGURE 7
Isochronal activation maps of ectopic activation (left panels) and the distribution of mechanical strains at the moment of ectopic depolarization (right panels) in the marked region. Ectopic foci are indicated by arrows. V m could not be reconstructed in the solid blue triangles in the left panels. Dark green lines indicate the perfusion boundary. Blue and red bars represent negative and positive principal strain, respectively. Bars are oriented in the respective principal direction. Triangles in which both principal strains are positive (i.e., stretched) are yellow. (a) The ectopic focal site is stretched at the moment of depolarization. (b) The ectopic focal site is not stretched at the moment of depolarization.
FIGURE 8
FIGURE 8
Deformation magnitude versus activation time for marker triangles in LVW hearts in which both mechanical and electrical data were available. Activation times are measured at the center of marker triangles and are relative to the earliest activation for that beat. There are two data points per activation: one each for stretch and shortening magnitude measured over the cardiac cycle preceding activation. Plot markers are color‐coded by perfusion zone. The blue lines and shadows are regression lines and 95% CI for triangles in the IBZ only. Black lines/hatched regions show the regression and 95% CI for all triangles. (a) Data from only the four group I ectopic beats at which the earliest activated sites were stretched at the time of activation. (b) Data from all 69 ectopic beats with early sites within the marked region. (c) Data from 72 non‐ectopic beats (9 beats in each of 8 animals) during the post‐occlusion period. CI, confidence interval; LVW, left ventricular working mode

Similar articles

Cited by

References

    1. Akaishi, M. , Weintraub, W. S. , Schneider, R. M. , Klein, L. W. , Agarwal, J. B. , & Helfant, R. H. (1986). Analysis of systolic bulging. Mechanical characteristics of acutely ischemic myocardium in the conscious dog. Circulation Research, 58, 209–217. - PubMed
    1. Allen, D. G. , & Orchard, C. H. (1987). Myocardial contractile function during ischemia and hypoxia. Circulation Research, 60, 153–168. - PubMed
    1. Bachtel, A. D. , Gray, R. A. , Stohlman, J. M. , Bourgeois, E. B. , Pollard, A. E. , & Rogers, J. M. (2011). A novel approach to dual excitation ratiometric optical mapping of cardiac action potentials with di‐4‐ANEPPS using pulsed LED excitation. IEEE Transactions on Biomedical Engineering, 58, 2120–2126. - PMC - PubMed
    1. Bode, F. , Sachs, F. , & Franz, M. R. (2001). Tarantula peptide inhibits atrial fibrillation. Nature, 409, 35–36. - PubMed
    1. Cameron, B. A. , Kai, H. , Kaihara, K. , Iribe, G. , & Quinn, T. A. (2020). Ischemia enhances the acute stretch‐induced increase in calcium spark rate in ventricular myocytes. Frontiers in Physiology, 11, 289. - PMC - PubMed

Publication types