. 2022 Oct;19(195):20220476.
doi: 10.1098/rsif.2022.0476. Epub 2022 Oct 19.

Rheology of marine sponges reveals anisotropic mechanics and tuned dynamics

Affiliations

Rheology of marine sponges reveals anisotropic mechanics and tuned dynamics

Emile A Kraus et al. J R Soc Interface. 2022 Oct.

Abstract

Sponges are animals that inhabit many aquatic environments while filtering small particles and ejecting metabolic wastes. They are composed of cells in a bulk extracellular matrix, often with an embedded scaffolding of stiff, siliceous spicules. We hypothesize that the mechanical response of this heterogeneous tissue to hydrodynamic flow influences cell proliferation in a manner that generates the body of a sponge. Towards a more complete picture of the emergence of sponge morphology, we dissected a set of species and subjected discs of living tissue to physiological shear and uniaxial deformations on a rheometer. Various species exhibited rheological properties such as anisotropic elasticity, shear softening and compression stiffening, negative normal stress, and non-monotonic dissipation as a function of both shear strain and frequency. Erect sponges possessed aligned, spicule-reinforced fibres which endowed three times greater stiffness axially compared with orthogonally. By contrast, tissue taken from shorter sponges was more isotropic but time-dependent, suggesting higher flow sensitivity in these compared with erect forms. We explore ecological and physiological implications of our results and speculate about flow-induced mechanical signalling in sponge cells.

Keywords: anisotropic elasticity; auxeticity; marine sponges; nonlinear viscoelasticity; rheology; tissue mechanics.


Figures
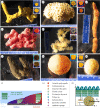
Figure 1.
Figure 1.
Sponges studied. (a) Aplysina fulva, (b) Cliona celata (gamma growth form [14]), (c) I. notabilis, (d) Callyspongia sp., (e) A. polycapella, (f) T. keyensis, (g) Tethya sp., (h) Cinachyrella apion. Images of representative sample discs for rheology are inset. (i) Diagram (original image courtesy of Symscape) of ambient flows: steady flow v (left) and boundary layer flow (right). (j) Key of sponges: squares have spicules, diamonds do not. (k) Schematic of sampling geometry in relation to v and subsequent drag FD on an example sponge. z^ points into the page.
Figure 2.
Figure 2.
Rheometry schematic. (a) Sample in the rheometer. (b) Parallel-plate geometry (radius a = 0.6 cm), used to impose oscillatory shear γ(t) and uniaxial strain ε.
Figure 3.
Figure 3.
Uniaxial stress–strain curves for distinct sample orientations n^1 and n^2 (filled and unfilled markers) in each sponge. Error bars are s.e. of N samples in (ac,e,g) while (d,f,h) have no error bars since in these species we compared pairwise, randomly oriented samples. (i) Uniaxial modulus E in MPa. (j) Ratio of E measured along each direction, E1/E2.
Figure 4.
Figure 4.
(ah) Linear shear storage modulus G′ versus uniaxial strain ε. (i) G′ at ε = 0, G0.
Figure 5.
Figure 5.
(a) G′ versus the magnitude of compressive stress |σN| in the sponges and mammalian brain, liver and adipose tissue [–28]. (b) Change in magnitude of G′ versus corresponding change in |σN|, both normalized by G0. (c) E versus G0 along each direction in the sponges and in the mammalian tissues. (d) E/G0 bar plot; the diagram adjacent depicts which uniaxial and shear moduli were measured in the rheometer based on the sampling geometry.
Figure 6.
Figure 6.
Sponge tissue frequency sweeps at γ0=0.05%. (a) G′(ω), (b) G′′(ω), (c) G′′ versus G′ at ω = π s−1 and (d) tan δ versus ω, replotted on linear axes in (e). Curves are fits of the fractional solid model [16] and error bars are mean ± s.e. of N samples.
Figure 7.
Figure 7.
Sponge tissue amplitude sweeps at ω = 4π s−1. GM (downward triangles) and GL (upward triangles) versus γ0 in (a) A. polycapella, (b) Callyspongia sp. and (c) C. celata. Data for the second round are in grey. (d) S, (e) σN and (f) tan δ versus γ0.
Figure 8.
Figure 8.
Sponge structure and morphology. (a) Dried A. fulva spongin fibre skeleton sampled into (b) n^1 and (c) n^2 discs. Red lines inside black boxes correspond to average fibre orientation measured using FibrilTool [21]. (d) Axinella polycapella spicule preparation. (e) n^1, (f) n^2 A. polycapella, (g) Callyspongia sp. skeleton, arrows show spicules confined inside spongin fibres. (h) n^1, (i) n^2 Callyspongia sp.
Figure 9.
Figure 9.
(a) Mean mass fraction of water ϕw ±s.e. of N discs. (b) G0 versus the concentration of spongins c estimated from ϕw. (c) Estimated number of spicules per ml of tissue ±50%. (d) G0 versus the number density of spicules.

Similar articles

References

    1. Daley AC, Antcliffe JB. 2019. Evolution: the battle of the first animals. Curr. Biol. 29, R257-R259. ( 10.1016/j.cub.2019.02.031) - DOI - PubMed
    1. Redmond AK, McLysaght A. 2021. Evidence for sponges as sister to all other animals from partitioned phylogenomics with mixture models and recoding. Nat. Commun. 12, 1783. ( 10.1038/s41467-021-22074-7) - DOI - PMC - PubMed
    1. Mah JL, Leys SP. 2017. Think like a sponge: the genetic signal of sensory cells in sponges. Dev. Biol. 431, 93-100. ( 10.1016/j.ydbio.2017.06.012) - DOI - PubMed
    1. Dunn CW, Leys SP, Haddock SHD. 2015. The hidden biology of sponges and ctenophores. Trends Ecol. Evol. 30, 282-291. ( 10.1016/j.tree.2015.03.003) - DOI - PubMed
    1. Garrone R. 1978. Phylogenesis of connective tissue. Basel, Switzerland: Karger Publishers.

Publication types