. 2022 Dec;13(6):3122-3136.
doi: 10.1002/jcsm.13100. Epub 2022 Oct 19.

Pyruvate dehydrogenase kinase 4 promotes ubiquitin-proteasome system-dependent muscle atrophy

Affiliations

Pyruvate dehydrogenase kinase 4 promotes ubiquitin-proteasome system-dependent muscle atrophy

Ibotombi Singh Sinam et al. J Cachexia Sarcopenia Muscle. 2022 Dec.

Erratum in

Abstract

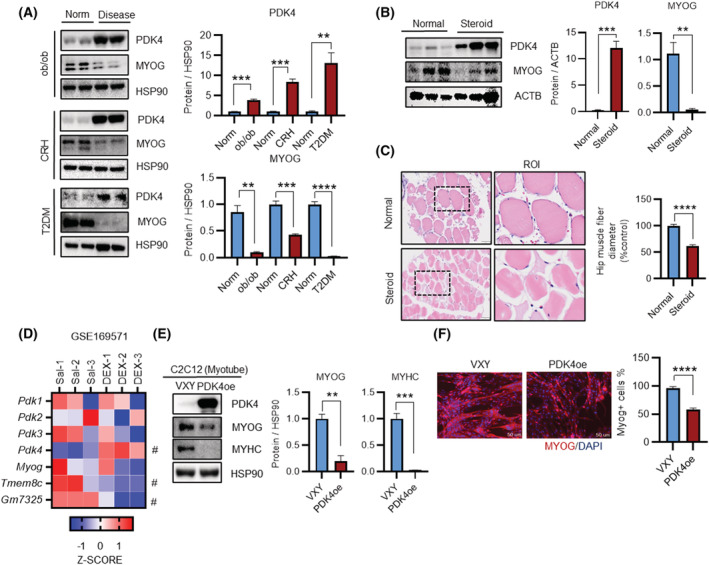
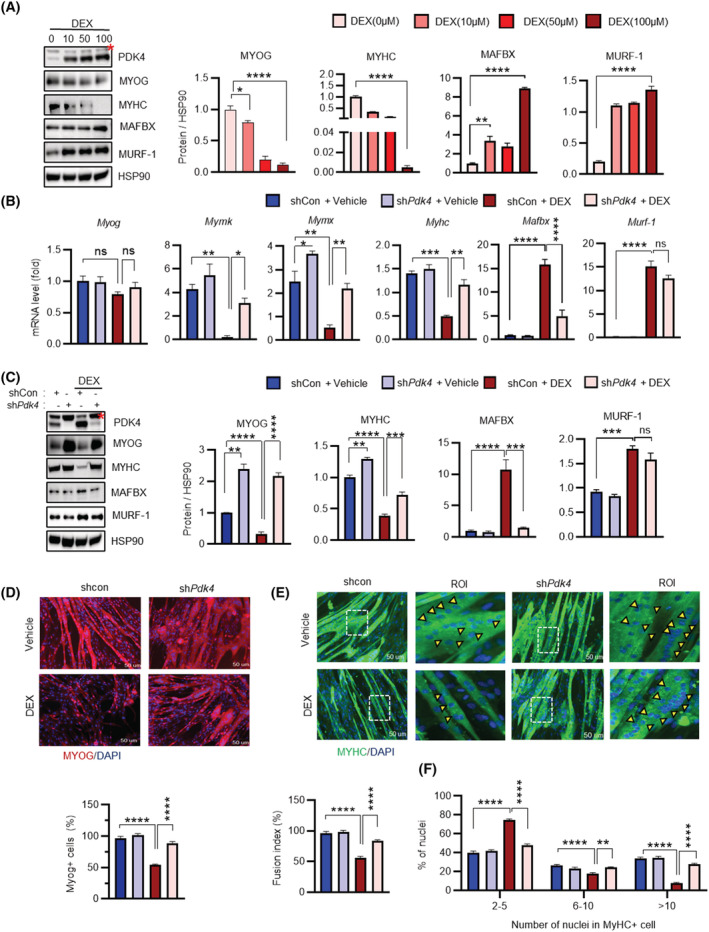
Background: Muscle atrophy, leading to muscular dysfunction and weakness, is an adverse outcome of sustained period of glucocorticoids usage. However, the molecular mechanism underlying this detrimental condition is currently unclear. Pyruvate dehydrogenase kinase 4 (PDK4), a central regulator of cellular energy metabolism, is highly expressed in skeletal muscle and has been implicated in the pathogenesis of several diseases. The current study was designed to investigated and delineate the role of PDK4 in the context of muscle atrophy, which could be identified as a potential therapeutic avenue to protect against dexamethasone-induced muscle wasting.

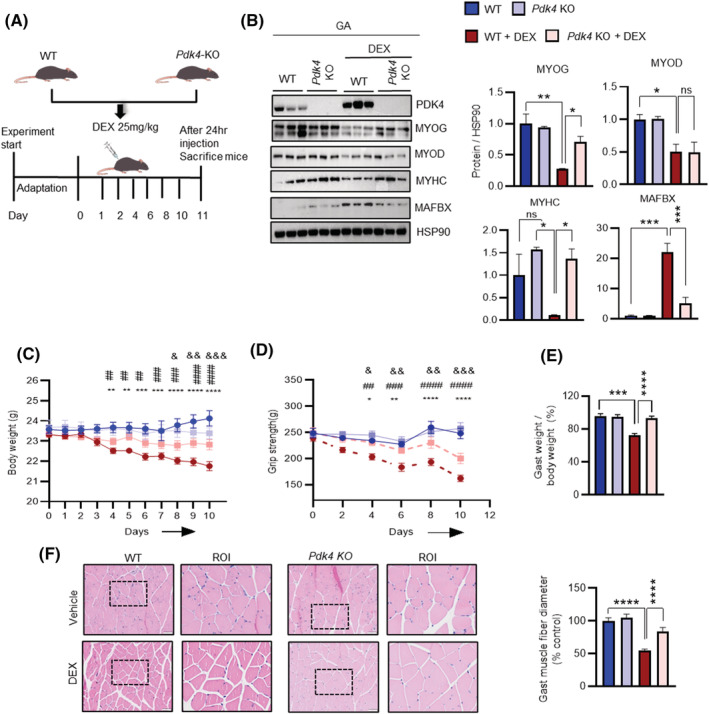
Methods: The dexamethasone-induced muscle atrophy in C2C12 myotubes was evaluated at the molecular level by expression of key genes and proteins involved in myogenesis, using immunoblotting and qPCR analyses. Muscle dysfunction was studied in vivo in wild-type and PDK4 knockout mice treated with dexamethasone (25 mg/kg body weight, i.p., 10 days). Body weight, grip strength, muscle weight and muscle histology were assessed. The expression of myogenesis markers were analysed using qPCR, immunoblotting and immunoprecipitation. The study was extended to in vitro human skeletal muscle atrophy analysis.

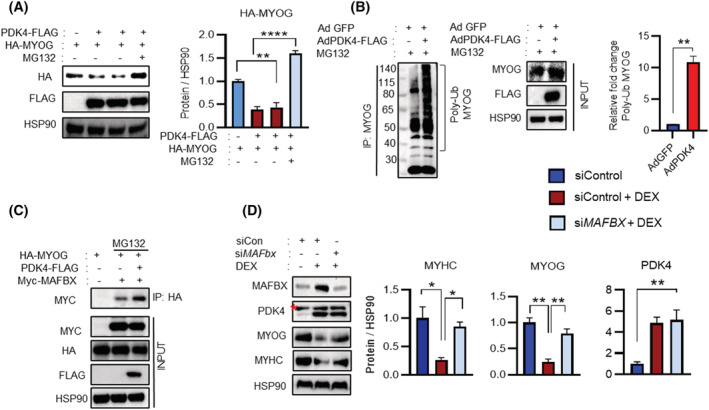
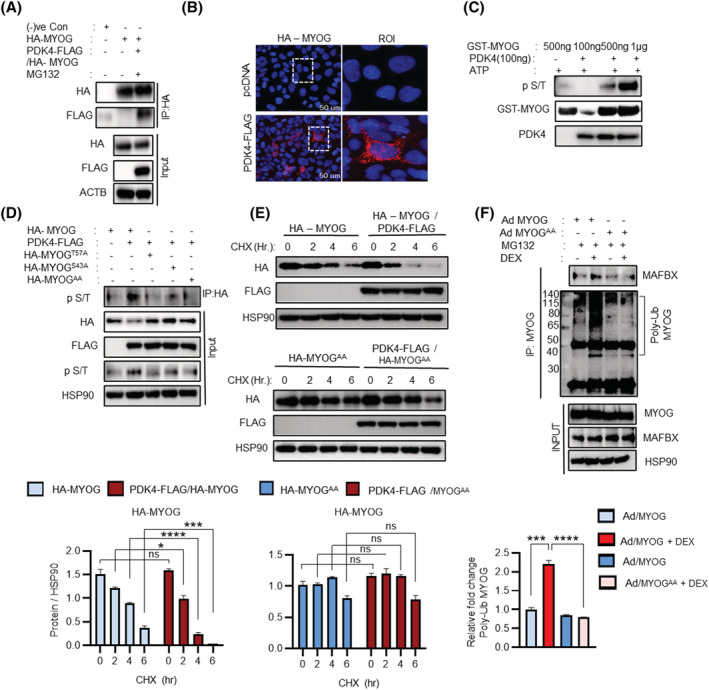
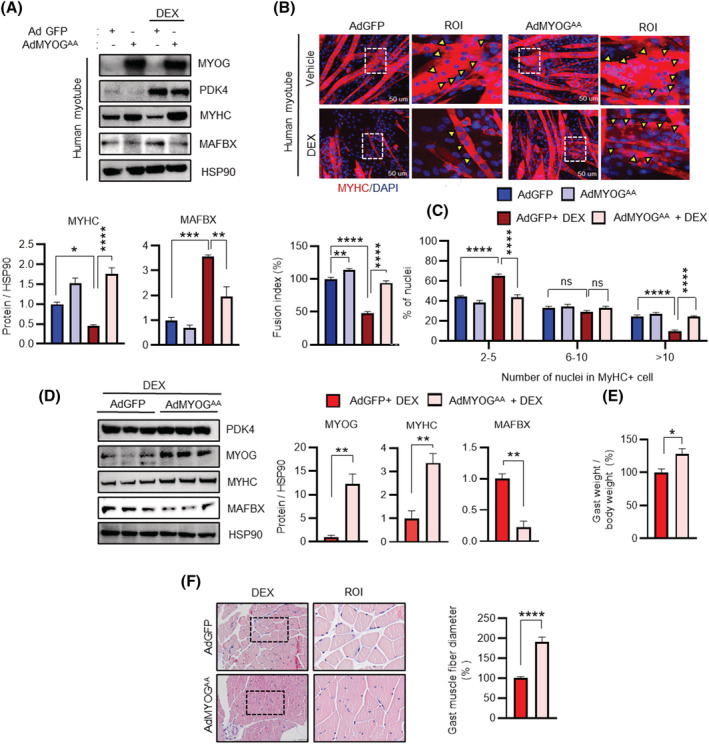
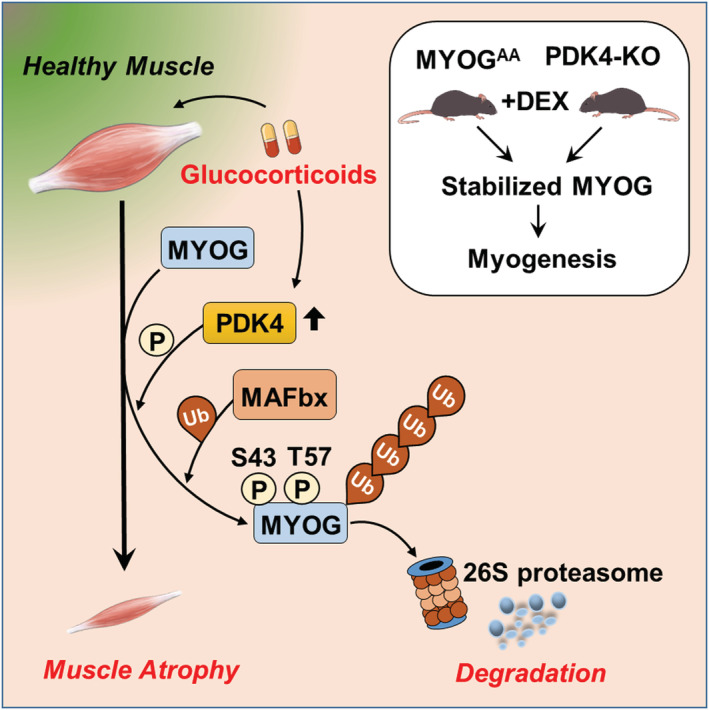
Results: Knockdown of PDK4 was found to prevent glucocorticoid-induced muscle atrophy and dysfunction in C2C12 myotubes, which was indicated by induction of myogenin (0.3271 ± 0.102 vs 2.163 ± 0.192, ****P < 0.0001) and myosin heavy chain (0.3901 ± 0.047 vs. 0.7222 ± 0.082, **P < 0.01) protein levels and reduction of muscle atrophy F-box (10.77 ± 2.674 vs. 1.518 ± 0.172, **P < 0.01) expression. In dexamethasone-induced muscle atrophy model, mice with genetic ablation of PDK4 revealed increased muscle strength (162.1 ± 22.75 vs. 200.1 ± 37.09 g, ***P < 0.001) and muscle fibres (54.20 ± 11.85% vs. 84.07 ± 28.41%, ****P < 0.0001). To explore the mechanism, we performed coimmunoprecipitation and liquid chromatography-mass spectrometry analysis and found that myogenin is novel substrate of PDK4. PDK4 phosphorylates myogenin at S43/T57 amino acid residues, which facilitates the recruitment of muscle atrophy F-box to myogenin and leads to its subsequent ubiquitination and degradation. Finally, overexpression of non-phosphorylatable myogenin mutant using intramuscular injection prevented dexamethasone-induced muscle atrophy and preserved muscle fibres.

Conclusions: We have demonstrated that PDK4 mediates dexamethasone-induced skeletal muscle atrophy. Mechanistically, PDK4 phosphorylates and degrades myogenin via recruitment of E3 ubiquitin ligase, muscle atrophy F-box. Rescue of muscle regeneration by genetic ablation of PDK4 or overexpression of non-phosphorylatable myogenin mutant indicates PDK4 as an amenable therapeutic target in muscle atrophy.

Keywords: PDK4; glucocorticoids; muscle atrophy; myogenin; phosphorylation; ubiquitin-proteasomal system.


Conflict of interest statement

Authors declare that they have no competing interests.

Figures

Figure 1
Figure 1
PDK4 is upregulated in human and mouse models of muscle atrophy. (A) Immunoblot analysis of indicated proteins in gastrocnemius anterior (GA) muscles from obese, corticotrophin releasing hormone (CRH)‐Tg mice, and Type 2 diabetes (T2D) human myotube. (Right) Quantification represents the levels of the indicated protein normalized to HSP90. (B) Immunoblot analysis of indicated proteins in human gluteus maximus muscles (GM) from a normal subject and steroid patients. (Right) Quantification represents the levels of the indicated protein normalized to ACTB. (C) Representative image of haematoxylin and eosin staining of myofibre cross section isolated from human gluteus maximus (hGM) muscles. A microscope with a ×20 objective was used to capture the images. (Right) the cross‐sectional diameter of human gluteus maximus (GM) muscles. (D) (GSE169571) RNA sequencing analysis of quadriceps muscles from saline and dexamethasone (DEX) treated mouse. (E) Immunoblot analysis of indicated proteins in VXY and FLAG‐tagged PDK4 overexpressing C2C12 myotubes stable cells. (Right) Quantification represents the levels of the indicated protein normalized to HSP90. (F) Representative image of MYOG immunofluorescence in VXY and PDK4‐flag expressing C2C12 myotubes stable cells. (Right) Quantification represents the levels of the MYOG + ve cell (Mean ± SEM). (C, F) Scale bar 50 μM. (A, D and E) n = 3. (F) n = 4; number of image capture sites 20 from each group. (B, C) n = 6 human per group. **P < 0.01; ***P < 0.001; ****P < 0.0001. Unpaired t‐test was used for all analyses.
Figure 2
Figure 2
Knockdown of PDK4 prevents glucocorticoids‐induced muscle atrophy in vitro. (A) Immunoblot analysis of indicated protein in C2C12 myotubes after being treated with dexamethasone (DEX) for 24 h with different concentrations of 0, 10, 50 and 100 μM. (Right) Quantification represents the levels of the indicated protein normalized to HSP90. (B) qPCR analysis of indicated genes in C2C12 myotubes transfected with shPdk4 or shControl and treated with or without dexamethasone (DEX) (100 μM) for 24 h. (C) Immunoblot analysis of indicated proteins in C2C12 myotubes transfected with shPdk4 or shControl and treated with or without dexamethasone (DEX) (100 μM) for 24 h. (Right) Quantification represents the levels of the indicated protein normalized to HSP90. (D, E) Representative image of MYOG and MYHC immunofluorescence of C2C12 myotubes transfected with shPdk4 or shControl and treated with or without dexamethasone (DEX) (100 μM) for 24 h. (Below) Quantification represents the levels of the MYOG + ve cell and (Below) fusion index. (F) The distribution of nuclei per myotubes were calculated at Day 6 differentiation. Yellow arrowheads number of nuclei in one myotube. Mean ± SEM. (D and E) Scale bar 50 μM. (A–C) n = 3. (D, E) n = 4; number of image capture sites 20 from each group. *P < 0.05; **P < 0.01; ***P < 0.001; ****P < 0.0001. Dunnett's multiple comparisons test was used for the analysed panel (A). *P < 0.05; **P < 0.01; ***P < 0.001; ****P < 0.0001. Tukey's multiple comparisons test was used for the analysed panels (B–F). ROI, region of interest. Red * = nonspecific band.
Figure 3
Figure 3
PDK4 mediates MYOG proteasomal degradation by ubiquitination. (A) Immunoblot analysis of indicated proteins in AD293T cells transfected with indicated constructs. After 48 h, cells were treated with or without MG132 10 μM for 6 h. (Right) Quantification represents the levels of the indicated protein normalized to HSP90. (B) C2C12 myotubes were transfected with the indicated Adenovirus (Ad‐Pdk4‐flag) and (Ad‐GFP) in the presence of MG132 10 μM for 6 h. Co‐immunoprecipitation (co‐IP) using MYOG antibody and immunoblot analysis of indicated proteins. (Right) Quantification represents the levels of the poly‐ub MYOG protein. (C) AD293T cells were transfected with indicated constructs; after 48 h, cells were treated with or without MG132 10 μM for 6 h. Co‐immunoprecipitation (co‐IP) using HA antibody and immunoblot analysis of indicated proteins. (D) Immunoblot analysis of indicated proteins in C2C12 myotubes transfected with control or Mafbx siRNA in the presence or absence of dexamethasone (DEX) 100 μM for 24 h. (Right) Quantification represents the levels of the indicated protein normalized to HSP90. Mean ± SEM. (A, D) n = 3. *P < 0.05; **P < 0.01; ***P < 0.001; ****P < 0.0001. Tukey's multiple comparisons test was used for the analysed panel (A) and unpaired t‐test was used for the analysed panel (B). Red * = nonspecific band.
Figure 4
Figure 4
Identification of MYOG as a novel substrate of PDK4. (A) AD293T cells were transfected with indicated constructs. After 48 h, cells were treated with or without MG132 10 μM for 6 h. Co‐immunoprecipitation (co‐IP) using HA antibody and immunoblot analysis of indicated proteins. (B) AD293T cells were transfected with indicated constructs and performed in situ proximity ligation assay (PLA). (C) In vitro kinase assay. Using recombinant GST‐MYOG and PDK4 protein in the presence of ATP and the phosphorylation was detected by indicated antibody. (D) AD293T cells were transfected with indicated constructs for 48 h. Co‐immunoprecipitation (co‐IP) using HA antibody and immunoblot analysis of indicated proteins. (E) AD293T cells were transfected with indicated constructs. After 48 h, transfected cells were treated with cycloheximide (CHX) 100 μM and incubated cells for indicated time before harvest. Immunoblot analysis of indicated proteins. (Below) Quantification represents the levels of the indicated protein normalized to HSP90. (F) C2C12 myotubes were infected with adenovirus expressing MYOG (AdMYOG) and mutant MYOGᴬᴬ (AdMYOGᴬᴬ) in the presence or absence of dexamethasone (DEX) (100 μM) for 24 h, treated MG132 10 μM for 6 h. Co‐immunoprecipitation (co‐IP) using HA antibody and immunoblot analysis of indicated proteins. (Below) Quantification represents the levels of the poly‐ub MYOG protein. Mean ± SEM. (B) Scale bar 50 μM. (E) n = 3. *P < 0.05; **P < 0.01; ***P < 0.001; ****P < 0.0001. Unpaired t‐test was used for the analysed panels (E, F). ROI, region of interest.
Figure 5
Figure 5
Ectopic overexpression of MYOG mutant protects against glucocorticoids‐induced muscle atrophy in human myotube and mice. (A) Immunoblots analysis of indicated proteins in human myotubes infected with adenovirus expressing mutant MYOGᴬᴬ (Ad MYOGᴬᴬ) or GFP (AdGFP). Myotubes were culture for 24 h in the presence or absence of dexamethasone (DEX) 100 μM. (Below) Quantification represents the levels of the indicated protein normalized to HSP90. (B) Representative image of MYHC immunofluorescence in human myotubes infected with adenovirus expressing mutant MYOGᴬᴬ (Ad MYOGᴬᴬ) or GFP (AdGFP) in the presence or absence of dexamethasone (DEX) 100 μM for 24 h. (Below) Quantification represents the levels of fusion index and the distribution of nuclei per myotube were calculated at Day 6 differentiation. (C) The distribution of nuclei per myotubes were calculated at Day 6 differentiation. Yellow arrowheads indicate the number of nuclei in one myotube. (D) Immunoblots analysis of indicated proteins in gastrocnemius anterior (GA) muscle. (Right) Quantification represents the levels of the indicated protein normalized to HSP90. (E) The ratio of the weight of gastrocnemius anterior (GA) to total body weight. (F) Representative image of haematoxylin and eosin staining of myofibre cross section from AdGFP or AdMYOGᴬᴬ injected in gastrocnemius anterior muscles from dexamethasone (DEX)‐treated mice. A microscope with a ×20 objective was used to capture the images. (Right) the cross‐sectional diameter of gastrocnemius anterior (GA) muscle. Mean ± SEM. (B) Scale bar 50 μM. (F) n = 5 for each group. (A, E) n = 3. (B, C) n = 4; number of image capture sites 20 from each group. *P < 0.05; **P < 0.01; ***P < 0.001; ****P < 0.0001. Unpaired t‐test was used for analyzed for panel (E–F). *P < 0.05; **P < 0.01; ***P < 0.001; ****P < 0.0001. Tukey's multiple comparisons test was used for analysed panels (A–C). ROI = region of interest.
Figure 6
Figure 6
PDK4 ablation prevents muscle loss in glucocorticoids ‐induced muscle atrophy in mice. (A) Experimental scheme for dexamethasone‐induced muscle atrophy model in WT and Pdk4KO mice. (B) Immunoblots analysis of indicated proteins using gastrocnemius anterior (GA) muscle. (Right) Quantification represents the levels of the indicated protein normalized to HSP90. (C) Total body weight. (D) Grip strength test. (E) The ratio of gastrocnemius anterior (GA) muscle weight to body weight. (F) Representative haematoxylin and eosin staining of myofibre cross‐section of Gast. A microscope with a ×20 objective was used to capture the images. (Right) the cross‐sectional diameter of gastrocnemius anterior (GA) muscle. Mean ± SEM. (F) Scale bar 50 μM. (B) n = 3 for each group. (C–F) n = 6 for each group. & P < 0.05; && P < 0.01; &&& P < 0.001; &&&& P < 0.0001, Pdk4KO + DEX vs WT + DEX. # P < 0.05; ## P < 0.01; ### P < 0.001; #### P < 0.0001, Pdk4KO versus WT + DEX. *P < 0.05; **P < 0.01; ***P < 0.001; ****P < 0.0001, WT versus WT + DEX. (Body weight and grip strength). *P < 0.05; **P < 0.01; ***P < 0.001; ****P < 0.0001. Tukey's multiple comparisons test was used for the analysed panels (B, E, and F). ROI, region of interest.
Figure 7
Figure 7
Proposed model for PDK4‐induced muscle atrophy.

References

    1. Fu X, Zhu M, Zhang S, Foretz M, Viollet B, Du M. Obesity impairs skeletal muscle regeneration through inhibition of AMPK. Diabetes 2016;65:188–200. - PMC - PubMed
    1. Pin F, Novinger LJ, Huot JR, Harris RA, Couch ME, O'Connell TM, et al. PDK4 drives metabolic alterations and muscle atrophy in cancer cachexia. FASEB J 2019;33:7778–7790. - PMC - PubMed
    1. Shen S, Liao Q, Liu J, Pan R, Lee SMY, Lin L. Myricanol rescues dexamethasone‐induced muscle dysfunction via a sirtuin 1‐dependent mechanism. J Cachexia Sarcopenia Muscle 2019;10:429–444. - PMC - PubMed
    1. Vandewalle J, Luypaert A, de Bosscher K, Libert C. Therapeutic mechanisms of glucocorticoids. Trends Endocrinol Metab 2018;29:42–54. - PubMed
    1. Schakman O, Kalista S, Barbé C, Loumaye A, Thissen JP. Glucocorticoid‐induced skeletal muscle atrophy. Int J Biochem Cell Biol 2013;45:2163–2172. - PubMed

Publication types