. 2022 Oct 19:11:e77974.
doi: 10.7554/eLife.77974.

Single-cell analysis of skeletal muscle macrophages reveals age-associated functional subpopulations

Affiliations

Single-cell analysis of skeletal muscle macrophages reveals age-associated functional subpopulations

Linda K Krasniewski et al. Elife. .

Abstract

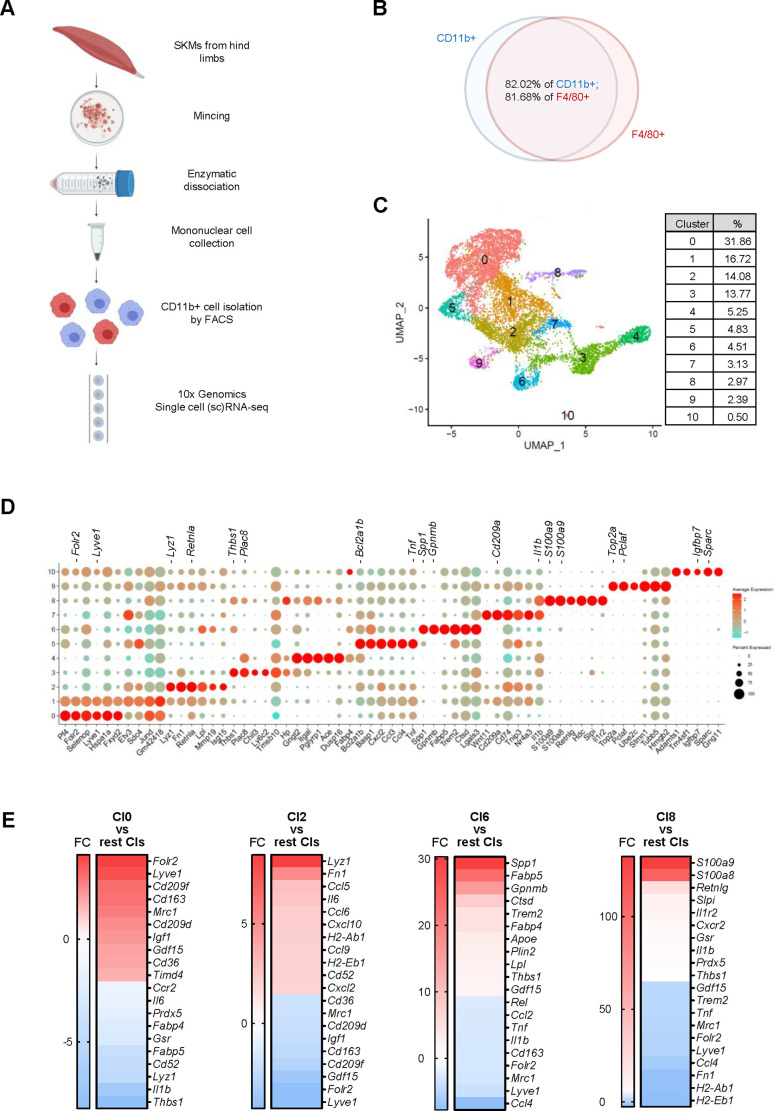
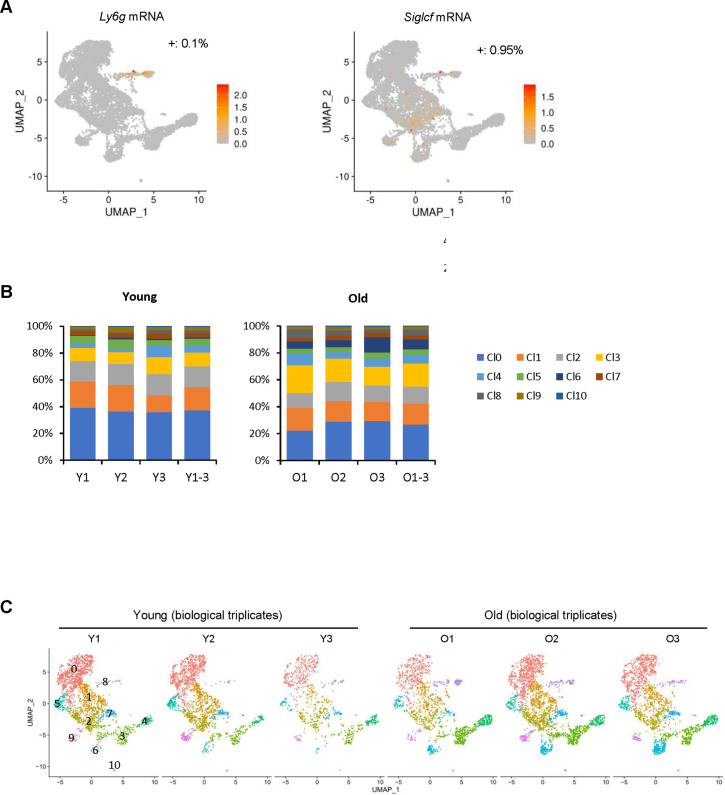
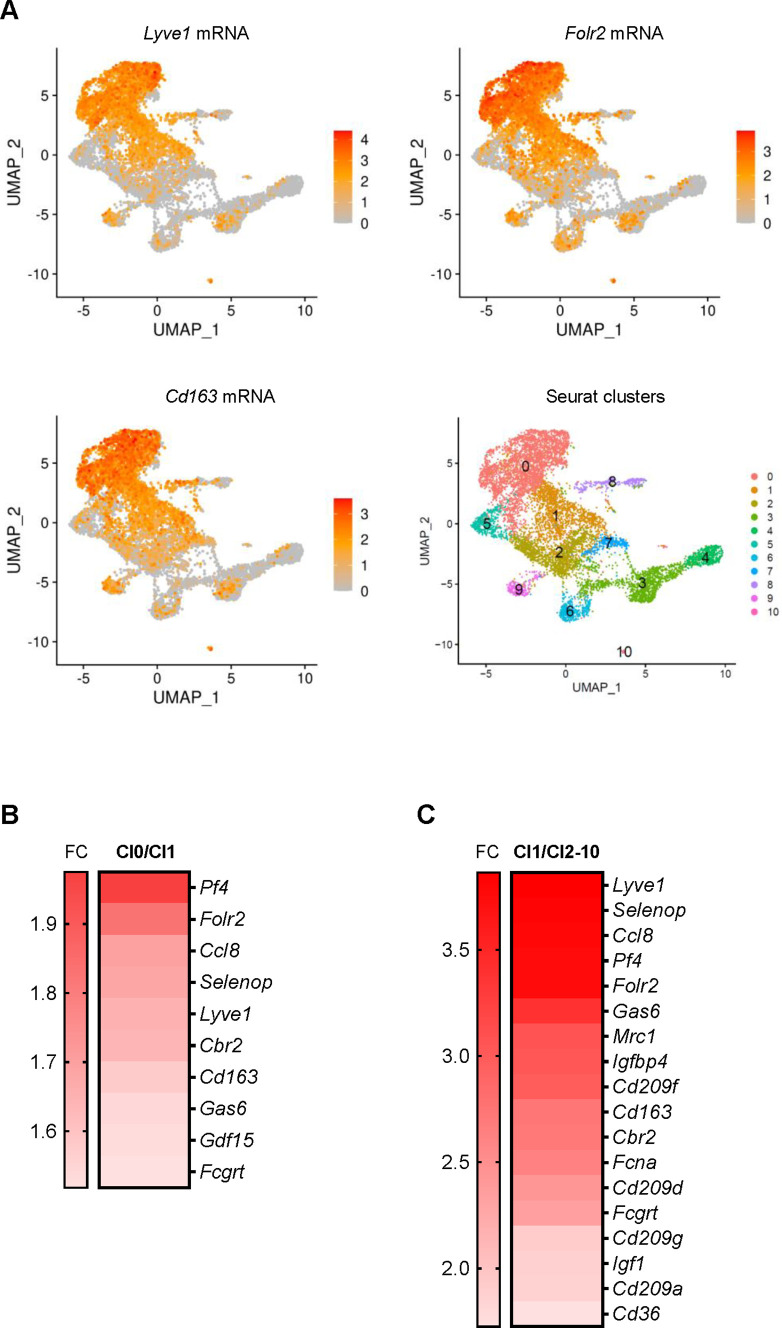
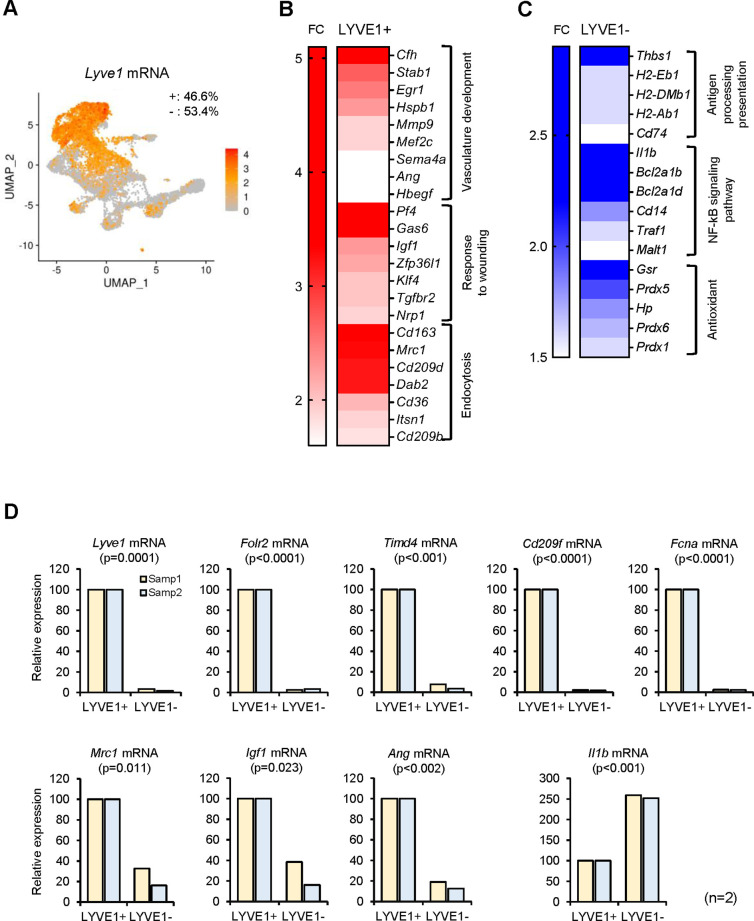
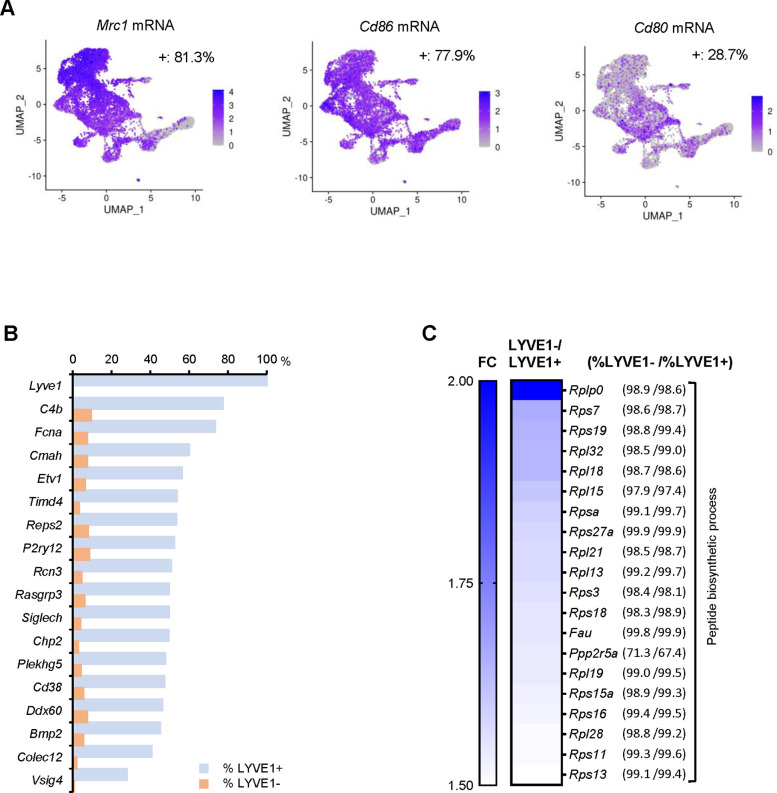
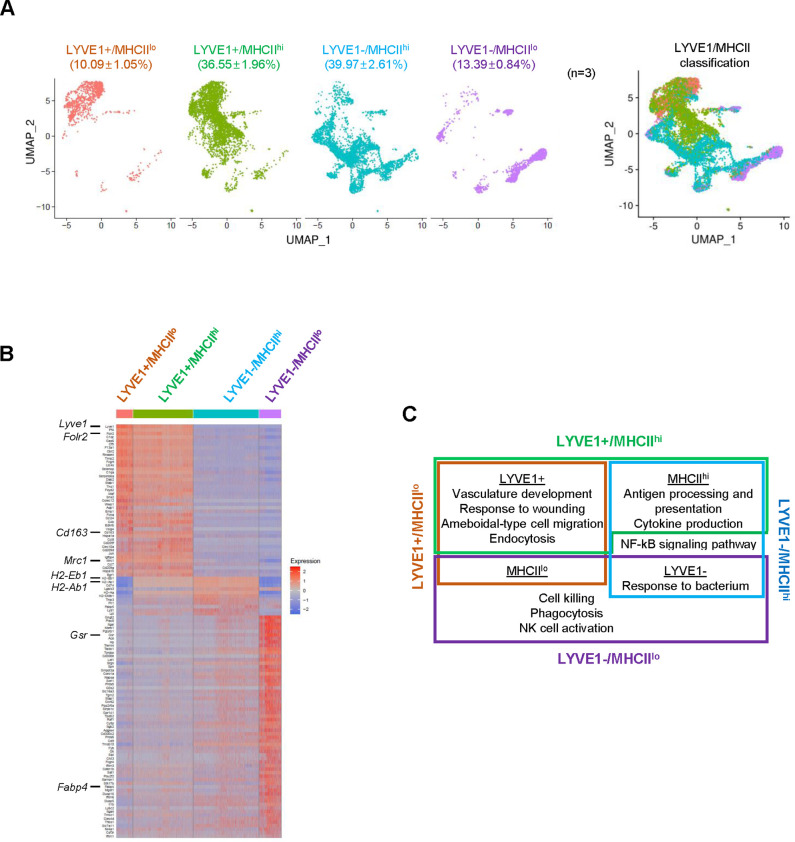
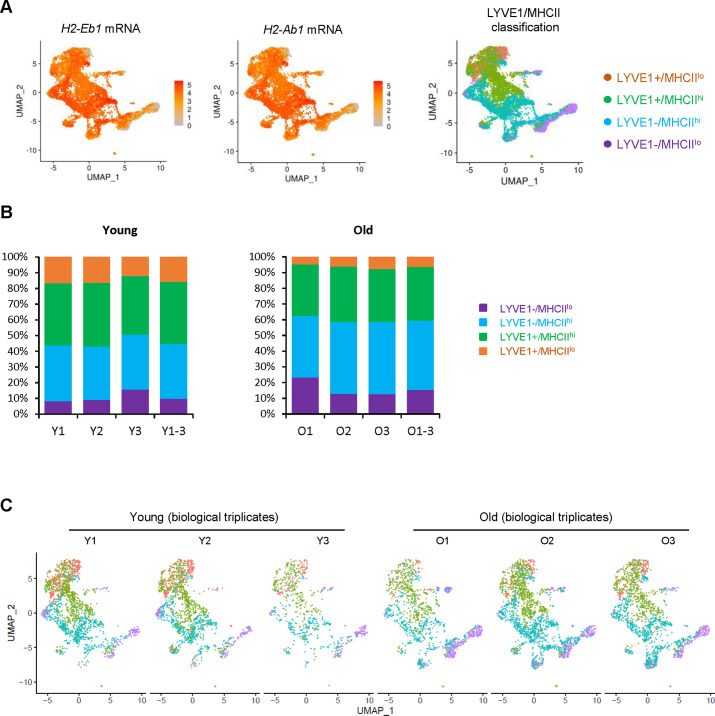
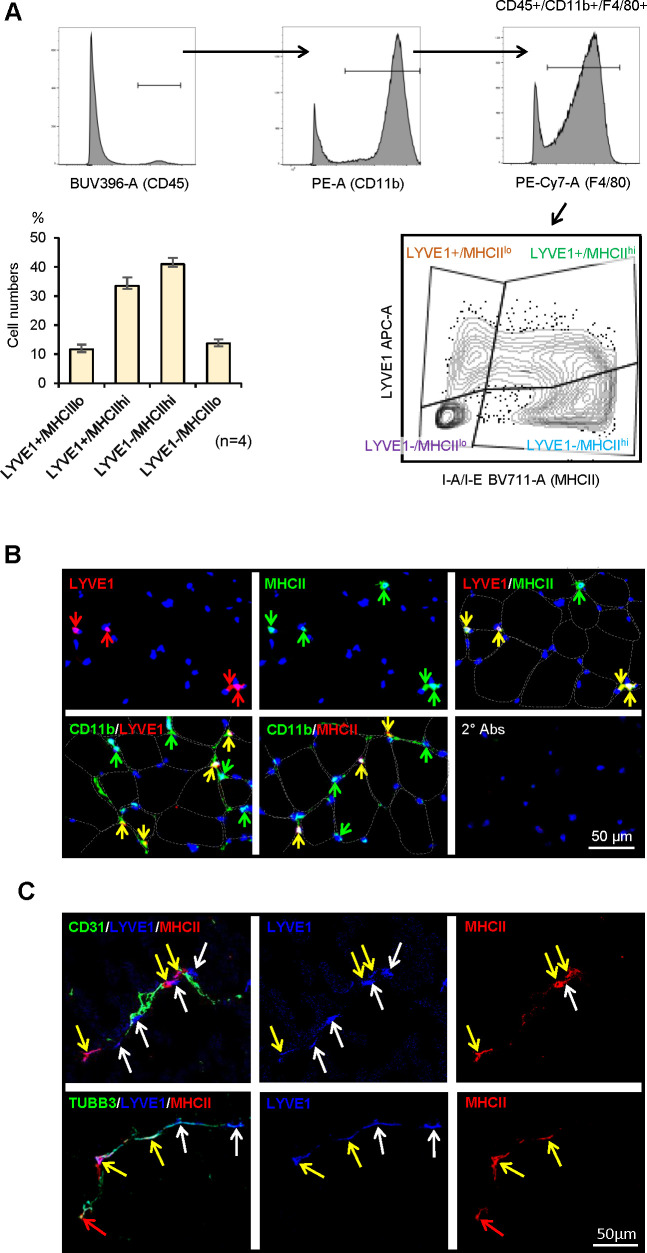
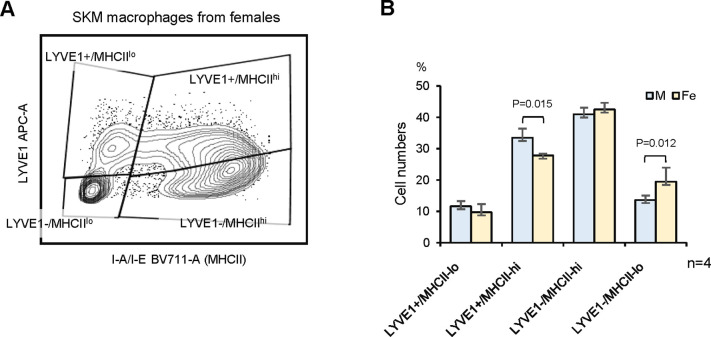
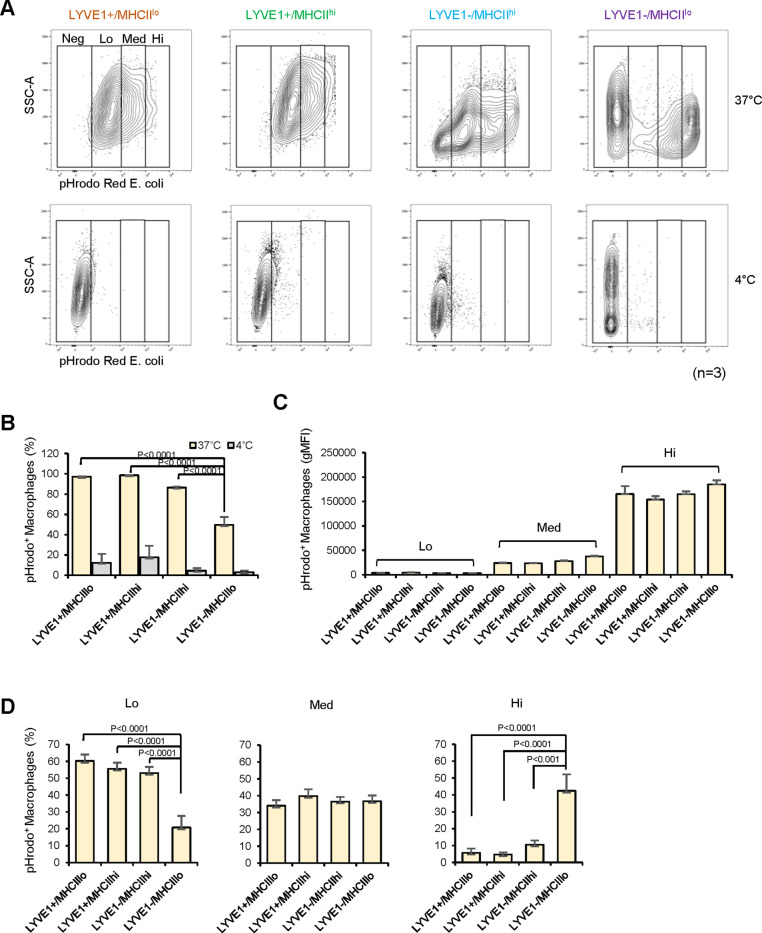
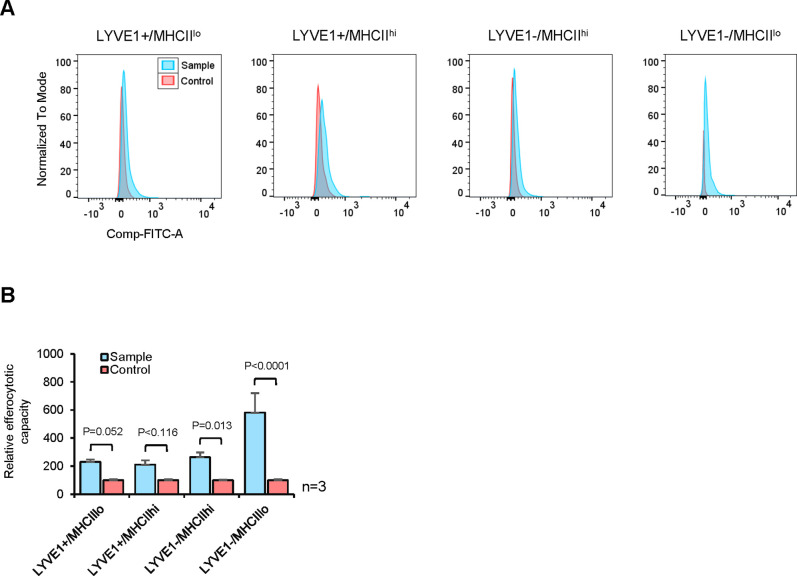
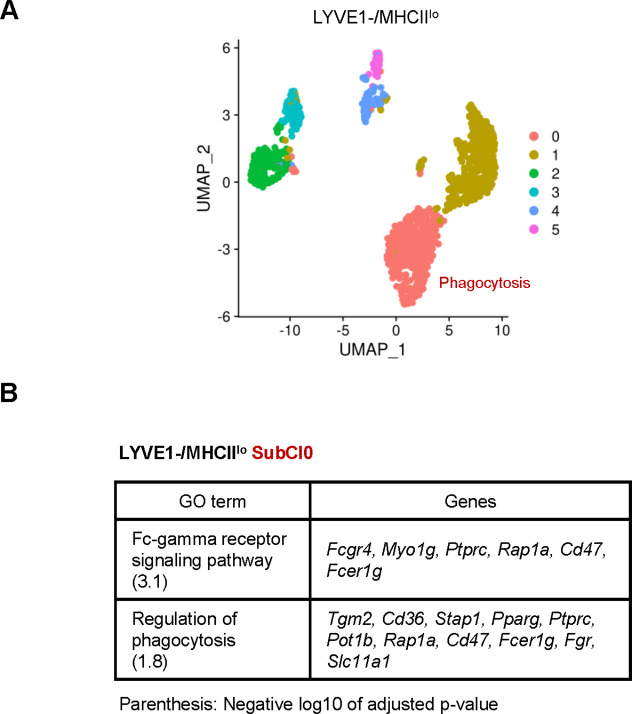
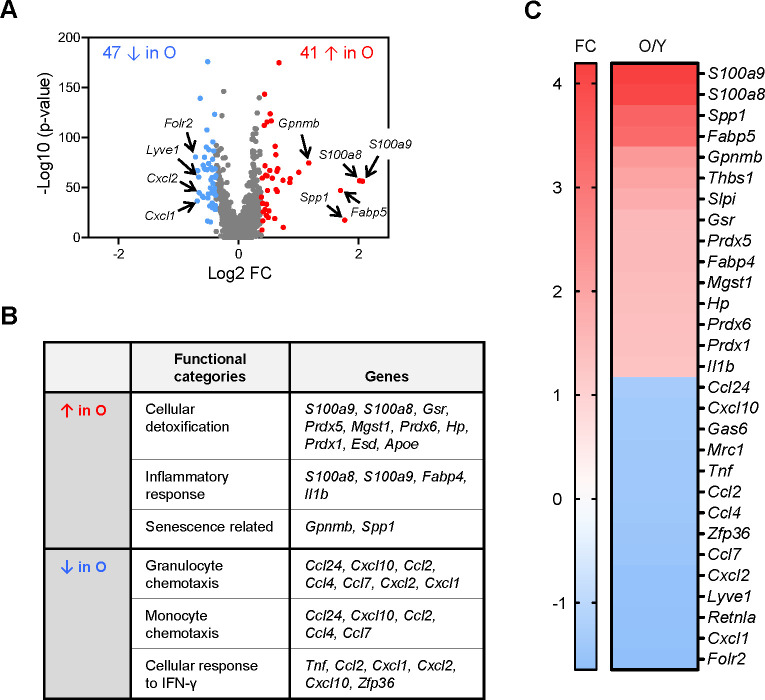
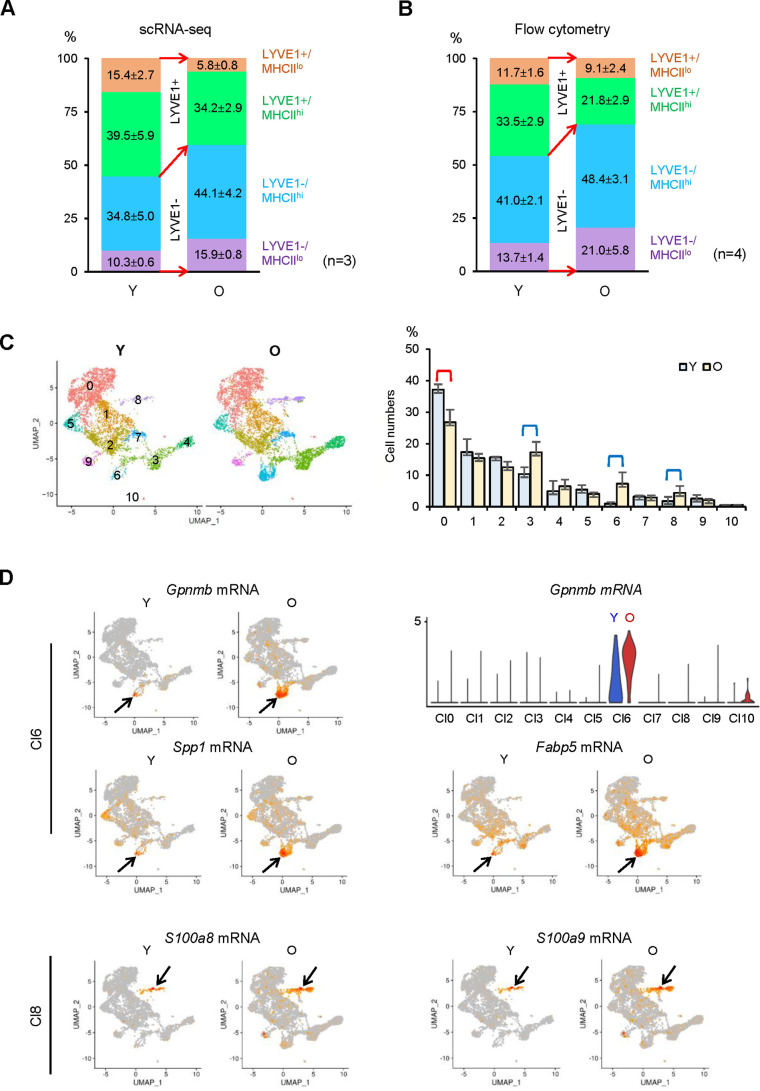
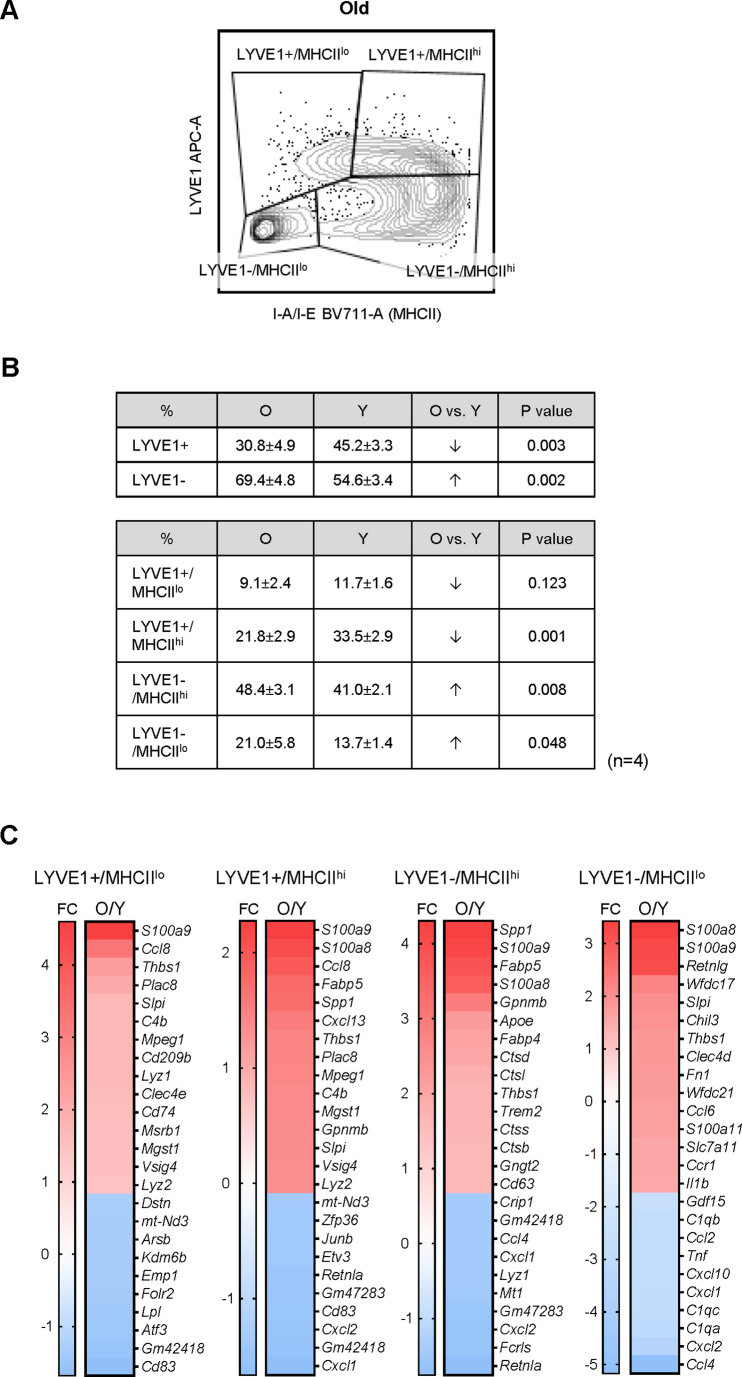
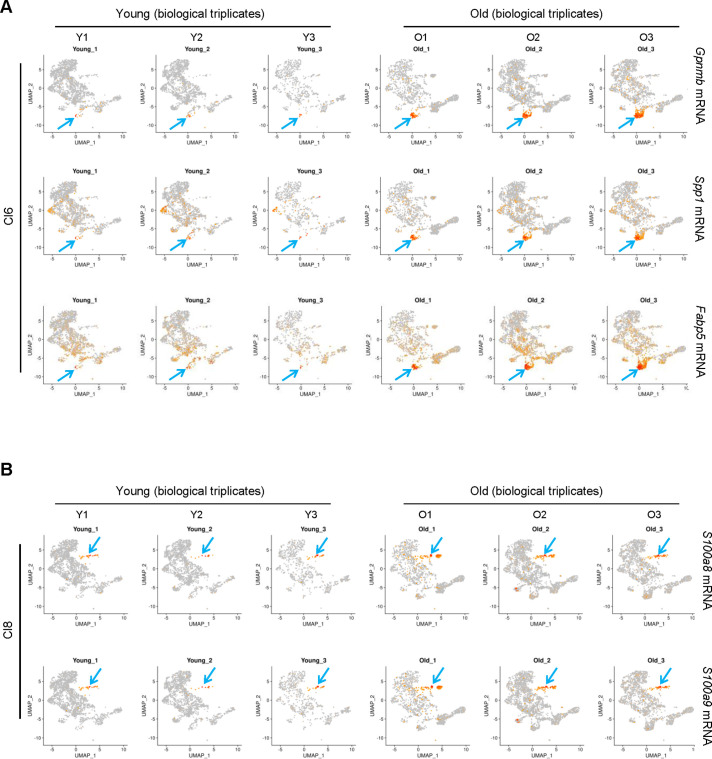
Tissue-resident macrophages represent a group of highly responsive innate immune cells that acquire diverse functions by polarizing toward distinct subpopulations. The subpopulations of macrophages that reside in skeletal muscle (SKM) and their changes during aging are poorly characterized. By single-cell transcriptomic analysis with unsupervised clustering, we found 11 distinct macrophage clusters in male mouse SKM with enriched gene expression programs linked to reparative, proinflammatory, phagocytic, proliferative, and senescence-associated functions. Using a complementary classification, membrane markers LYVE1 and MHCII identified four macrophage subgroups: LYVE1-/MHCIIhi (M1-like, classically activated), LYVE1+/MHCIIlo (M2-like, alternatively activated), and two new subgroups, LYVE1+/MHCIIhi and LYVE1-/MHCIIlo. Notably, one new subgroup, LYVE1+/MHCIIhi, had traits of both M2 and M1 macrophages, while the other new subgroup, LYVE1-/MHCIIlo, displayed strong phagocytic capacity. Flow cytometric analysis validated the presence of the four macrophage subgroups in SKM and found that LYVE1- macrophages were more abundant than LYVE1+ macrophages in old SKM. A striking increase in proinflammatory markers (S100a8 and S100a9 mRNAs) and senescence-related markers (Gpnmb and Spp1 mRNAs) was evident in macrophage clusters from older mice. In sum, we have identified dynamically polarized SKM macrophages and propose that specific macrophage subpopulations contribute to the proinflammatory and senescent traits of old SKM.

Keywords: Lyve1; MHCII; aging; cell biology; flow cytometry; mouse; muscle-resident macrophages; single-cell analysis.


Conflict of interest statement

LK, PC, CC, KM, CD, YP, JF, CS, TW, CN, IR, RM, DT, SD, PS, LF, MG No competing interests declared

Figures

Figure 1.
Figure 1.. Macrophage isolation from mouse skeletal muscle (SKM) and single-cell RNA-seq analysis.
(A) Workflow of mononuclear cell collection from mouse SKM, CD11b+ cell isolation by FACS, and single-cell RNA-seq analysis using the 10× Genomics platform. (B) Cells isolated from mouse SKM that were CD11b+ and F4/80+. (C) Unsupervised clustering of SKM macrophages revealed 11 clusters. %, proportion of each cluster. (D) Dot plot shows featured mRNAs in each cluster. (E) Heat maps show enriched genes in Cl0, 2, 6, and 8.
Figure 1—figure supplement 1.
Figure 1—figure supplement 1.. Quality control experiments for the skeletal muscle (SKM) macrophage, single-cell RNA-seq analysis.
(A) Uniform Manifold Approximation and Projection (UMAP) analysis to assess possible contamination of neutrophils and eosinophils in the CD11b+/F4/80+double-positive macrophage population. (B) Percentages of macrophages in each cluster and each biological replicate in young (Y) SKM and old (O) SKM. (C) UMAP representation of three biological replicates of macrophages from young (Y) SKM and old (O) SKM.
Figure 1—figure supplement 2.
Figure 1—figure supplement 2.. M2-like features of Cl1 in unsupervised clustering.
(A) Uniform Manifold Approximation and Projection (UMAP) representation of Lyve1, Folr2, and Cd163 mRNAs, encoding M2 markers in Cl0 compared to Cl1. Bottom right, designation of unsupervised clusters. (B) Expression levels of M2 marker genes in Cl0 to Cl1. (C) Enrichment of mRNAs encoding M2 markers in Cl1 relative to Cl2-10.
Figure 2.
Figure 2.. Functional clusters of genes differentially expressed in LYVE1+ and LYVE1− macrophages following single-cell RNA-sequencing (scRNA-seq) analysis.
(A) Lyve1 mRNA expression pattern in skeletal muscle (SKM) macrophages. (B) mRNAs highly expressed in functional clusters of LYVE1+ macrophages. (C) mRNAs highly expressed in LYVE1− macrophages. (D) Validation of select mRNAs differentially abundant as identified in panels (B and C). LYVE1+ and LYVE1− macrophages were isolated by fluorescence-activated cell sorting (FACS) from three male mice, 3 months old (m.o.), and mRNAs elevated in LYVE1+ macrophages (top and bottom left), and mRNAs predominantly elevated in LYVE1− macrophages (bottom right) were quantified by RT-quantitative PCR (qPCR) analysis. Data were normalized to the levels of Gapdh mRNA, also measured by RT-qPCR analysis. Data represent the means and SD from two different sorts for each group.
Figure 2—figure supplement 1.
Figure 2—figure supplement 1.. mRNAs highly expressed in LYVE1+ or LYVE1− macrophages.
(A) Mrc1 (Cd206), Cd86, and Cd80 mRNAs expressed in skeletal muscle (SKM) macrophages. (B) mRNAs almost exclusively expressed in LYVE1+ macrophages. (C) Cluster of mRNAs encoding ribosomal proteins highly expressed in LYVE1− macrophages. Note, genes listed in this panel were expressed in similar number of macrophages in the LYVE1+ and LYVE1− subpopulations but were highly expressed in the LYVE1− subpopulation.
Figure 3.
Figure 3.. Classification of mouse skeletal muscle (SKM) macrophages into four functional subgroups according to surface markers.
(A) Subclassification of mouse SKM macrophages based on LYVE1 and MHCII levels: LYVE1+/MHCIIlo, LYVE1+/MHCIIhi, LYVE1−/MHCIIhi, and LYVE1−/MHCIIlo. Uniform Manifold Approximation and Projection (UMAP) analysis of the distribution and size of each of four subgroups individually (left) and combined (right). (B) Heat map analysis of the single-cell RNA-sequencing (scRNA-seq) data depicting distinct gene expression patterns of the four subgroups. (C) Gene ontology (GO) annotation of the functions of each subgroup. Brown box, LYVE1+/MHCIIlo; green box, LYVE1+/MHCIIhi; blue box, LYVE1−/MHCIIhi; purple box, LYVE1−/MHCIIlo.
Figure 3—figure supplement 1.
Figure 3—figure supplement 1.. LYVE1 and MHCII are used to classify skeletal muscle (SKM) macrophages into four subgroups.
(A) Expression patterns of two MHCII genes, H2-Eb1 and H2-Ab1 mRNAs. Right, four supervised macrophage subgroups. (B) Percentages of macrophages in each subgroup and each biological replicate in young (Y) and old (O) SKM. (C) Biological replicates of macrophage classification in young (Y) and old (O) SKM.
Figure 4.
Figure 4.. Characterization of macrophage subgroups by flow cytometry and immunofluorescence staining.
(A) Flow cytometric analysis of the four subgroups in skeletal muscle (SKM). CD45+/CD11b+/F4/80+macrophages (top three panels show gating) were further classified by LYVE1 and MHCII (bottom right). LYVE1+/MHCIIlo, LYVE1−/MHCIIhi, and LYVE1−/MHCIIlo subgroups formed clear cell clusters, while LYVE1+/MHCIIhi spanned LYVE1+/MHCIIlo and LYVE1−/MHCIIhi. Note: the sizes of each subgroup by flow cytometric analysis (bottom left) were similar to those seen with single-cell RNA-seq analysis. Gating was based on FMO (fluorescence minus one) controls for each experiment. (B) Immunofluorescence analysis of the presence of LYVE1+/MHCIIhi macrophages in mouse SKM. Top, LYVE1+, MHCII+, and LYVE1+/MHCII+ double-positive cells in endomysium and perimysium areas of mouse SKM. Bottom, colocalization of LYVE1 (left) and MHCII (middle) with CD11b, a macrophage marker; secondary antibodies only (right). (C) LYVE1+ macrophages LYVE1+/MHCIIlo and LYVE1+/MHCIIhi, colocalizing with CD31+, depicting blood vessels (top). LYVE1+ and LYVE1− macrophages colocalizing with the nerve fiber marker TUBB3+ (bottom).
Figure 4—figure supplement 1.
Figure 4—figure supplement 1.. Skeletal muscle (SKM) macrophages from female mice.
(A) Flow cytometric analysis of the four macrophage subgroups in females and males. (B) Quantification of the numbers of each SKM macrophage group in female and male mice.
Figure 5.
Figure 5.. Analysis of the phagocytic capacities of each macrophage subgroup.
(A) Phagocytic activity was measured for mouse skeletal muscle (SKM) macrophages at 4°C (control, low phagocytosis) and 37°C (active phagocytosis, right boxes). Phagocytic capacity was divided into groups that were negative (Neg; intensity <103), low (Lo; 103–104), medium (Med; 104–105), and high (Hi; >105), depending on signal intensities. Gating was established using fluorescence minus one (FMO) controls for each experiment. (B) Quantification of the macrophages showing active phagocytosis (Lo + Med + Hi) in the four subgroups. (C) Signal intensities of macrophages in each capacity group (Lo, Med, and Hi). (D) Quantification of number of active phagocytic macrophages in each subgroup of the three intensity groups. Data are representative of three independent experiments.
Figure 5—figure supplement 1.
Figure 5—figure supplement 1.. Efferocytotic capacities of four macrophage subgroups.
(A) Efferocytosis assays to identify macrophages phagocytizing apoptotic cells. (B) Quantification of the efferocytosis activity of each macrophage subgroup.
Figure 5—figure supplement 2.
Figure 5—figure supplement 2.. Classification of LYVE1−/MHCIIlo subgroup by unsupervised clustering.
(A) Unsupervised clustering revealed six subclusters (SubCl) in LYVE1−/MHCIIlo subgroup. (B) Gene ontology (GO) terms and associated genes in SubCl0.
Figure 6.
Figure 6.. Analysis of gene expression programs in skeletal muscle (SKM) macrophages from young and old mice before clustering.
(A) In single-cell RNA-sequencing (scRNA-seq) analysis, a total of 88 mRNAs were differentially expressed between old and young SKM. Arrows indicate featured mRNAs upregulated (red) or downregulated (blue) in old SKM macrophages. (B) Gene ontology (GO) annotation depicting the functional categories that were upregulated and downregulated in the old SKM macrophages relative to young SKM macrophages. (C) Fold changes in the abundance of select mRNAs (O/Y), as determined from the scRNA-seq analysis.
Figure 6—figure supplement 1.
Figure 6—figure supplement 1.. Number of CD45+, CD45+/CD11b+, and CD45+/CD11b+/F4/80+ cells obtained from young and old males and females.
(A) Number of corresponding cells from skeletal muscle (SKM) tissues. Male mice tend to have more CD45+, CD45+/CD11b+, and CD45+/CD11b+/F4/80+ cells compared to females (not statistically significant). (B) Females show very similar numbers between young and old. (C) % of corresponding cell populations in CD45+ cells in young and old males. (D) % of corresponding cell populations in CD45+ cells in young and old females.
Figure 7.
Figure 7.. Identification of changes in macrophage subpopulations in old (O) relative to young (Y) skeletal muscle (SKM).
(A) Single-cell RNA-sequencing (scRNA-seq) analysis showing altered numbers of LYVE1+ and LYVE1− macrophages in old SKM. (B) Flow cytometric analysis showing comparable changes with scRNA-seq in old SKM. (C) Changes in macrophage numbers in unsupervised Cl0, 3, 6, and 8. (D) Top, UMAP plots showing Gpnmb, Spp1 and Fabp5 mRNAs in old (O) and young (Y) SKM (arrow, Cl6); violin plot representing Gpnmb mRNA (number of macrophages and expression levels) in the different clusters. Bottom, S100a8 and S100a9 mRNAs in O and Y SKM (arrow, Cl8).
Figure 7—figure supplement 1.
Figure 7—figure supplement 1.. Changes in genes expressed by macrophages from old skeletal muscle (SKM).
(A) Flow cytometric analysis of macrophages from old SKM showing four subgroups, as in the young (Figure 4A). Gating was based on fluorescence minus one (FMO) controls for each experiment. (B) Top, % of LYVE1+ and LYVE1− macrophages in old and young SKM. Bottom, % of each of the four macrophage groups in old and young SKM. (C) Select mRNAs differentially expressed in young and old SKM macrophage subgroups.
Figure 7—figure supplement 2.
Figure 7—figure supplement 2.. Biological replicates of expression patterns in young and old skeletal muscle (SKM) macrophages.
(A) Biological replicates of expression patterns of select Cl6 genes. (B) Biological replicates of expression patterns of select Cl8 genes.
Author response image 1.

References

    1. Arnold L, Henry A, Poron F, Baba-Amer Y, van Rooijen N, Plonquet A, Gherardi RK, Chazaud B. Inflammatory monocytes recruited after skeletal muscle injury switch into antiinflammatory macrophages to support myogenesis. The Journal of Experimental Medicine. 2007;204:1057–1069. doi: 10.1084/jem.20070075. - DOI - PMC - PubMed
    1. Babaev VR, Runner RP, Fan D, Ding L, Zhang Y, Tao H, Erbay E, Görgün CZ, Fazio S, Hotamisligil GS, Linton MF. Macrophage MAL1 deficiency suppresses atherosclerosis in low-density lipoprotein receptor-null mice by activating peroxisome proliferator-activated receptor-γ-regulated genes. Arteriosclerosis, Thrombosis, and Vascular Biology. 2011;31:1283–1290. doi: 10.1161/ATVBAHA.111.225839. - DOI - PMC - PubMed
    1. Blackwell J, Harries LW, Pilling LC, Ferrucci L, Jones A, Melzer D. Changes in CEBPB expression in circulating leukocytes following eccentric elbow-flexion exercise. The Journal of Physiological Sciences. 2015;65:145–150. doi: 10.1007/s12576-014-0350-7. - DOI - PMC - PubMed
    1. Buchacher T, Ohradanova-Repic A, Stockinger H, Fischer MB, Weber V. M2 polarization of human macrophages favors survival of the intracellular pathogen Chlamydia pneumoniae. PLOS ONE. 2015;10:e0143593. doi: 10.1371/journal.pone.0143593. - DOI - PMC - PubMed
    1. Chakarov S, Lim HY, Tan L, Lim SY, See P, Lum J, Zhang XM, Foo S, Nakamizo S, Duan K, Kong WT, Gentek R, Balachander A, Carbajo D, Bleriot C, Malleret B, Tam JKC, Baig S, Shabeer M, Toh S, Schlitzer A, Larbi A, Marichal T, Malissen B, Chen J, Poidinger M, Kabashima K, Bajenoff M, Ng LG, Angeli V, Ginhoux F. Two distinct interstitial macrophage populations coexist across tissues in specific subtissular niches. Science. 2019;363:eaau0964. doi: 10.1126/science.aau0964. - DOI - PubMed

Publication types

Associated data