. 2023 Feb 6;13(2):332-347.
doi: 10.1158/2159-8290.CD-22-0210.

A Dynamic rRNA Ribomethylome Drives Stemness in Acute Myeloid Leukemia

Affiliations

A Dynamic rRNA Ribomethylome Drives Stemness in Acute Myeloid Leukemia

Fengbiao Zhou et al. Cancer Discov. .

Abstract

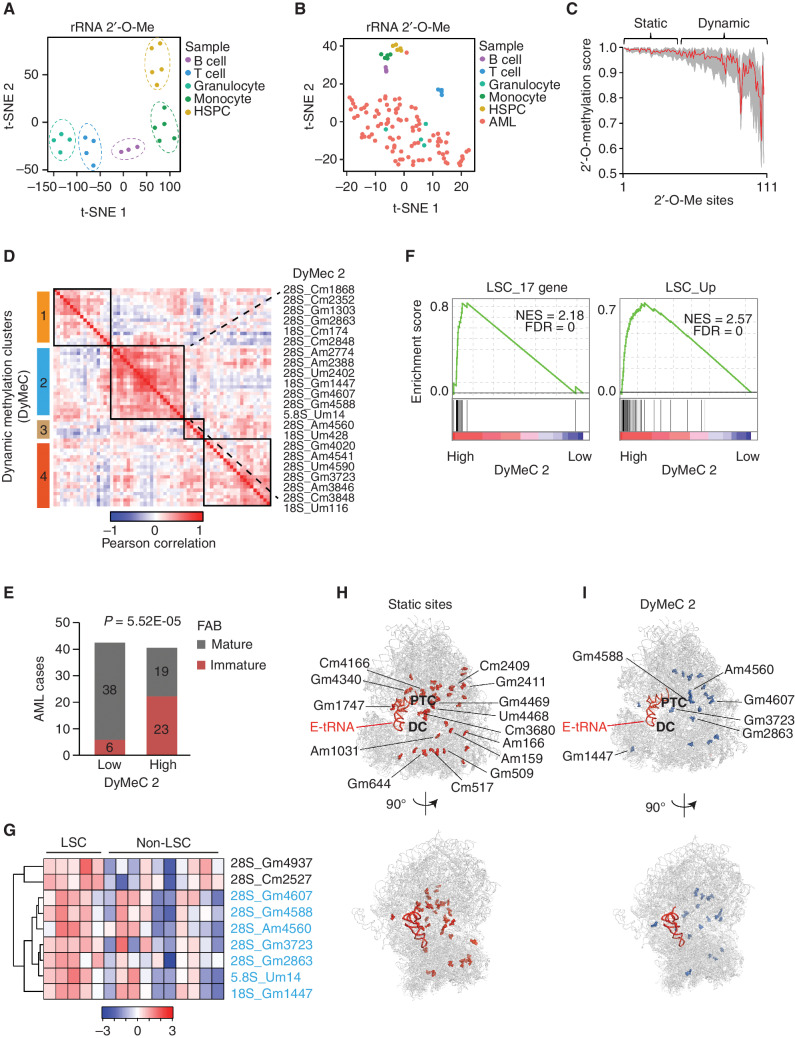
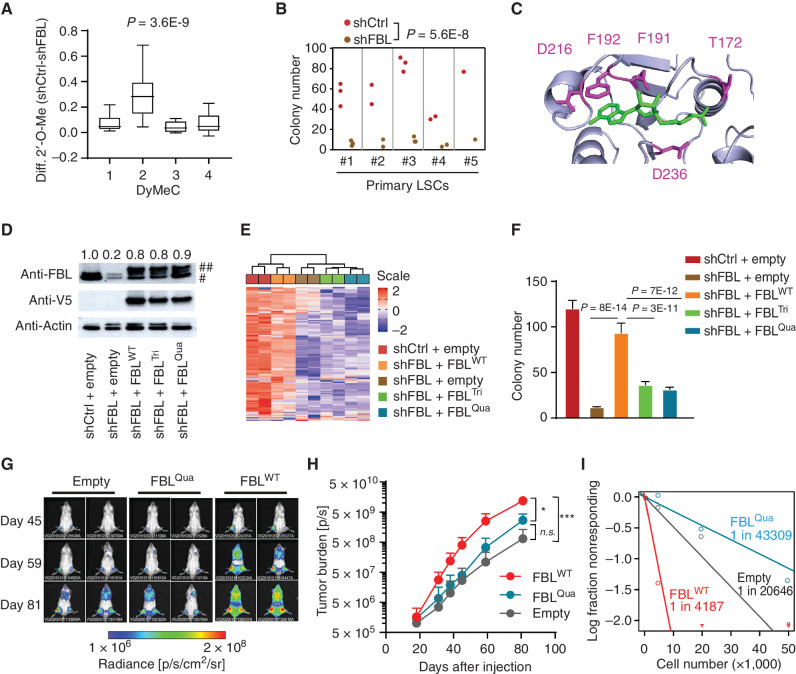
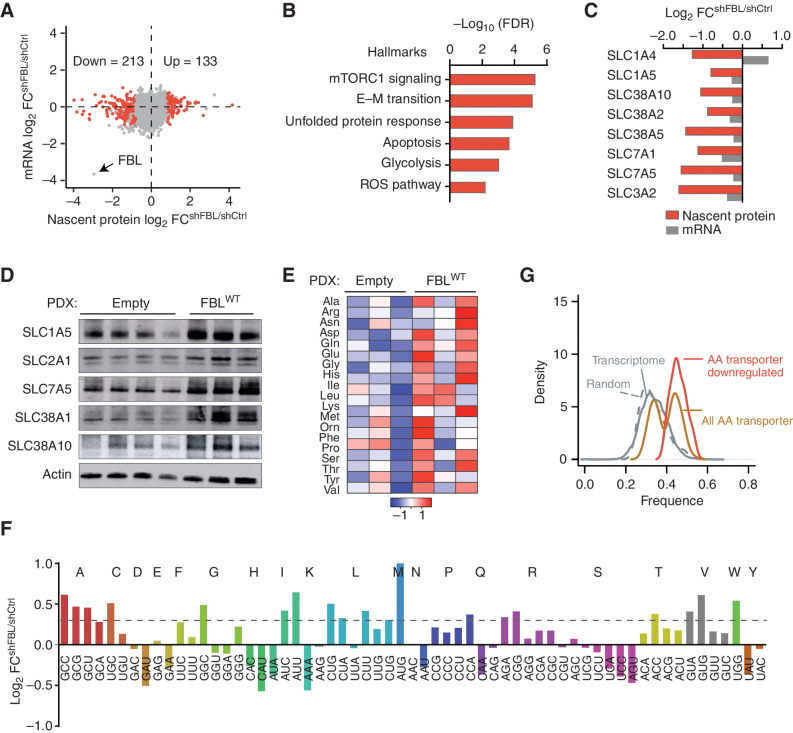
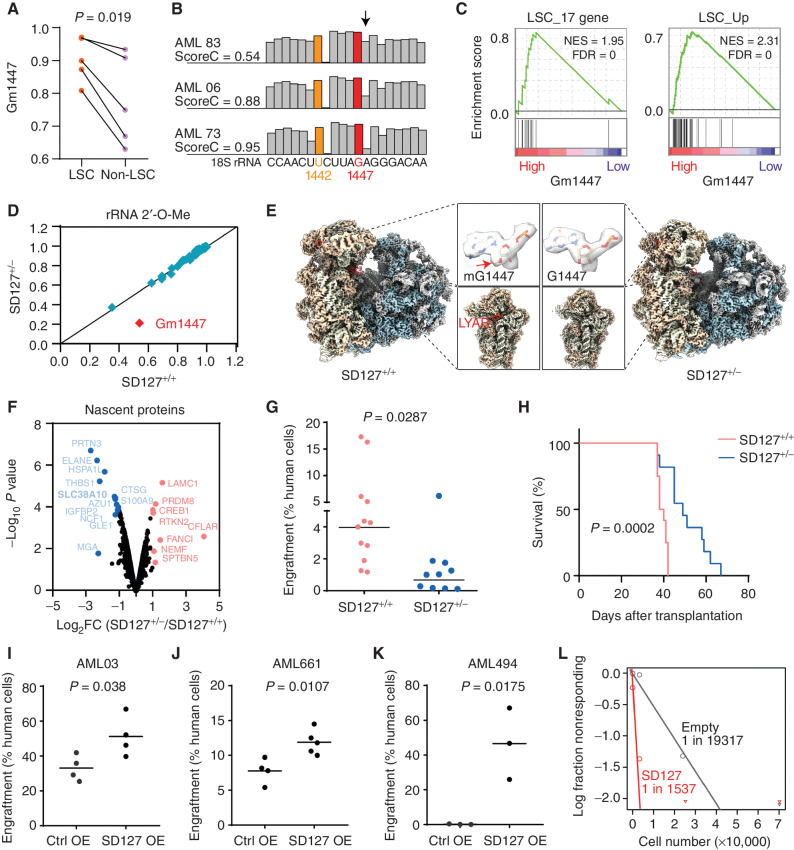
The development and regulation of malignant self-renewal remain unresolved issues. Here, we provide biochemical, genetic, and functional evidence that dynamics in ribosomal RNA (rRNA) 2'-O-methylation regulate leukemia stem cell (LSC) activity in vivo. A comprehensive analysis of the rRNA 2'-O-methylation landscape of 94 patients with acute myeloid leukemia (AML) revealed dynamic 2'-O-methylation specifically at exterior sites of ribosomes. The rRNA 2'-O-methylation pattern is closely associated with AML development stage and LSC gene expression signature. Forced expression of the 2'-O-methyltransferase fibrillarin (FBL) induced an AML stem cell phenotype and enabled engraftment of non-LSC leukemia cells in NSG mice. Enhanced 2'-O-methylation redirected the ribosome translation program toward amino acid transporter mRNAs enriched in optimal codons and subsequently increased intracellular amino acid levels. Methylation at the single site 18S-guanosine 1447 was instrumental for LSC activity. Collectively, our work demonstrates that dynamic 2'-O-methylation at specific sites on rRNAs shifts translational preferences and controls AML LSC self-renewal.

Significance: We establish the complete rRNA 2'-O-methylation landscape in human AML. Plasticity of rRNA 2'-O-methylation shifts protein translation toward an LSC phenotype. This dynamic process constitutes a novel concept of how cancers reprogram cell fate and function. This article is highlighted in the In This Issue feature, p. 247.


Figures

Figure 1. The dynamic rRNA 2′-O-methylation is associated with AML stemness. A, t-SNE analysis indicating cell type–specific rRNA 2′-O-methylation in normal human hematopoietic cells. HSPC, hematopoietic stem and progenitor cells. B, t-SNE analysis indicating distinct and heterogeneous rRNA 2′-O-methylation of human primary AMLs (n = 94). C, Variability of 2′-O-Me on each rRNA modification site across human AMLs. The 111 modification sites were ranked according to their 2′-O-Me diversity in AMLs. The Red line shows the average 2′-O-Me level of each site in AMLs, and gray indicates the range of 2′-O-Me. D, Unsupervised hierarchical clustering of pairwise correlation between rRNA dynamic sites based on 2′-O-Me in 94 patients with AML. Each column lists the correlation of one site (in row) with all dynamic sites. Four dynamic clusters (DyMeC, black boxes) with co-occurrence in 2′-O-methylation were identified. rRNA sites in DyMeC 2 are labeled. E, Number of AML cases with maturation classification in groups with low and high 2′-O-Me on DyMeC cluster 2. Immature, FAB M0 and M1 subtype; mature, FAB M2 to M6. P = 5.52E−04, Chi-square test. Patients with no FAB subtype information were not included in each group. F, GSEA plot showing enrichment of LSC gene signatures in patients with AML with higher total 2′-O-Me on DyMeC 2. G, Heat map of 2′-O-Me clusters with increased modification in LSC, supervised by cell types. Samples are in columns; 2′-O-Me sites are in rows. Blue indicates DyMeC 2 sites. H and I, Distribution of static (H) sites and the dynamic DyMeC 2 (I) on cryo-EM structure of the human ribosome. Labeled in H are sites located in ribosome-conserved function centers, and in I are LSC sites. E-site tRNA is shown in red; rRNA and r-proteins in gray. PDB code for the structure is 4UGO. Modification sites from 4UGO are reannotated to the rRNA sequence used for RiboMethSeq. DC, decoding center; PTC, peptidyl transferase center.
Figure 1.
The dynamic rRNA 2′-O-Me is associated with AML stemness. A, t-Schochastic neighbor embedding (t-SNE) analysis indicating cell type–specific rRNA 2′-O-Me in normal human hematopoietic cells. HSPC, hematopoietic stem and progenitor cells. B, t-SNE analysis indicating distinct and heterogeneous rRNA 2′-O-Me of human primary AMLs (n = 94). C, Variability of 2′-O-Me on each rRNA modification site across human AMLs. The 111 modification sites were ranked according to their 2′-O-Me diversity in AMLs. The red line shows the average 2′-O-Me level of each site in AMLs, and the gray indicates the range of 2′-O-Me. D, Unsupervised hierarchical clustering of pairwise correlation between rRNA dynamic sites based on 2′-O-Me in 94 patients with AML. Each column lists the correlation of one site (in row) with all dynamic sites. Four dynamic clusters (DyMeC, black boxes) with co-occurrence in 2′-O-Me were identified. rRNA sites in DyMeC 2 are labeled. E, Number of AML cases with maturation classification in groups with low and high 2′-O-Me on DyMeC cluster 2. Immature, FAB M0 and M1 subtype; mature, FAB M2 to M6. P = 5.52E−04, Chi-square test. Patients with no FAB subtype information were not included in each group. F, Gene set enrichment analysis plot showing enrichment of LSC gene signatures in patients with AML with higher total 2′-O-Me on DyMeC 2. G, Heat map of 2′-O-Me clusters with increased modification in LSC, supervised by cell types. Samples are in columns; 2′-O-Me sites are in rows. Blue indicates DyMeC 2 sites. NES, normalized enrichment score. H and I, Distribution of static sites (H) and the dynamic DyMeC 2 (I) on cryogenic electron microscopy structure of the human ribosome. Labeled in H are sites located in ribosome-conserved function centers and in I are LSC sites. E-site tRNA is shown in red; rRNA and r-proteins in gray. Protein Data Bank code for the structure is 4UGO. Modification sites from 4UGO are reannotated to the rRNA sequence used for RiboMethSeq. DC, decoding center.
Figure 2. The ribomethylome regulates AML stemness. A, Changes in 2′-O-Me on each dynamic cluster after FBL knockdown in Kasumi-1 AML cells. n = 4 independent experiments. Indicated P value by an unpaired Student t test. B, Colony number formed by control (shCtrl) and FBL knockdown (shFBL) LSC populations. For FBL knockdown, a pool of two different FBL-specific shRNAs was used. Indicated P value by an unpaired Student t test. C, Catalytic center of human FBL protein. Amino acid residues highlighted in purple are substrate binding sites. The substrate S-adenosyl-L-homocysteine (SAH) is highlighted in green. The structure is from PDB 5GIO. D, Western blot showing expression of V5-tagged exogenous wild-type and mutant FBL in FBL knockdown Kasumi-1 cells. Numbers on top indicate the relative expression level of total FBL compared with that in control cells. ##V5-tagged exogenous FBL; #endogenous FBL. E, Unsupervised clustering analysis of rRNA 2′-O-Me in FBL knockdown and rescued cells. The wild-type but not mutant FBL restored rRNA 2′-O-methylation. F, Colony formation assay showing the rescue effect of wild-type and mutant FBL. Mean ± SD from n = 9 cultures from three experiments per group is given, and statistical significance was assessed by Student unpaired t test. G, Representative bioluminescence imaging of NSG mice transplanted with AML PDX cells overexpressing empty control, mutant (FBLQua) and wild-type FBL. Images were taken at the indicated time points after transplantation. H, Summary of in vivo proliferation of PDX cells determined by bioluminescence imaging. Note that the signal from FBLWT mice was approaching saturation at day 81. n = 4 for empty control, n = 5 for FBLQua, n = 3 for FBLWT, ***, P = 0.001; *, P = 0.023; n.s., no significance, Student unpaired t test. I, Absolute LSC frequency in the bone marrow of each PDX estimated by in vivo limiting dilution assay. P = 0.0189, FBLWT vs. empty; P = 0.0006, FBLWT vs. FBLQua, Chi-square test.
Figure 2.
The ribomethylome regulates AML stemness. A, Changes in 2′-O-Me on each dynamic cluster after FBL knockdown in Kasumi-1 AML cells. n = 4 independent experiments. Indicated P value by an unpaired Student t test. B, Colony number formed by control (shCtrl) and FBL knockdown (shFBL) LSC populations. For FBL knockdown, a pool of two different FBL-specific shRNAs was used. Indicated P value by an unpaired Student t test. C, Catalytic center of human FBL protein. Amino acid residues highlighted in purple are substrate binding sites. The substrate S-adenosyl-L-homocysteine (SAH) is highlighted in green. The structure is from Protein Data Bank 5GIO. D, Western blot showing expression of V5-tagged exogenous wild-type (WT) and mutant FBL in FBL knockdown Kasumi-1 cells. Numbers on top indicate the relative expression level of total FBL compared with that in control cells. ##V5-tagged exogenous FBL; #endogenous FBL. E, Unsupervised clustering analysis of rRNA 2′-O-Me in FBL knockdown and rescued cells. The wild-type but not mutant FBL restored rRNA 2′-O-Me. F, Colony formation assay showing the rescue effect of wild-type and mutant FBL. Mean ± SD from n = 9 cultures from three experiments per group is given, and statistical significance was assessed by Student unpaired t test. G, Representative bioluminescence imaging of NSG mice transplanted with AML PDX cells overexpressing empty control, mutant FBL (FBLQua), and wild-type FBL. Images were taken at the indicated time points after transplantation. H, Summary of in vivo proliferation of PDX cells determined by bioluminescence imaging. Note that the signal from FBLWT mice was approaching saturation at day 81. n = 4 for empty control, n = 5 for FBLQua, n = 3 for FBLWT, ***, P = 0.001; *, P = 0.023; n.s., no significance, Student unpaired t test. I, Absolute LSC frequency in the bone marrow of each PDX estimated by in vivo limiting dilution assay. P = 0.0189, FBLWT versus empty vector; P = 0.0006, FBLWT versus FBLQua, Chi-square test.
Figure 3. The ribomethylome regulates translation of amino acid transporters. A, Differentially translated proteins after FBL knockdown in Kasumi-1 AML cells. The difference in newly synthesized proteins (by nascent proteomics) was plotted against changes in mRNA (by mRNA-seq). The red dots highlight differentially translated proteins, defined by log2FC > 0.8 (adjust P < 0.05) on nascent protein without changes on the mRNA level. B, Gene ontology analysis of proteins less translated after FBL knockdown. C, Changes of amino acid transporters on nascent protein and mRNA level. Nascent proteins are shown in red, and mRNA expression in gray. D, Western blot showing protein levels of amino acid transporters in PDX cells transduced with empty vector or wild-type FBL. PDX cells were isolated from mice (n = 4 from the empty control group and n = 3 from the FBLWT group) described in Fig. 2H. E, Abundance of cellular amino acid in PDX cells isolated from n = 3 mice each group. F, Comparison of ribosome P-site occupancy on each codon between control and FBL knockdown Kasumi-1 cells. Codons for the same amino acid are shown in the same color. The dashed line indicates log2FC = 0.3. G, Distribution of codons with increased P-site ribosome occupancy in whole-transcriptome, 1,000 random selected transcripts, all amino acid transporter genes, and in amino acid transporter genes with decreased translation after FBL knockdown. The y-axis indicates the proportion of genes within a given range of codons.
Figure 3.
The ribomethylome regulates translation of amino acid transporters. A, Differentially translated proteins after FBL knockdown in Kasumi-1 AML cells. The difference in newly synthesized proteins (by nascent proteomics) was plotted against changes in mRNA (by mRNA-seq). The red dots highlight differentially translated proteins, defined by log2FC > 0.8 (adjust P < 0.05) on nascent protein without changes on the mRNA level. B, Gene ontology analysis of proteins less translated after FBL knockdown. C, Changes of amino acid transporters on nascent protein and mRNA level. Nascent proteins are shown in red and mRNA expression in gray. D, Western blot showing protein levels of amino acid transporters in PDX cells transduced with empty vector or wild-type FBL. PDX cells were isolated from mice (n = 4 from the empty control group and n = 3 from the FBLWT group) described in Fig. 2H. E, Abundance of cellular amino acid in PDX cells isolated from n = 3 mice per group. F, Comparison of ribosome P-site occupancy on each codon between control and FBL knockdown Kasumi-1 cells. Codons for the same amino acid are shown in the same color. The dashed line indicates log2FC = 0.3. G, Distribution of codons with increased P-site ribosome occupancy in whole-transcriptome, 1,000 random selected transcripts, all amino acid transporter genes, and in amino acid transporter genes with decreased translation after FBL knockdown. The y-axis indicates the proportion of genes within a given range of codons.
Figure 4. Gm1447 determines leukemia stem cell activity. A, Methylation levels on G1447 in 5 matched LSC and non-LSC fractions as described in Fig. 1G. Indicated P values by the Student paired t test. B, Variability of Gm1447 in primary AML samples. Shown are three patients with high, medium, and low Gm1447, respectively. G1447 is shown in red, and U1442 with constitutive full methylation in human AMLs is shown in yellow. The arrow indicates +1 position to G1447 that the calculation of the Gm1447 level (score C) is based on (see Methods). C, GSEA showing that samples with high Gm1447 are enriched for LSC genes. Samples were split into two equal groups at a median of Gm1447. D, Comparison of rRNA 2′-O-Me in SNORD127+/+ and SNORD127+/− Kasumi-1 cells. E, Cryo-EM maps of 80S ribosome from SNORD127+/+ and SNORD127+/− Kasumi-1 cells. Highlighted are the 2′-O-Me density at G1447 and the decoding center of the 40S ribosomal subunit. The arrow indicates a density bump of 2′-O-Me on G1447 in SNORD127+/+ cells. F, Nascent proteomics from SNORD127+/+ and SNORD127+/− Kasumi-1 cells. Decreased nascent proteins in SNORD127+/− cells are labeled in blue, and increased nascent proteins are in red. G, Engraftment of SNORD127+/+ and SNORD127+/− OCI-AML2 cells in NSG mice (percentages of leukemic cells among bone marrow cells; each dot represents one mouse; n = 12 mice for SNORD127+/+ group, and n = 10 mice for SNORD127+/−). Two different single clones per group were used for transplantation. Short horizontal line indicates the mean; P values are indicated by Student unpaired t test. H, Survival of mice transplanted with SNORD127+/+ and SNORD127± OCI-AML2 cells. n = 12 mice for control group and n = 10 mice for SNORD127+/−. Indicated P value by log-rank test. I–K, Engraftment of primary AML cells AML03 (I), AML661 (J), and AML494 (K) transduced with empty vector or SNORD127. Each dot represents the bone marrow engraftment in one mouse. Short horizontal line indicates mean; P values are indicated by Student unpaired t test. L, Absolute LSC frequency in primary AML494 cells overexpressing empty vector or SNORD127 estimated by in vivo limiting dilution assay. P = 0.0015, Chi-square test.
Figure 4.
Gm1447 determines LSC activity. A, Methylation levels on G1447 in 5 matched LSC and non-LSC fractions as described in Fig. 1G. Indicated P values by Student paired t test. B, Variability of Gm1447 in primary AML samples. Shown are 3 patients with high, medium, and low Gm1447, respectively. G1447 is shown in red, and U1442 with constitutive full methylation in human AMLs is shown in yellow. The arrow indicates +1 position to G1447 that the calculation of the Gm1447 level (score C) is based on (see Methods). C, Gene set enrichment analysis showing that samples with high Gm1447 are enriched for LSC genes. Samples were split into two equal groups at a median of Gm1447. NES, normalized enrichment score. D, Comparison of rRNA 2′-O-Me in SNORD127+/+ and SNORD127+/− Kasumi-1 cells. E, Cryo-EM maps of the 80S ribosome from SNORD127+/+ and SNORD127+/− Kasumi-1 cells. Highlighted are the 2′-O-Me density at G1447 and the decoding center of the 40S ribosomal subunit. The arrow indicates a density bump of 2′-O-Me on G1447 in SNORD127+/+ cells. F, Nascent proteomics from SNORD127+/+ and SNORD127+/− Kasumi-1 cells. Decreased nascent proteins in SNORD127+/− cells are labeled in blue, and increased nascent proteins are in red. G, Engraftment of SNORD127+/+ and SNORD127+/− OCI-AML2 cells in NSG mice (percentages of leukemic cells among bone marrow cells; each dot represents one mouse; n = 12 mice for the SNORD127+/+ group and n = 10 mice for SNORD127+/−). Two different single clones per group were used for transplantation. Short horizontal line indicates the mean; P values are indicated by Student unpaired t test. H, Survival of mice transplanted with SNORD127+/+ and SNORD127+/- OCI-AML2 cells. n = 12 mice for control group and n = 10 mice for SNORD127+/−. Indicated P value by log-rank test. I–K, Engraftment of primary AML cells AML03 (I), AML661 (J), and AML494 (K) transduced with empty vector or SNORD127. Each dot represents the bone marrow engraftment in one mouse. Short horizontal line indicates mean; P values are indicated by Student unpaired t test. OE, overexpression. L, Absolute LSC frequency in primary AML494 cells overexpressing empty vector or SNORD127 estimated by in vivo limiting dilution assay. P = 0.0015, Chi-square test.

References

    1. Bonnet D, Dick JE. Human acute myeloid leukemia is organized as a hierarchy that originates from a primitive hematopoietic cell. Nat Med 1997;3:730–7. - PubMed
    1. Chua BA, Van Der Werf I, Jamieson C, Signer RAJ. Post-transcriptional regulation of homeostatic, stressed, and malignant stem cells. Cell Stem Cell 2020;26:138–59. - PMC - PubMed
    1. Saba JA, Liakath-Ali K, Green R, Watt FM. Translational control of stem cell function. Nat Rev Mol Cell Biol 2021;22:671–90. - PubMed
    1. Schwanhausser B, Busse D, Li N, Dittmar G, Schuchhardt J, Wolf J, et al. . Global quantification of mammalian gene expression control. Nature 2011;473:337–42. - PubMed
    1. Khan Z, Ford MJ, Cusanovich DA, Mitrano A, Pritchard JK, Gilad Y. Primate transcript and protein expression levels evolve under compensatory selection pressures. Science 2013;342:1100–4. - PMC - PubMed

Publication types